Bitcoin’s Apparent Demand is falling, signaling that market participants are not absorbing new supply.
Long-term holders are now selling at a loss, with BTC’s LTH-SOPR 30-day SMA breaking below 1 and continuing to decline despite brief price recoveries
Rising exchange whale ratio and a falling CMF both confirm that capital is leaving the market even as price posts three consecutive higher closes.
Bitcoin’s recent failure to decisively hold above $70,000 has strengthened bearish conviction, and on-chain data aligns to support it.
As geopolitical tensions continue to suppress risk appetite across global markets, three key metrics are hinting at a single warning for BTC holders: a decline toward $60,000 remains firmly on the table.
How so?
Bitcoin’s Buy-Side Is Failing a Critical Test
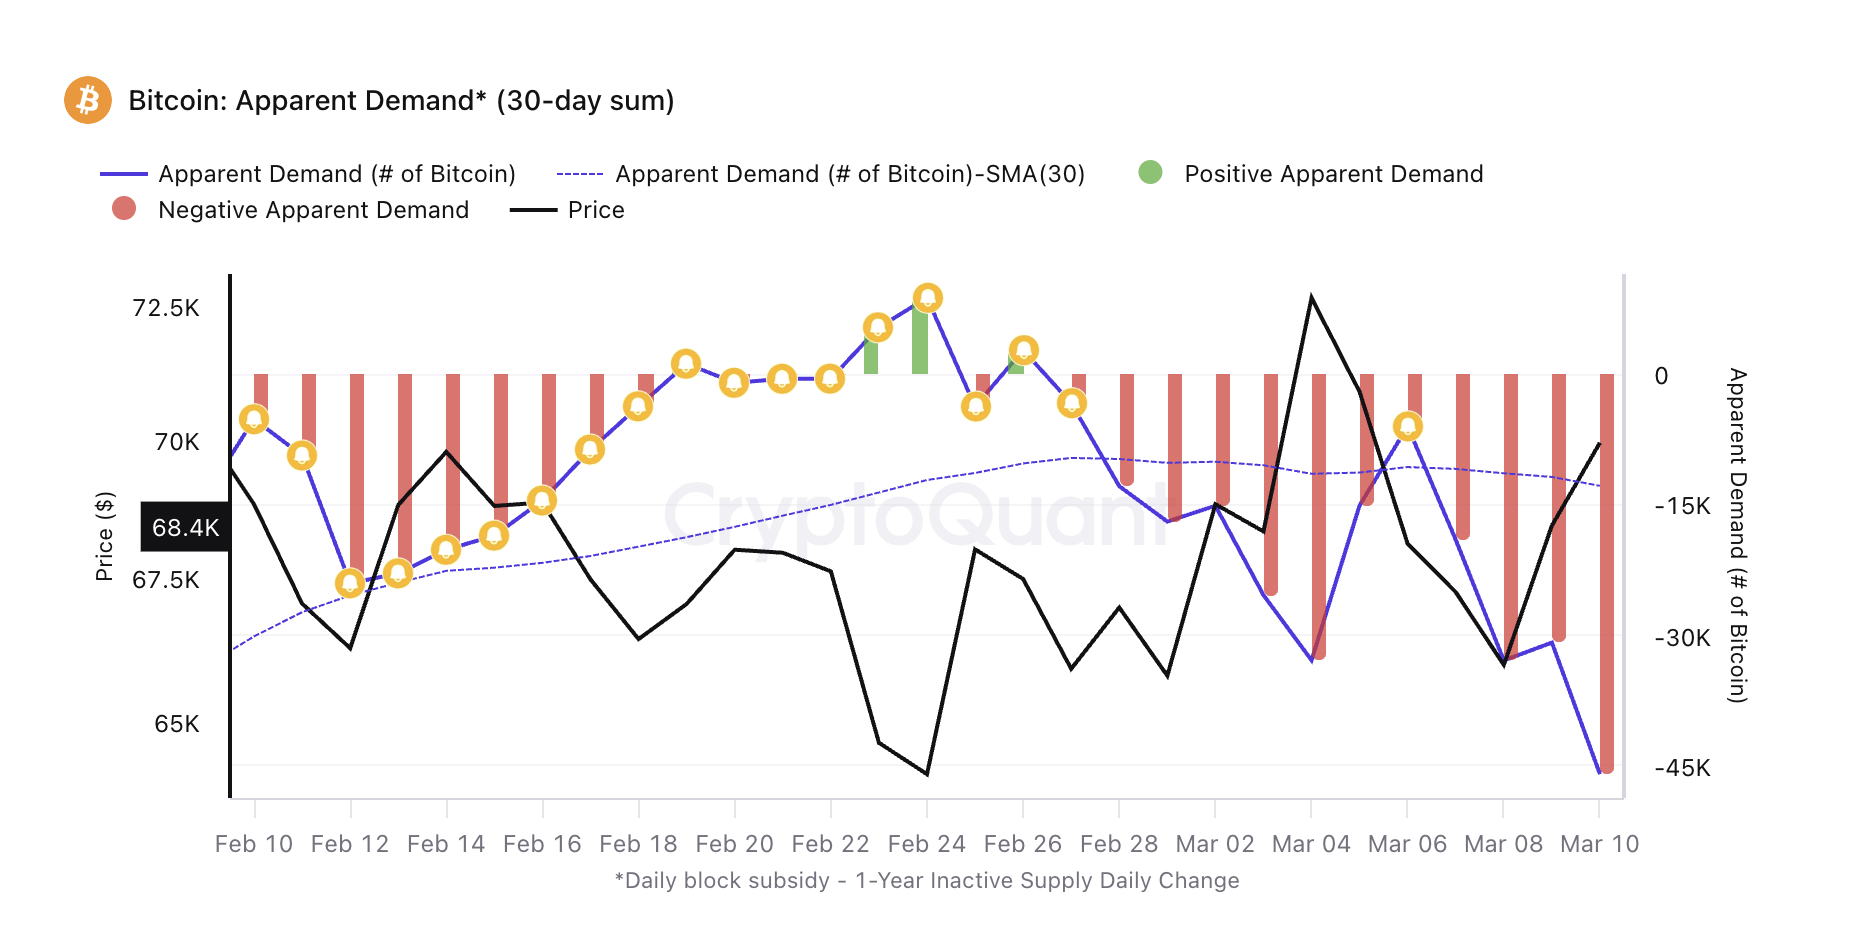
The first key metric to assess here is BTC’s Apparent Demand. According to CryptoQuant, this metric has been almost entirely negative since early February, and fell to a low of -46,000 BTC on March 10.
Bitcoin’s Apparent Demand tracks whether new demand is strong enough to absorb ongoing supply from miners and long-term holders. When its value is positive, strong market demand absorbs the coin’s new issuance.
Conversely, negative values like BTC signal a weak buy-side pressure, which may bring the coin’s price lower.
For context, BTC’s Apparent Demand has been almost entirely in negative territory since the beginning of February.
The persistent negative demand reading suggests that market participants are not aggressively absorbing new supply.
This absence of buying pressure is a bearish signal — and historically, prolonged negative apparent demand has preceded price corrections.
Long-Term Holders Are Selling at a Loss
Another reason BTC’s price may remain under pressure is that long-term holders (LTHs) are increasingly offloading their coins at a loss, further dampening already fragile market confidence.
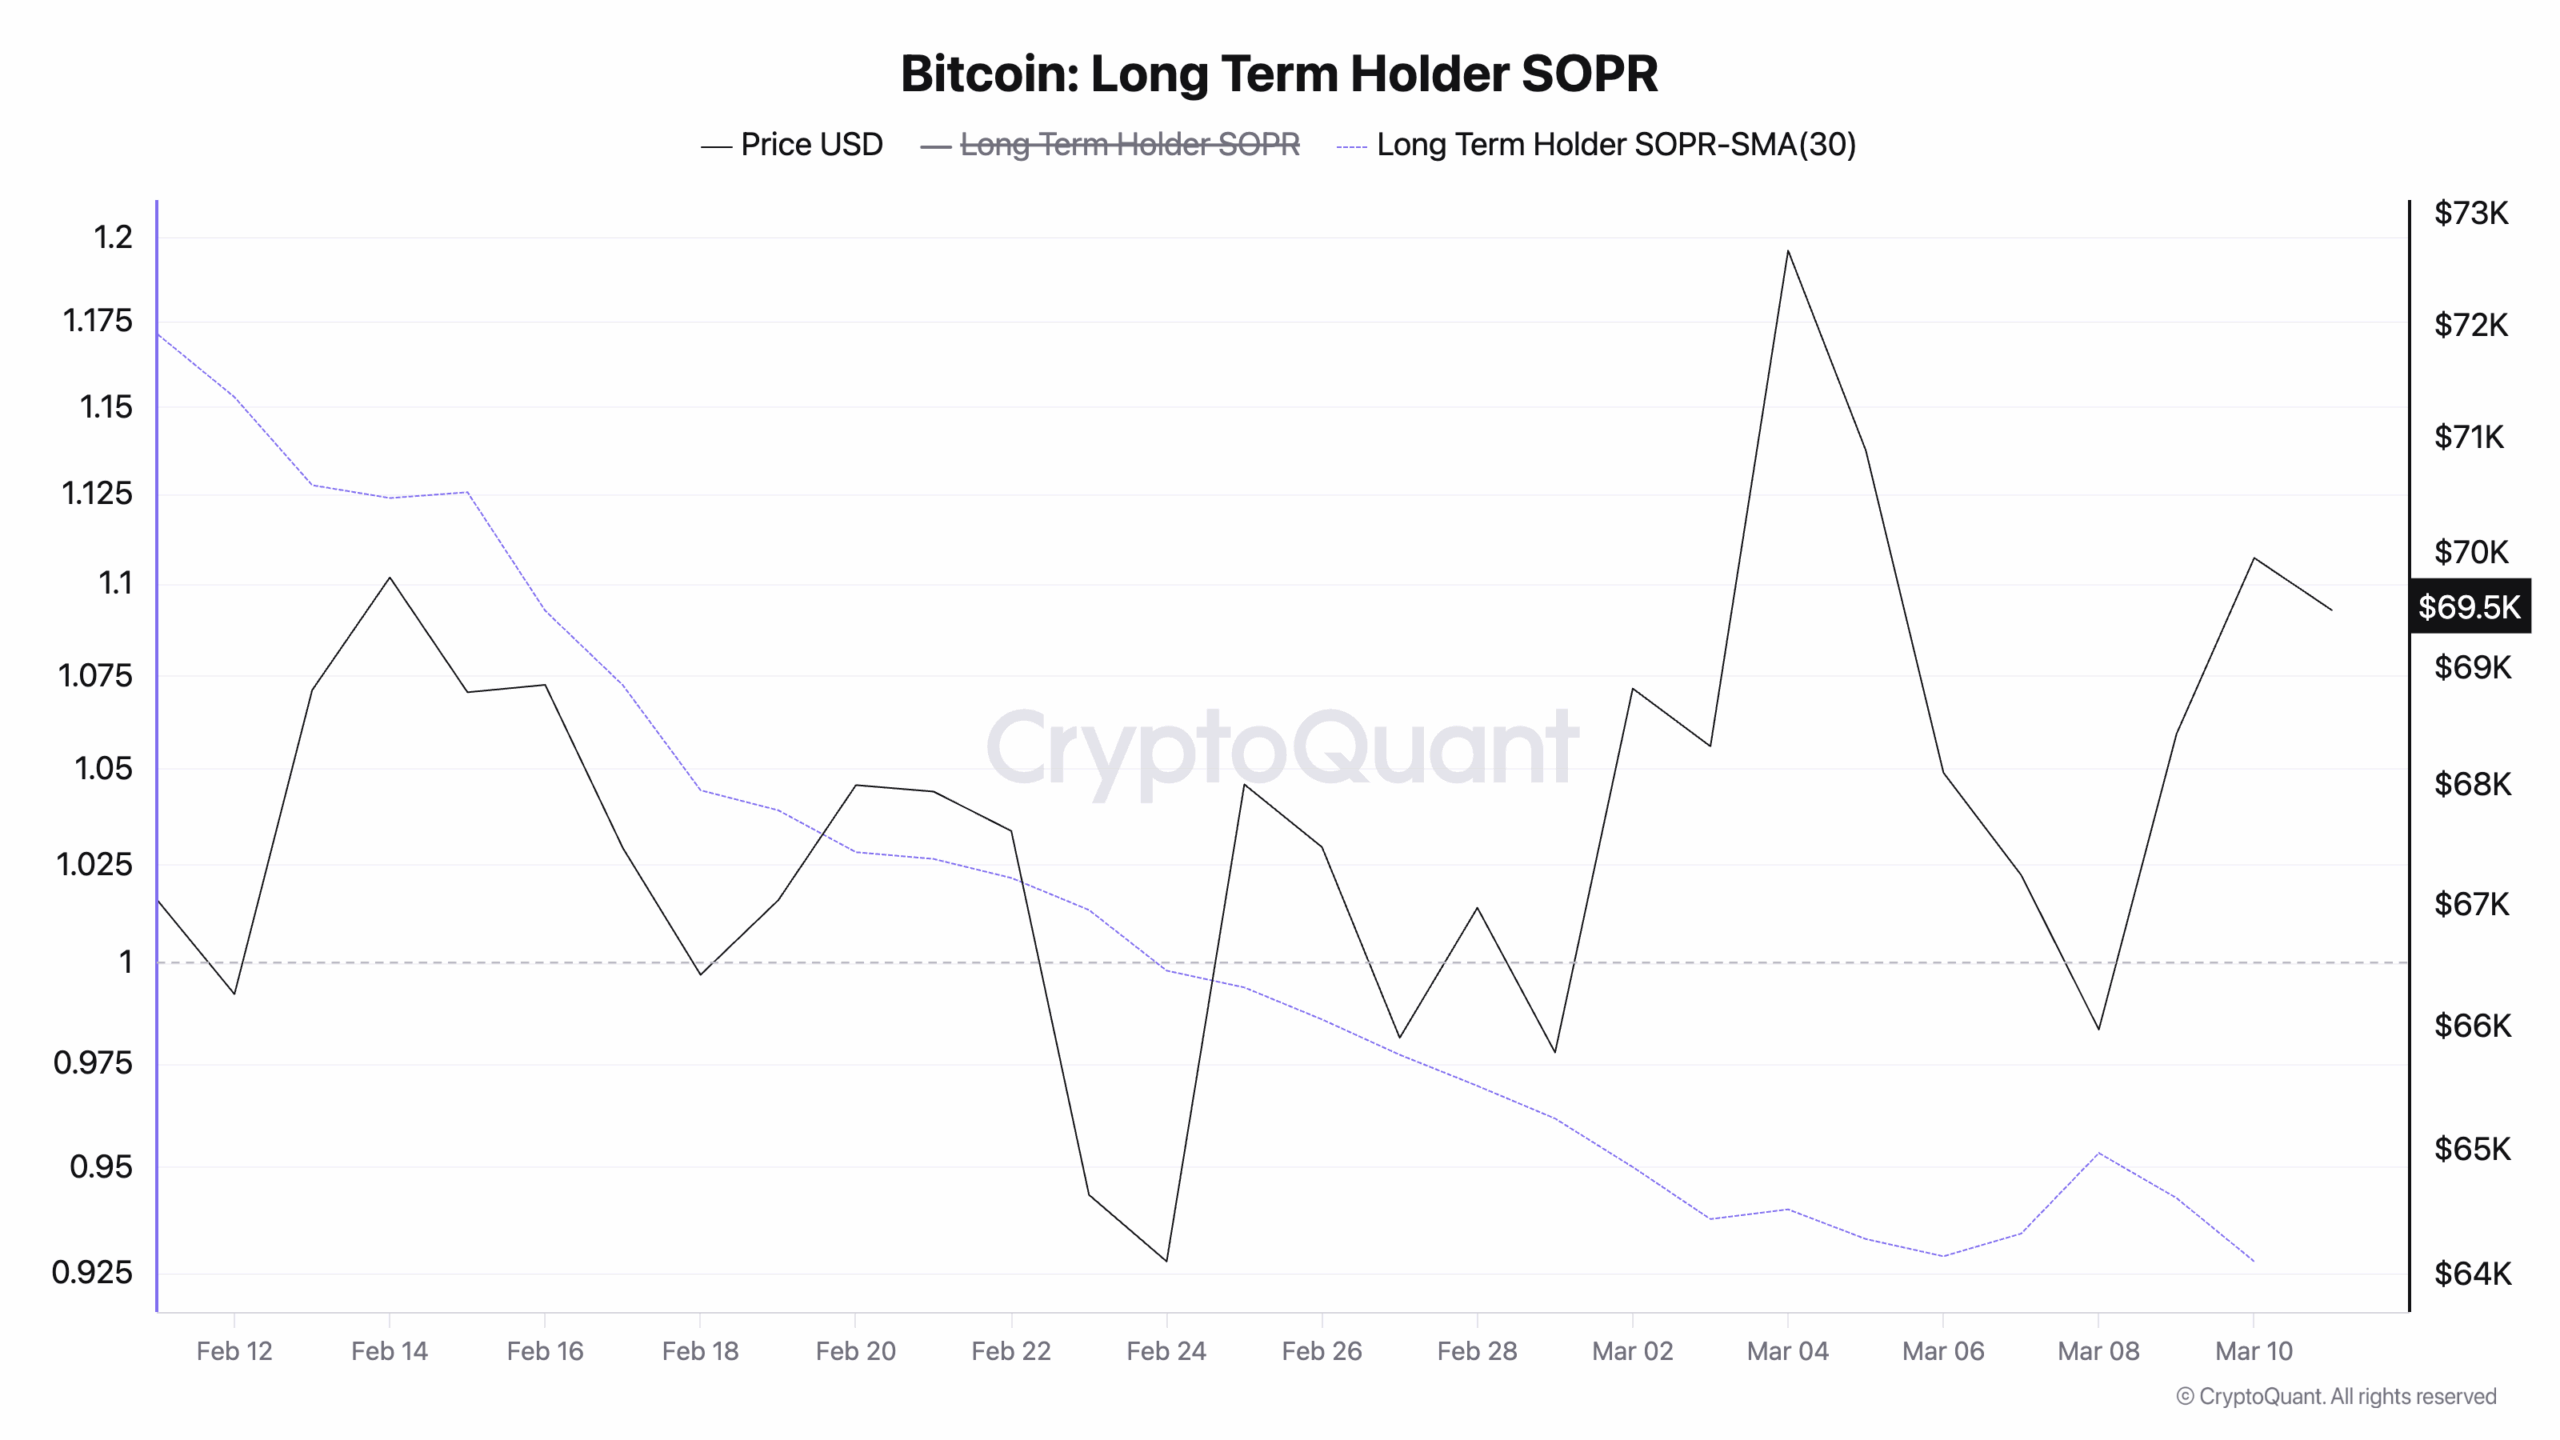
The asset’s falling Long-Term Holder Spent Output Profit Ratio (LTH-SOPR) confirms this.
Per CryptoQuant, this metric tracks whether investors who have held their coins for more than 155 days are selling at a profit or at a loss. A reading above 1 signals profitable exits, while a reading below 1 signals capitulation.
For BTC, its LTH-SOPR (30-day SMA) has trended downward since mid-February, breaking below the 1 threshold on February 24. Despite brief price recoveries, the SMA has continued to decline.
Bitcoin Long Term Holder SOPR | Credit: CryptoQuant
This is a historically significant development because LTHs are typically the market’s most patient cohort, accumulating through downturns and selling into strength.
When they begin to exit at a loss like this, it signals they are losing hope of a near-term recovery.
Bitcoin Whales Are Quietly Dumping
An assessment of BTC whale activity also reveals another concerning trend. BTC’s inability to stabilize above $70,000 has triggered selloffs from these large holders.
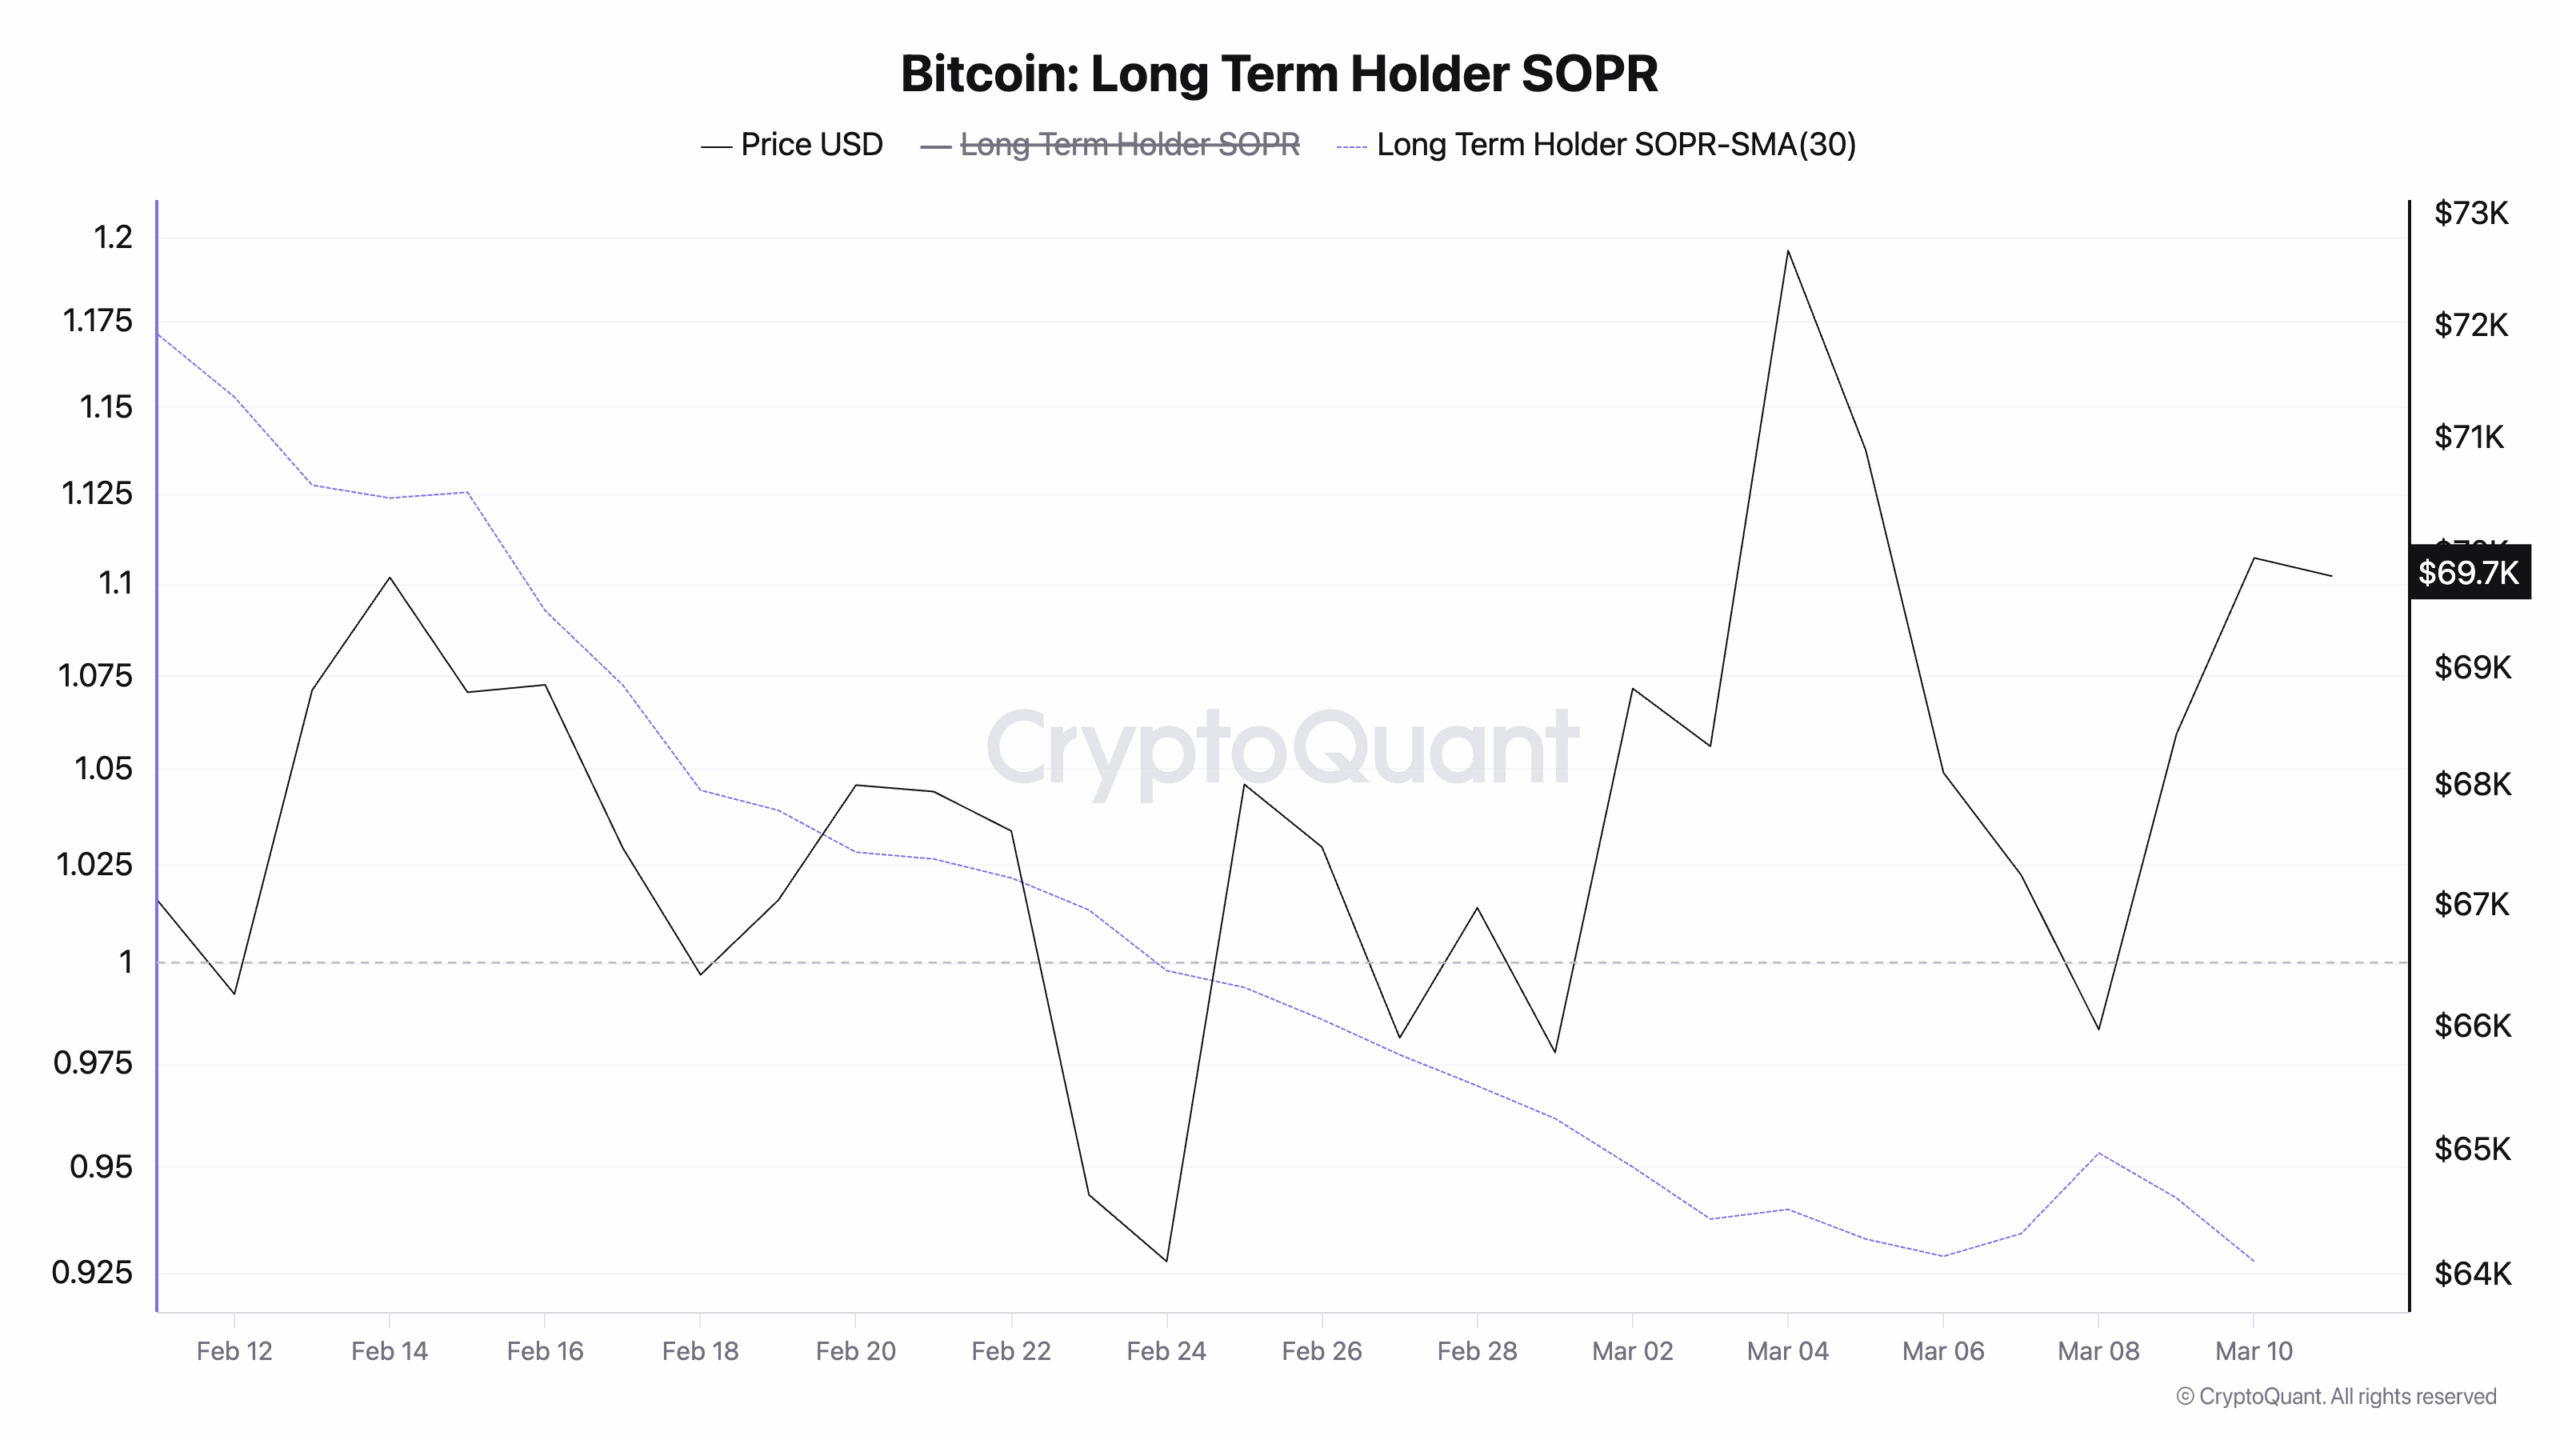
The coin’s Exchange Whale Ratio (30d SMA) — which measures the proportion of large-volume transactions flowing into exchanges — has been slowly trending upward over the past month. As of this writing, it sits at 0.55.
Bitcoin Long Term Holder SOPR| Credit: CryptoQuant
A rising ratio like this indicates that whales are sending significant BTC to exchanges, the most common indicator of distribution.
Bitcoin Closes Higher Three Days Straight — But Money Continues To Flow Out
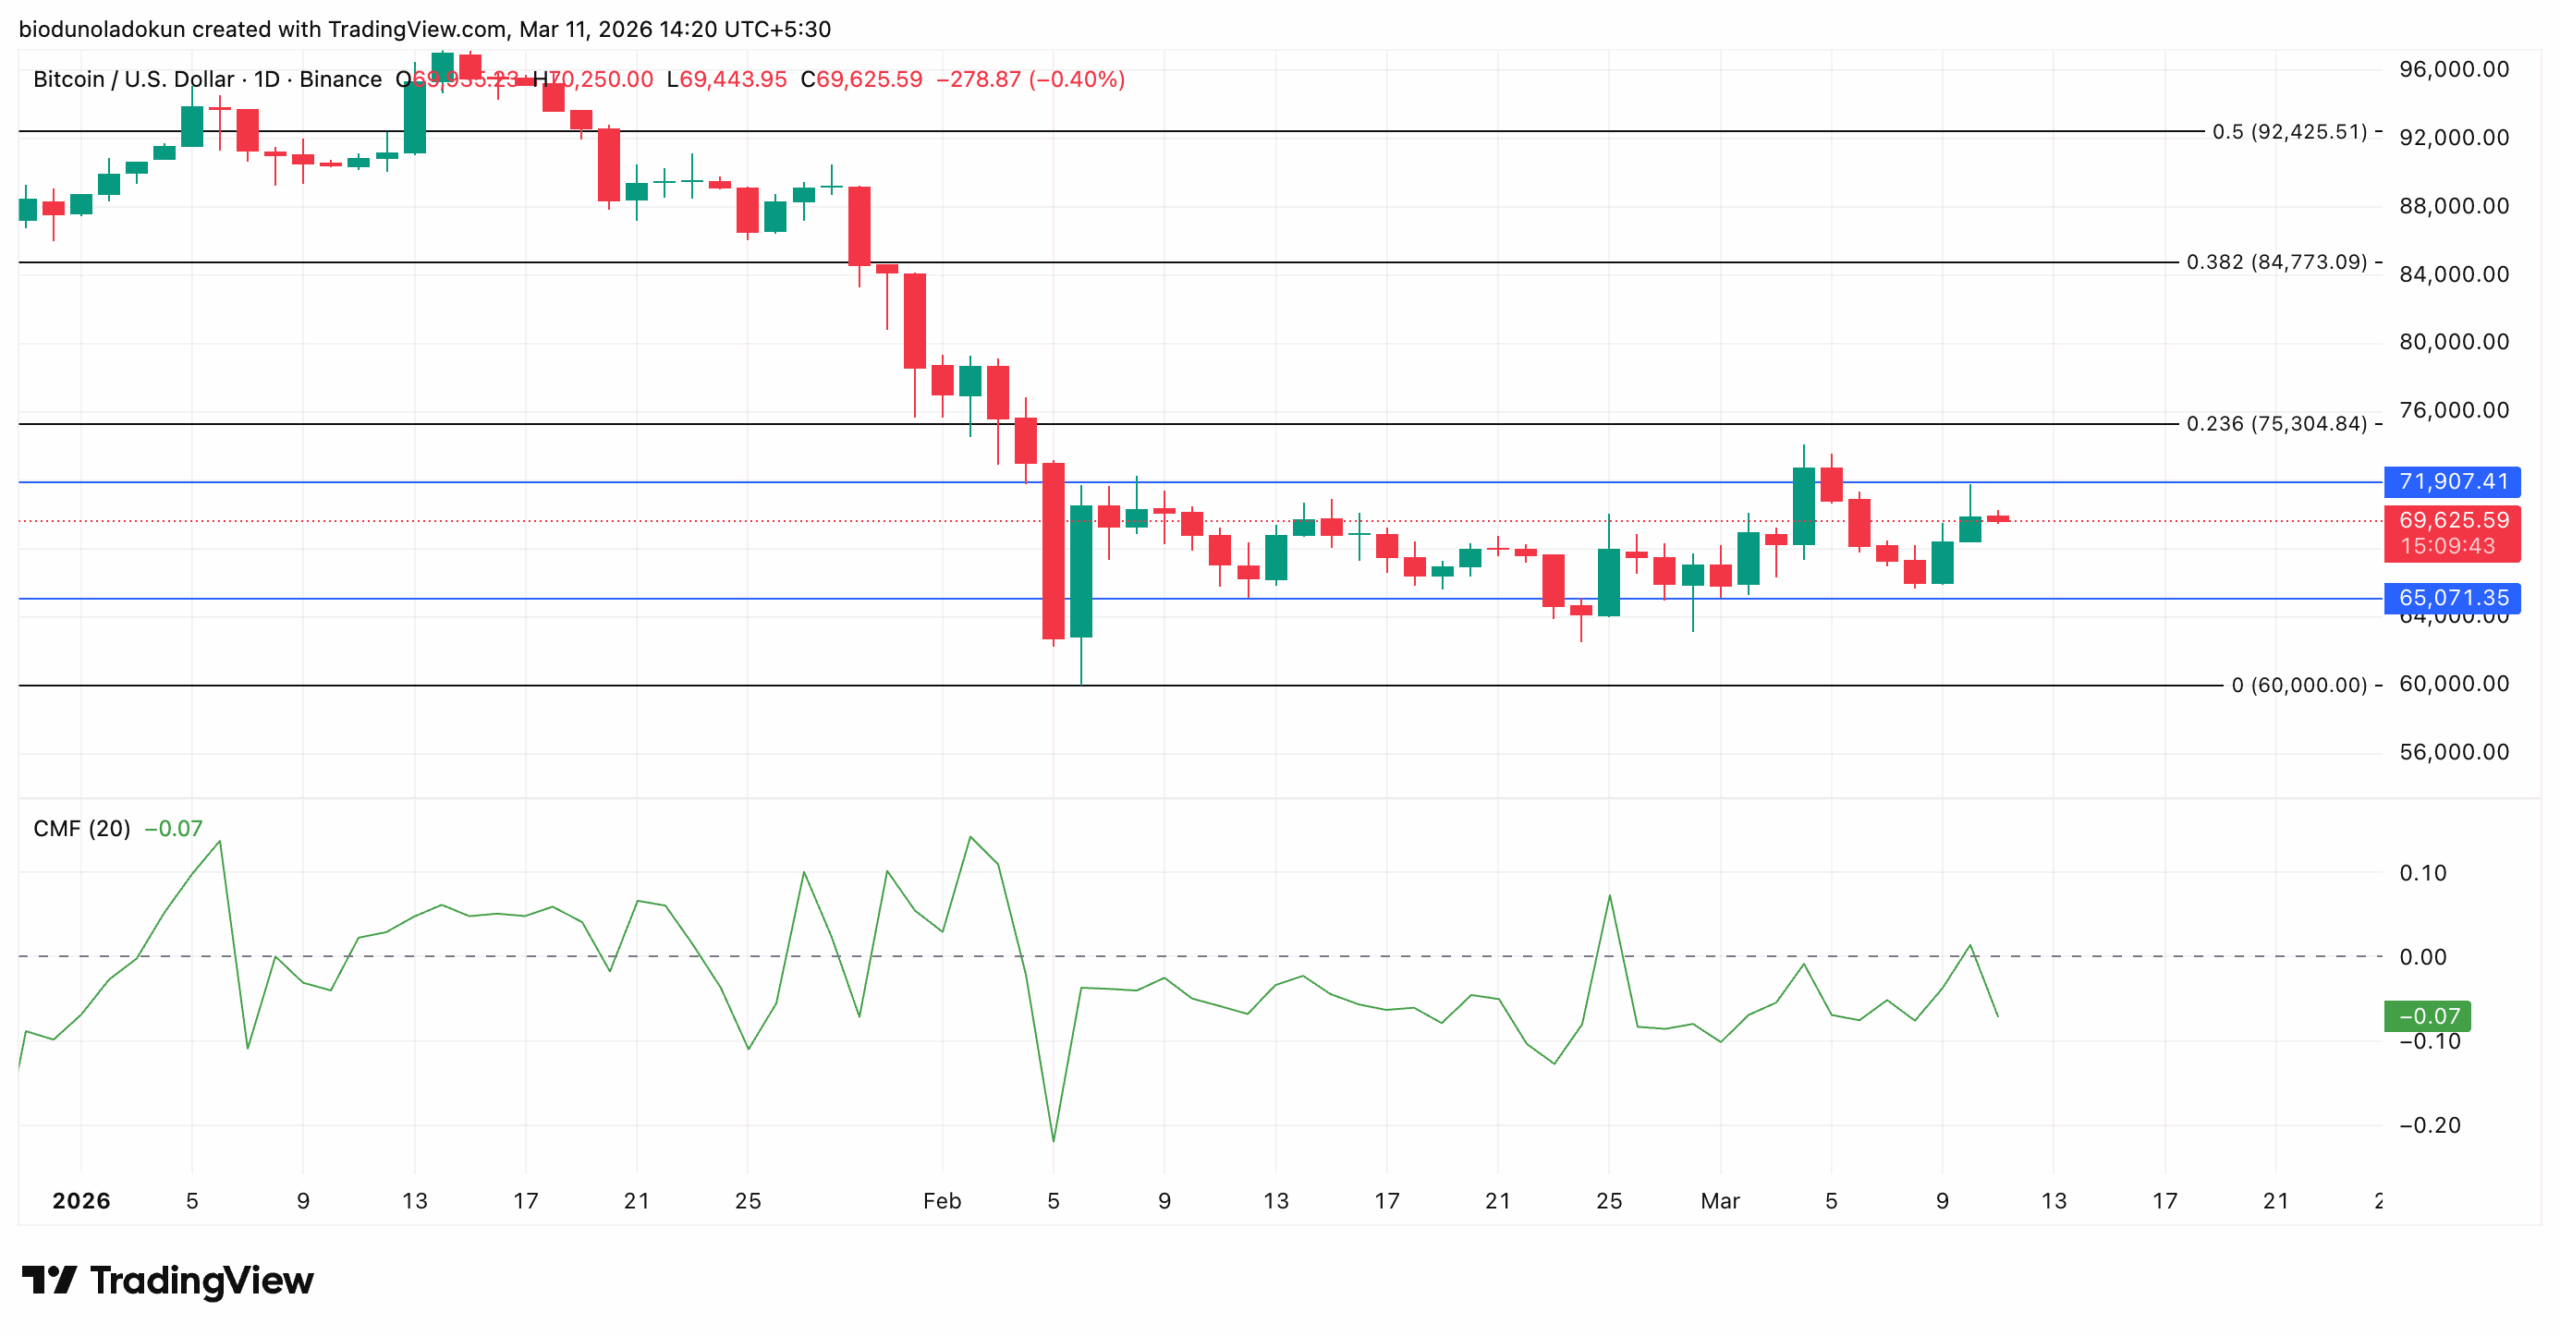
An assessment of BTC’s daily chart shows that the coin has closed at a new price high for three consecutive days, even while remaining within a horizontal channel.
However, the Chaikin Money Flow (CMF) — a key indicator that tracks capital inflows and outflows — has dropped below the zero line and is trending downward, creating a clear bearish divergence.
When such a divergence emerges, it signals that an asset’s price rally is losing underlying strength.
This means that even though some spot buyers are still attempting to push BTC higher, capital inflows into the asset are largely declining.
This dynamic typically precedes a reversal, as price cannot sustain upward momentum without meaningful market participation to back it.
If buying pressure remains weak, BTC may trend lower toward support at $65,071. Should bulls fail to defend that level, the coin risks extending its decline to $60,000.
Disclaimer:
The information provided in this article is for informational purposes only. It is not intended to be, nor should it be construed as, financial advice. We do not make any warranties regarding the completeness, reliability, or accuracy of this information. All investments involve risk, and past performance does not guarantee future results. We recommend consulting a financial advisor before making any investment decisions.
Abiodun Oladokun is a Research Analyst at CCN, where he covers cryptocurrency markets with a focus on on-chain analysis, technical assessments, and emerging trends across decentralized finance (DeFi), real-world assets (RWA), artificial intelligence (AI), decentralized physical infrastructure networks (DePIN), Layer 2s, and meme coins.
Prior to CCN, he served as a Senior On-Chain Analyst at BeInCrypto, producing market reports spanning diverse crypto sectors.
Before that, he conducted technical analysis and market assessments of various altcoins at AMBCrypto, where he also contributed long-form quarterly research papers on DeFi, NFTs, DAOs, and scaling architectures, leveraging on-chain platforms including Messari, Santiment, DefiLlama, and Dune Analytics.
He began his crypto career as a research analyst at SixthSense DAO, developing blockchain forensic tools to trace the history of stolen assets.
Abiodun is a lawyer called to the Nigerian Bar and the founder of Ilé Ijó, a Lagos-based electronic dance music collective.