Litecoin searches for a bottom after hitting its lowest since Aug 2024 | Credit: Hameem Sarwar
Share
Key Takeaways
Litecoin is testing long-term support near multi-month lows, with rising volume.
Despite stabilization signals, LTC’s price remains in a broader downtrend.
A bounce from the $58 zone could trigger a corrective rally toward $70.
Litecoin (LTC) stands at a critical juncture as it tests long-term support levels.
After plummeting to its lowest level since August 2024, the market shows early signs of stabilization, with indicators hinting at a potential rebound.
However, Litecoin’s price is down 33% since the Start of 2026.
Yet, over the past 24 hours, LTC’s trading volume has surged by 14%, reflecting rising interest in the coin. However, this is not necessarily from buyers.
Is LTC ready for a short-term rebound, or is this a temporary pause?
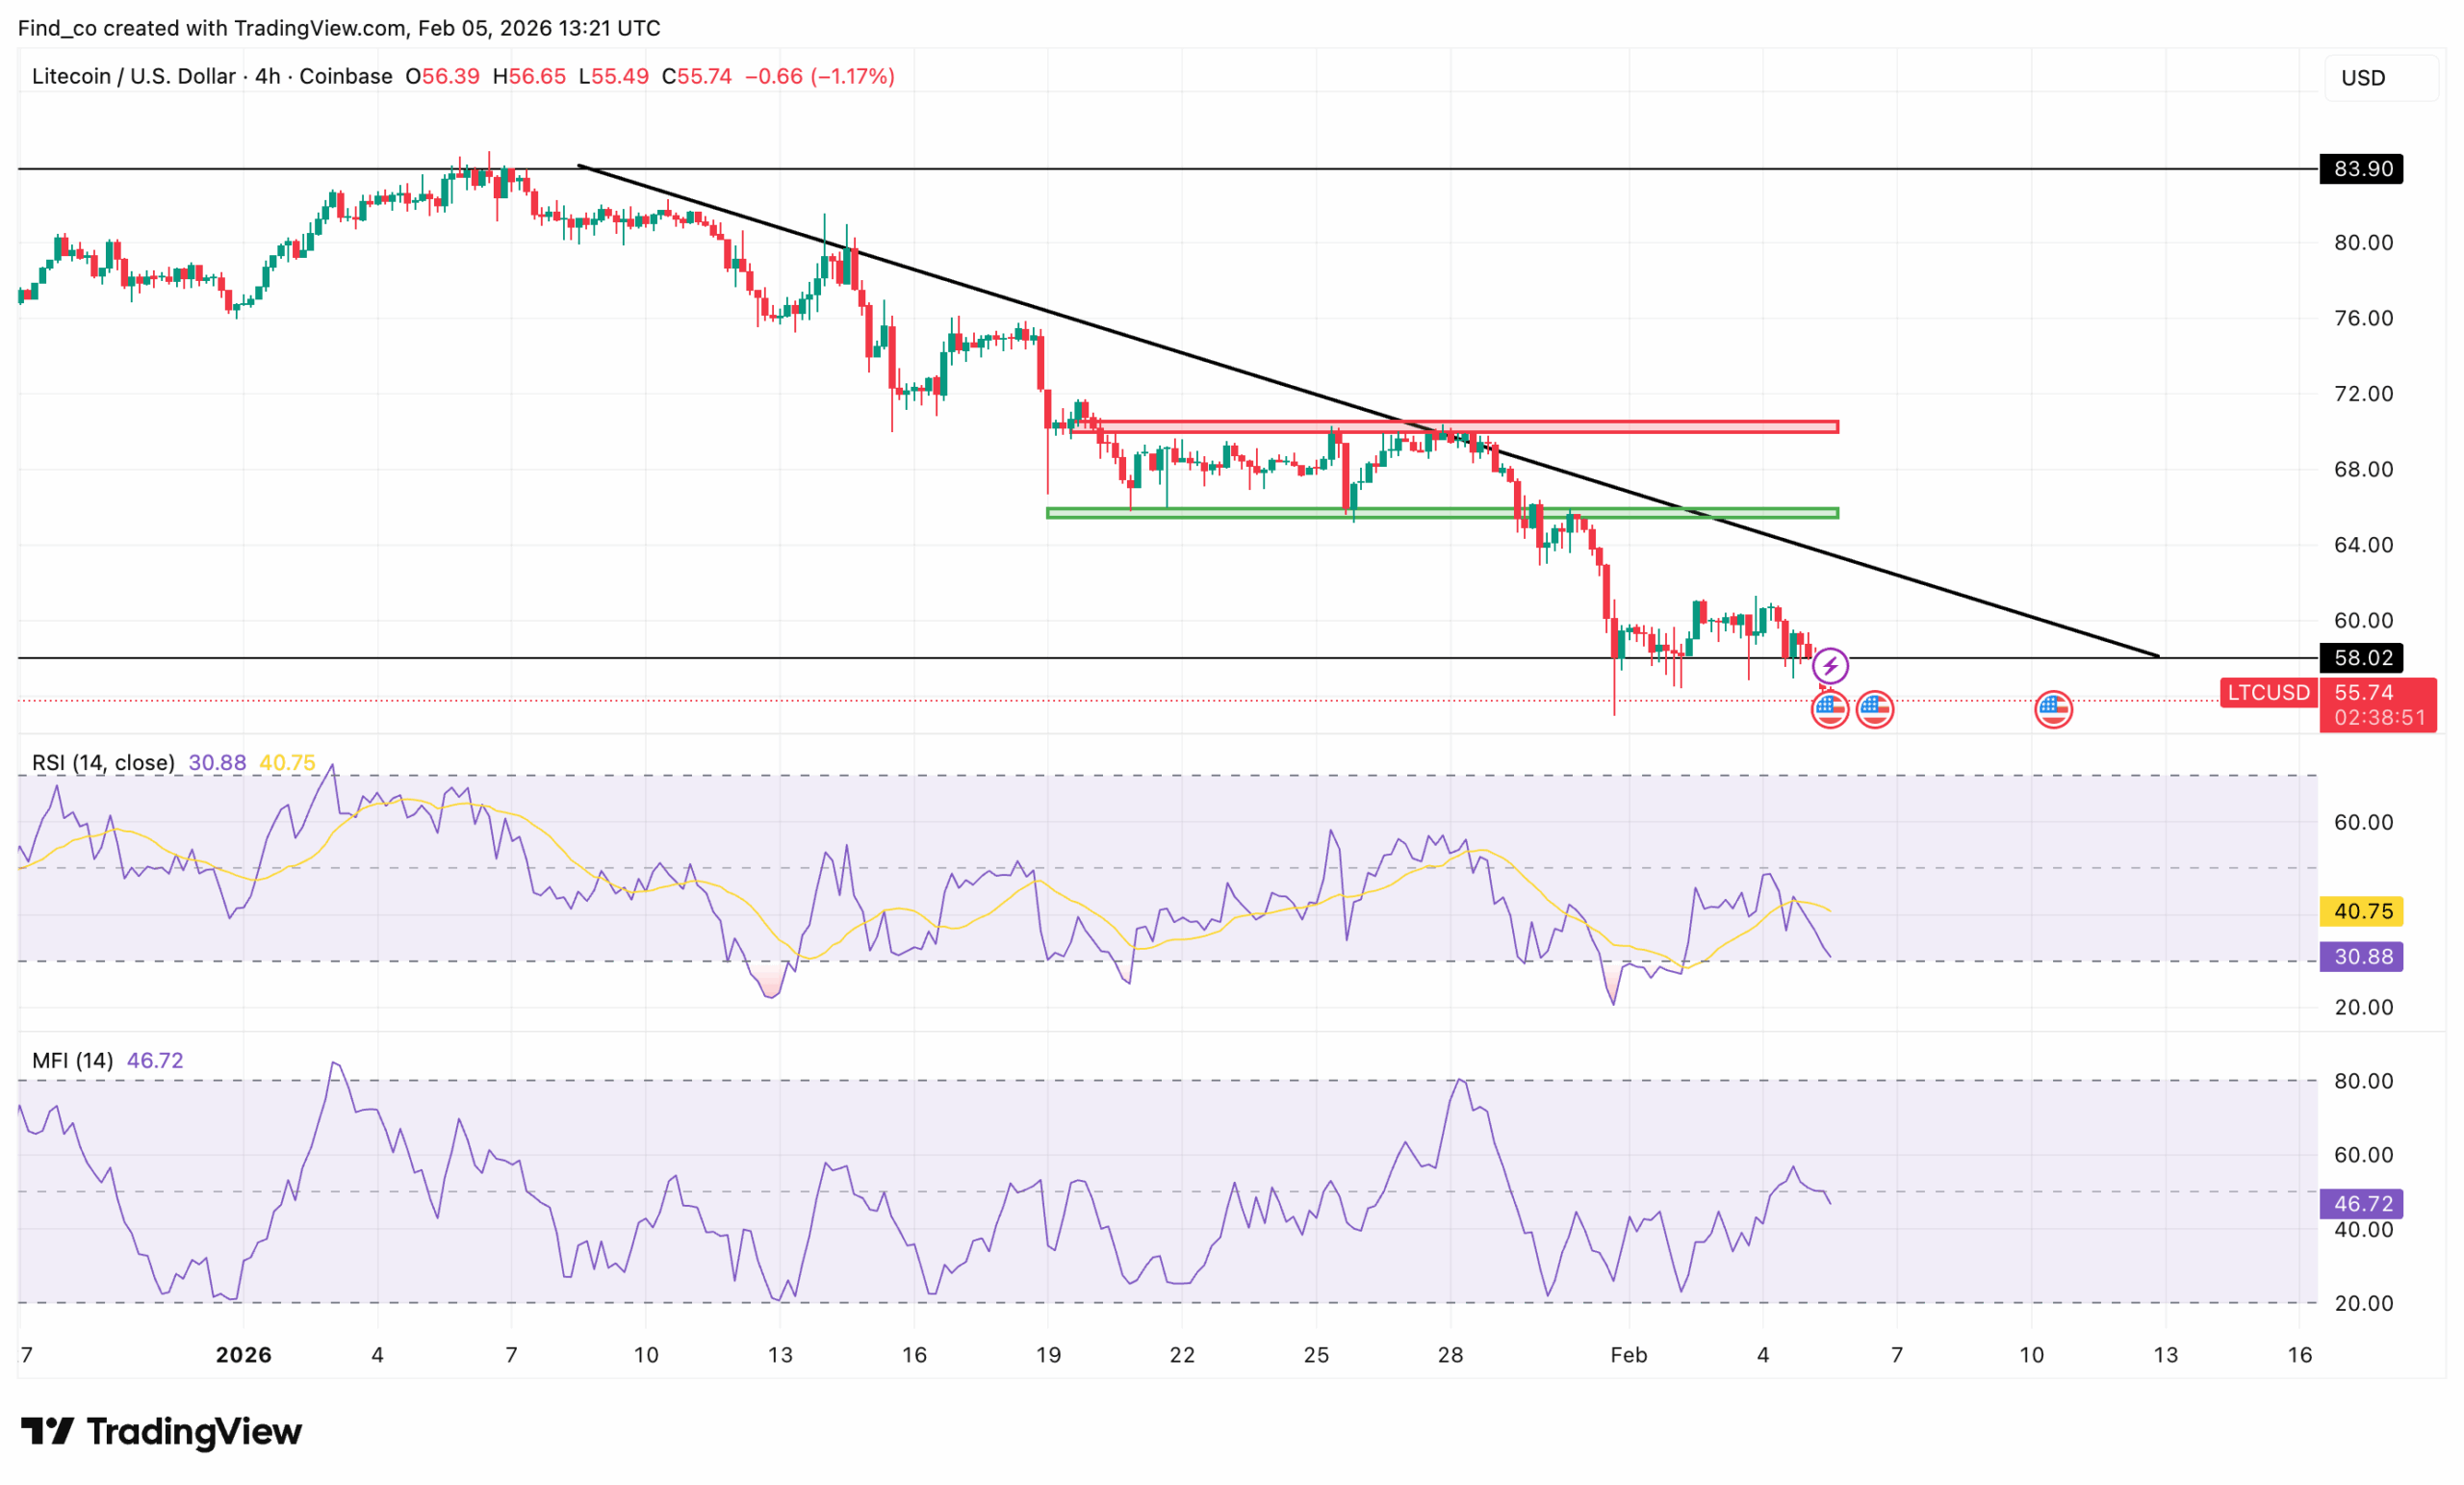
On the 4-hour chart, the Relative Strength Index (RSI) sits at 42.20, tilting upwards as it approaches a potential cross above the 50 midline, signaling growing bullish momentum.
At the same time, the Money Flow Index (MFI) has flipped positive, indicating an influx of buying pressure.
Structurally, LTC is near a 17-month low, a classic accumulation zone where bulls often step in, suggesting this level could serve as a rebound zone.
If momentum builds, Litecoin’s price may challenge resistance around $70.20, while critical support at $64.66 will likely dictate whether the recovery holds or fizzles.
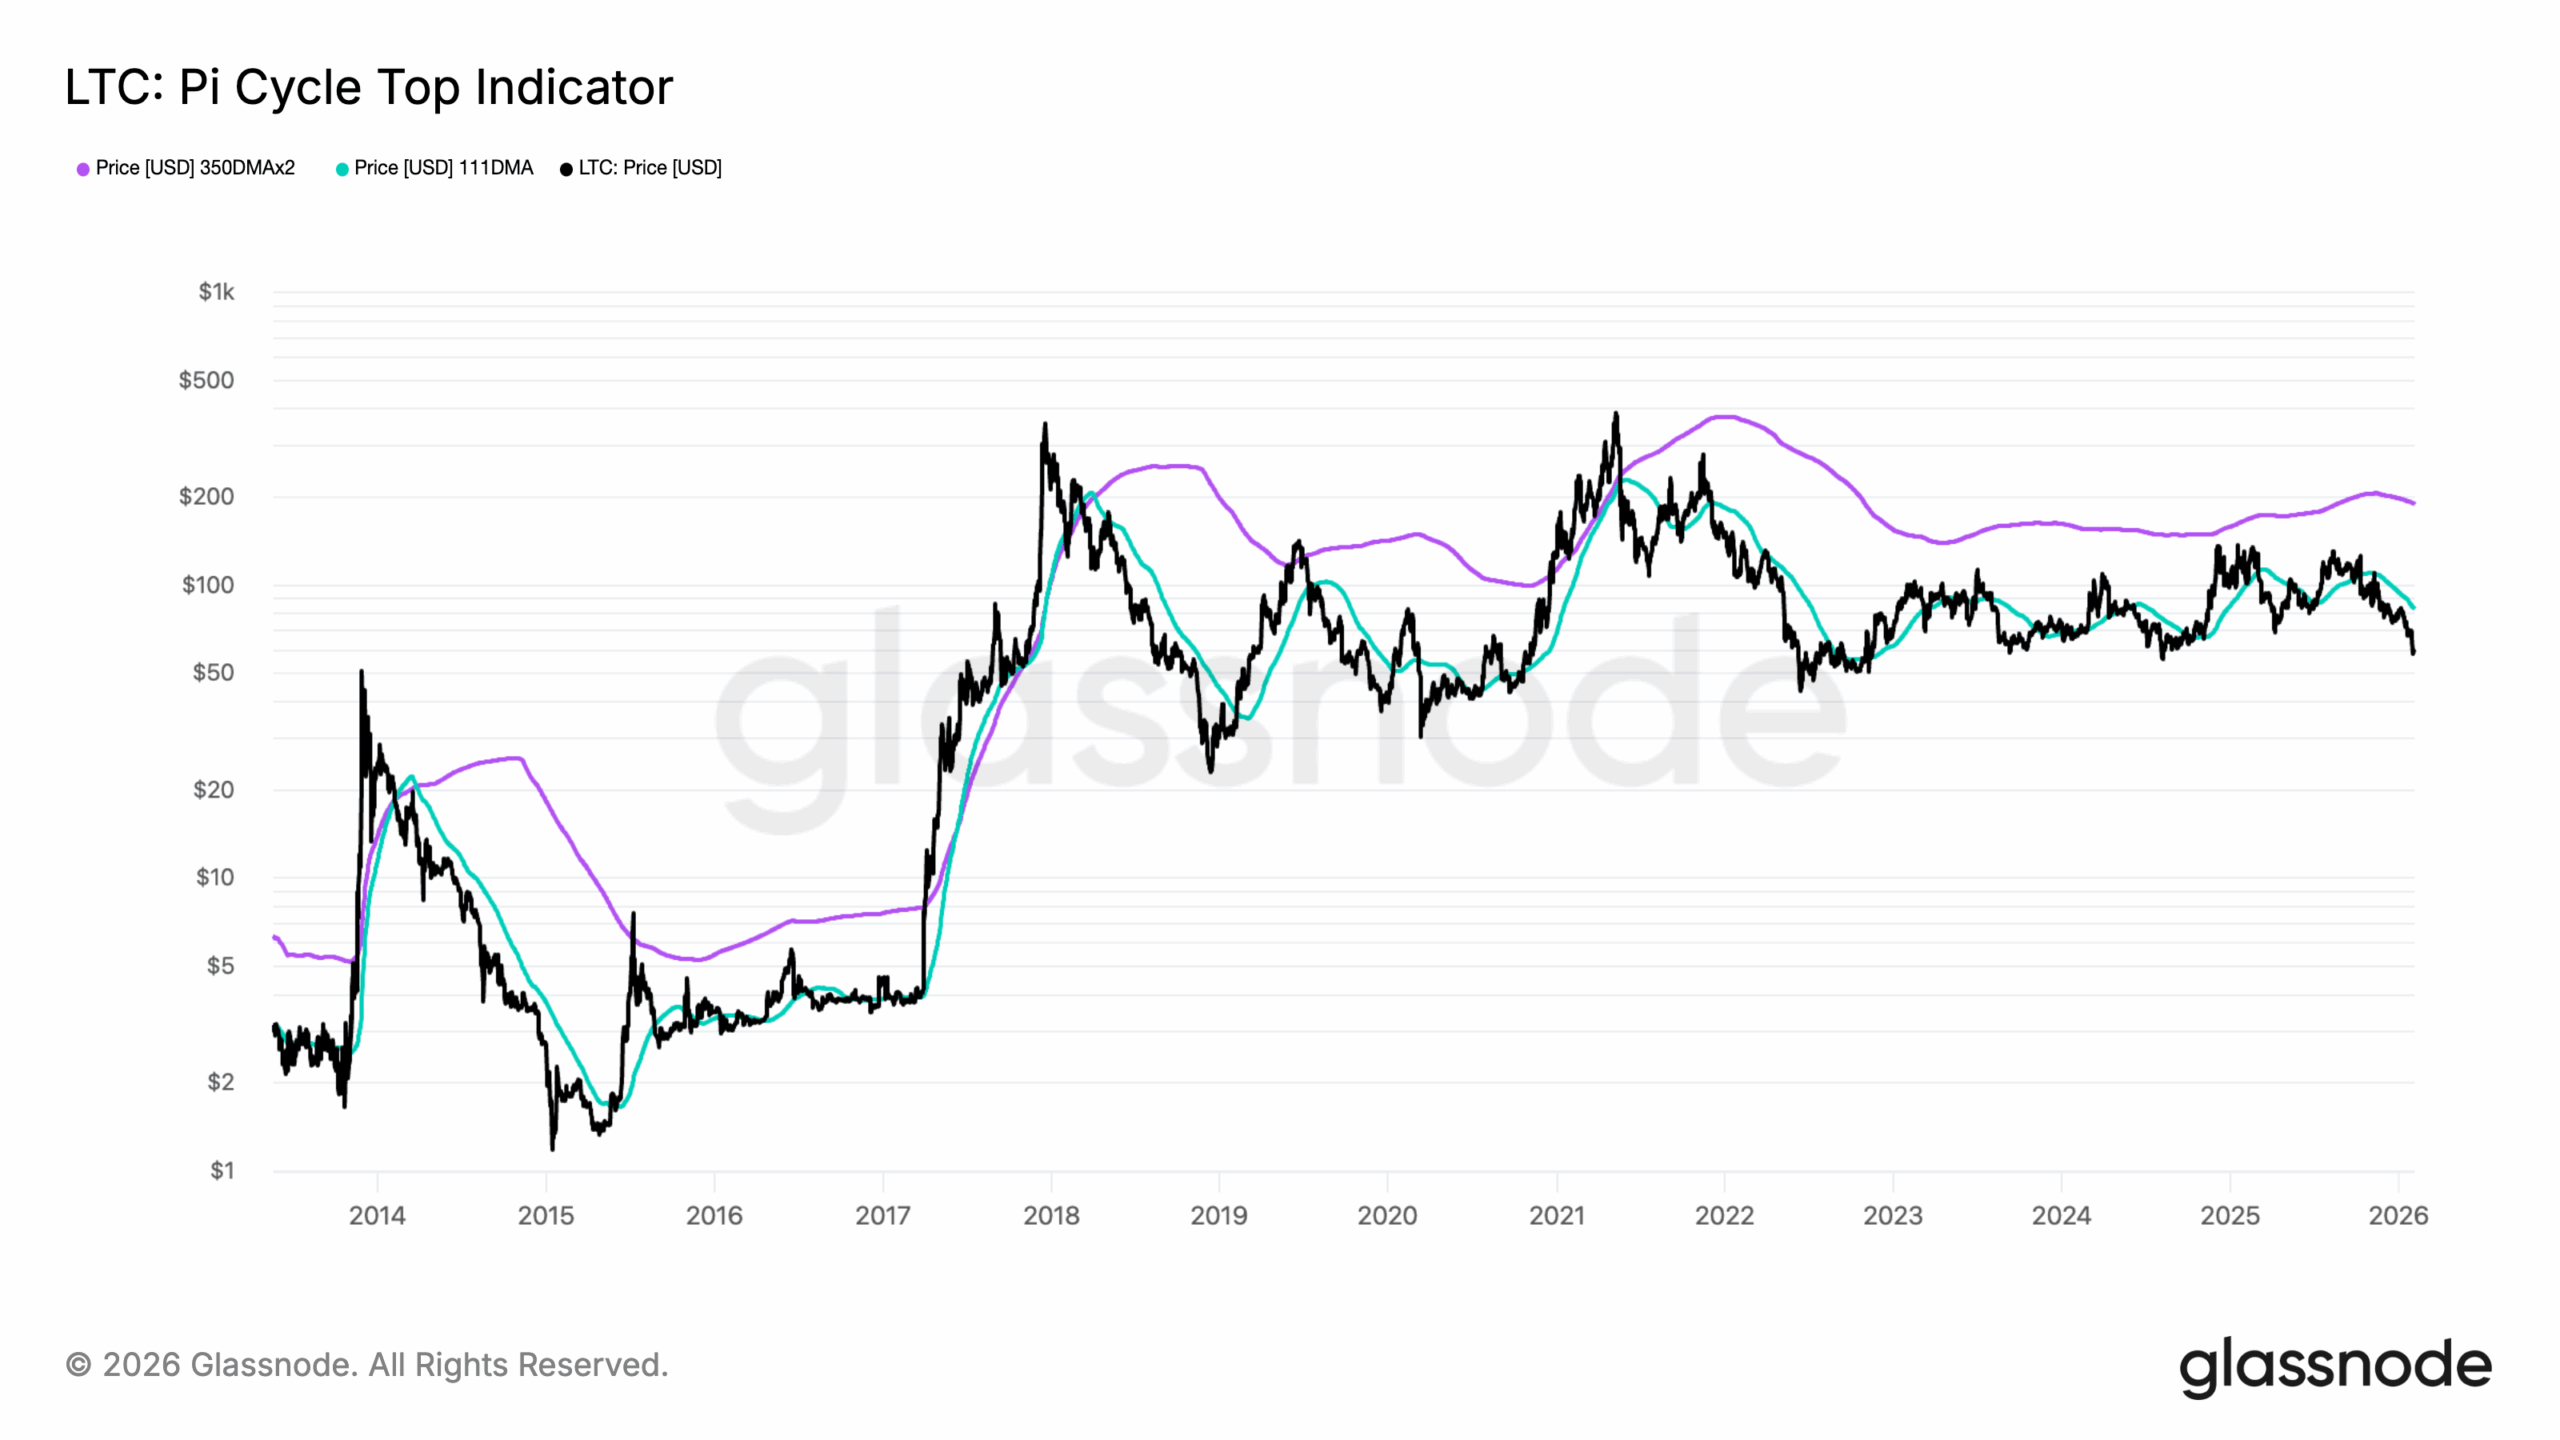
Looking at on-chain data, Litecoin’s Pi Cycle Top indicator is flashing a caution signal.
As shown in the chart below, the 111-day moving average (fast line) is approaching twice the 350-day moving average (slow line).
However, as of now, the two lines have not crossed. That distinction matters. Previous cycle peaks in 2013, 2017, 2018, and 2021 were confirmed only after a clear crossover, followed by sharp downside moves in Litecoin’s price.
In recent times, LTC has rolled over from recent highs and is trading below prior cycle peaks. Unlike past tops, LTC’s price is not in a parabolic expansion phase.
Instead, it is moving sideways to lower, indicating distribution rather than euphoric blow-off behavior.
Looking ahead, the metric suggests risk is rising, not that a top is guaranteed. If the fast MA crosses above the slow MA, history implies elevated odds of a deeper drawdown and a prolonged cooling phase.
On the other hand, if the lines diverge again without crossing, Litecoin could remain in an extended consolidation cycle. In fact, that could be similar to the 2019-2020 or 2023-2024 cycle.
Notably, this signals persistent bearish pressure over the past several weeks.
This pattern shows that sellers have dominated the market, pushing prices down incrementally. Amid this, short-term rallies have failed to gain lasting traction.
The channel provides a clear framework for traders, highlighting immediate resistance at the upper boundary and critical support near the lower boundary, where accumulation zones may form.
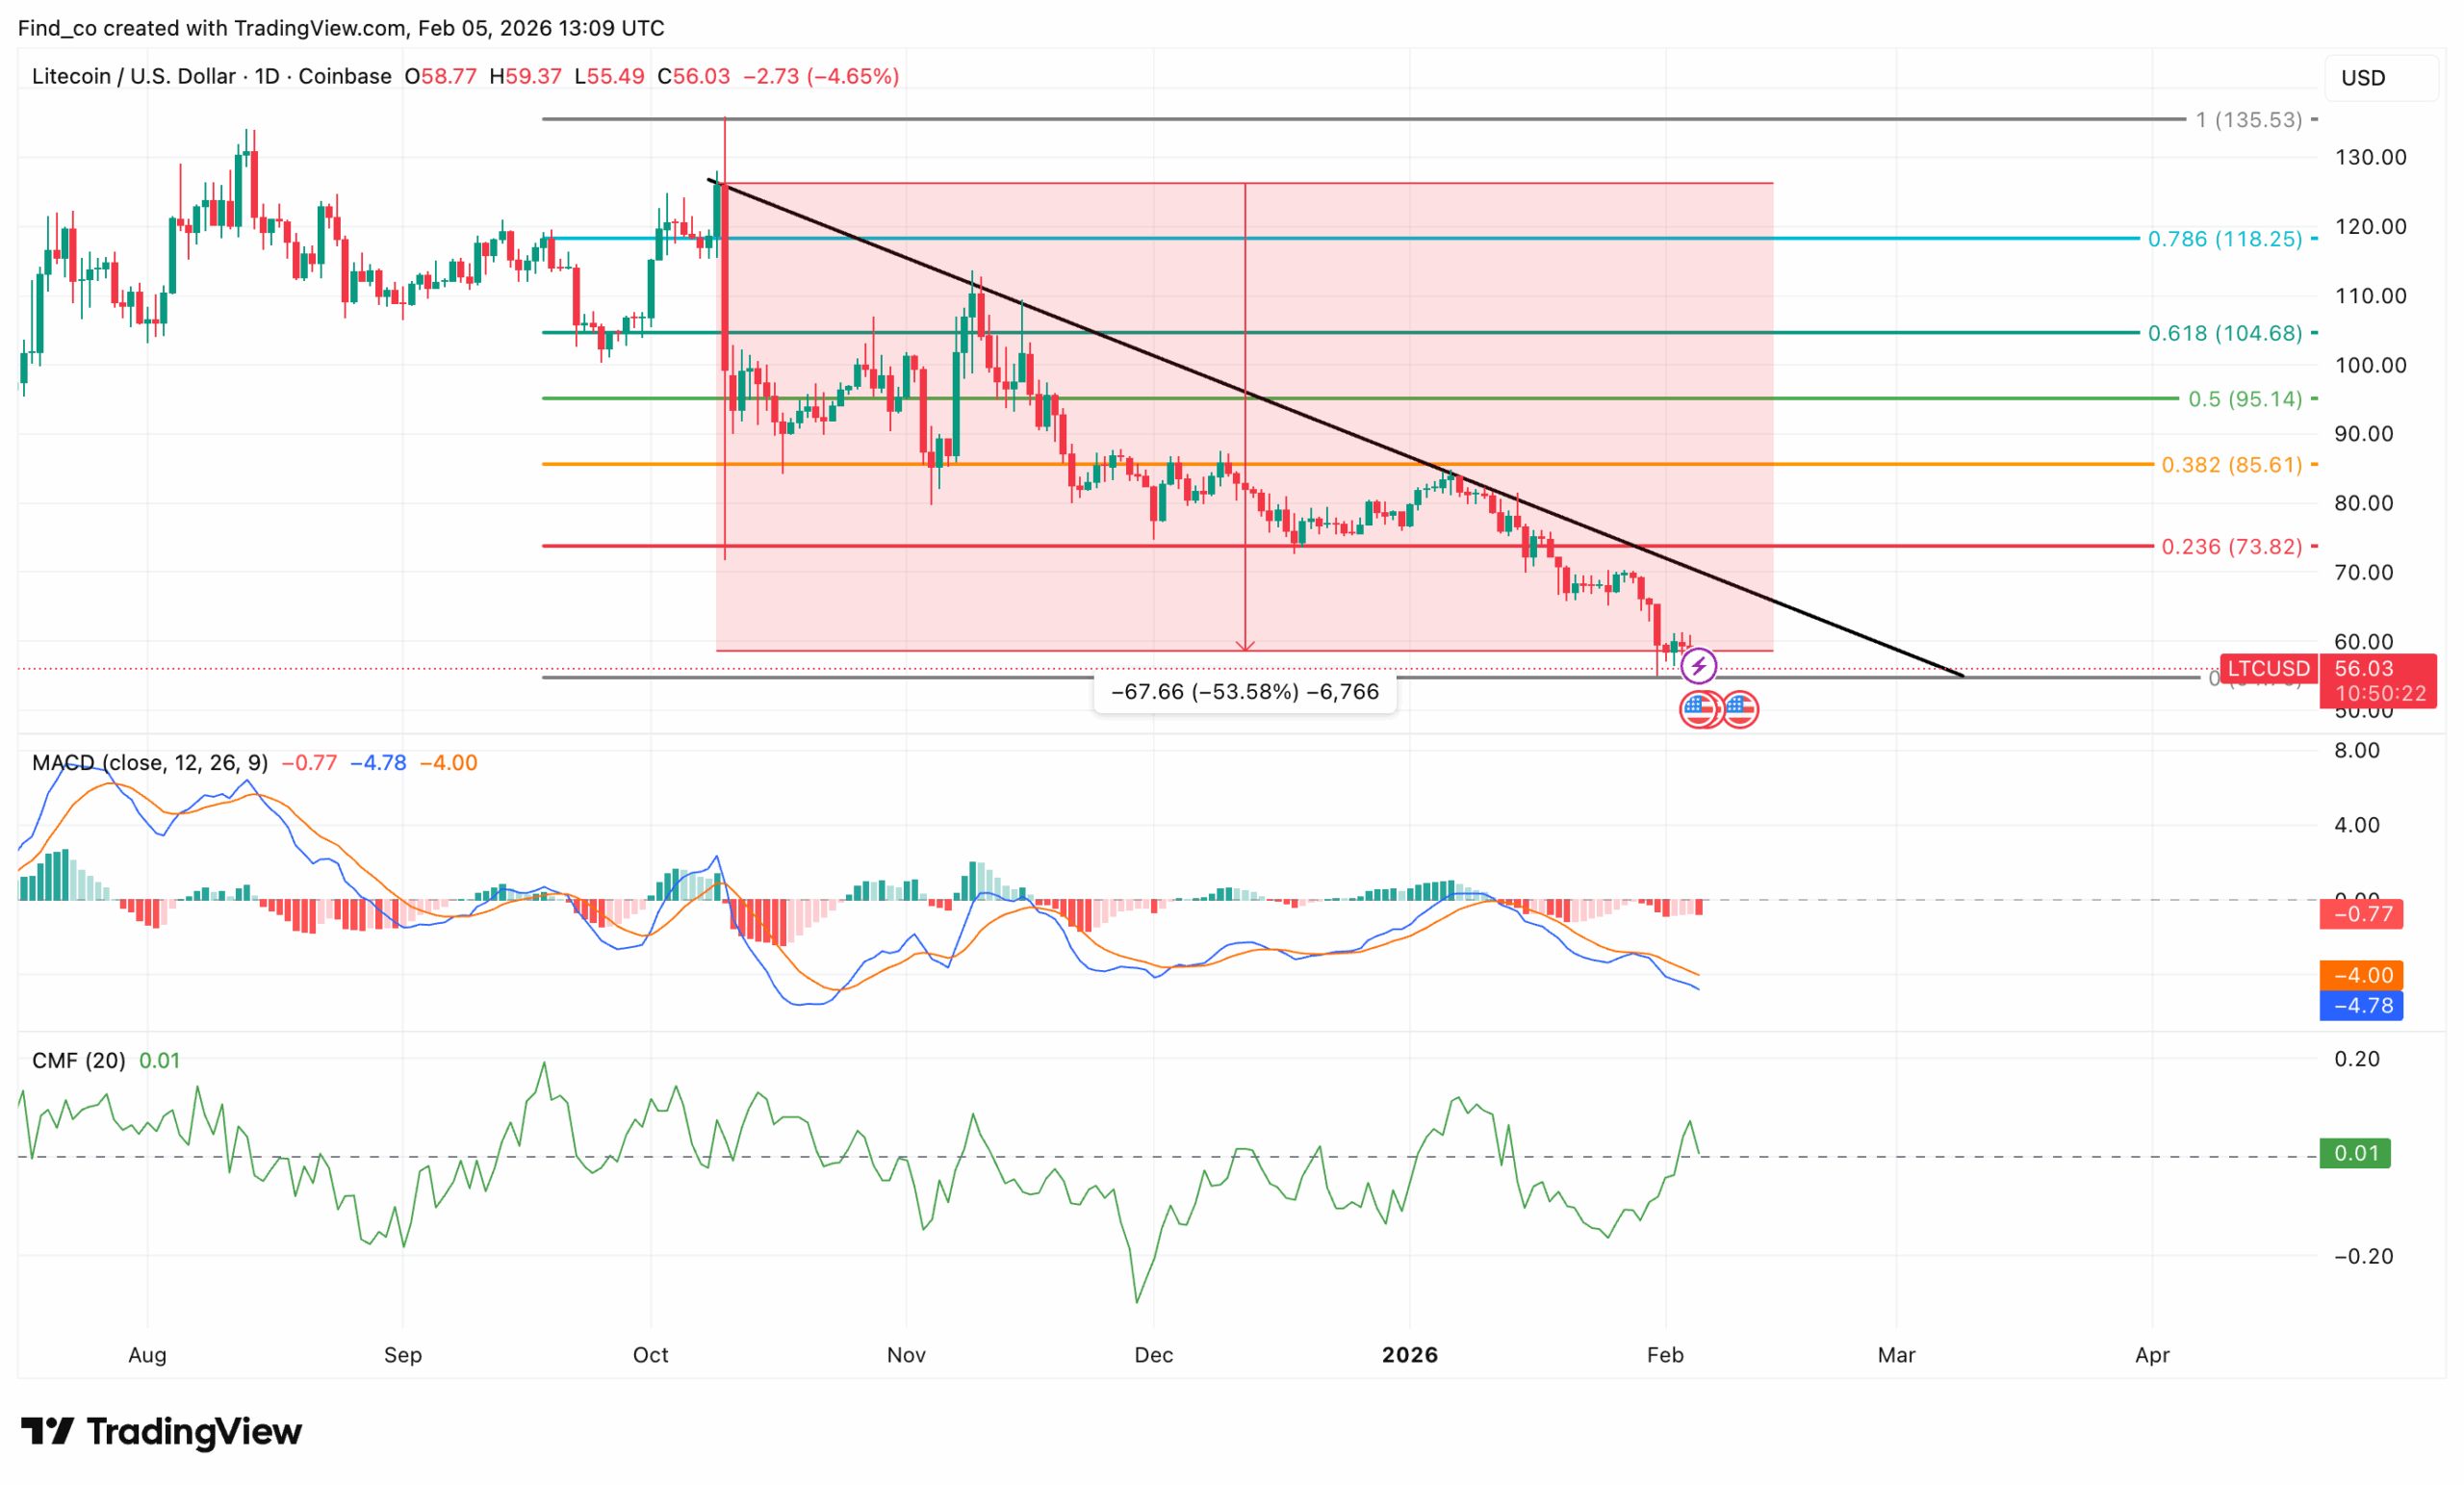
The Moving Average Convergence Divergence (MACD) sits in negative territory, confirming the prevailing bearish sentiment.
However, the red histogram bars are fading, suggesting downward momentum may be weakening.
A potential bullish crossover could shift the trend, attracting buyers and possibly triggering a short-term rebound.
Similarly, the Chaikin Money Flow (CMF) has moved into positive territory, signaling a steady influx of buying pressure.
This indicates that capital is returning to LTC. Also, this could be because some market participants view current levels as attractive points for accumulation.
Fibonacci retracement levels provide further insight into Litecoin’s price action. At the time of writing, LTC sits at $58.20, near its August lows at $54.50, which coincide with the zero Fib level.
Disclaimer:
The information provided in this article is for informational purposes only. It is not intended to be, nor should it be construed as, financial advice. We do not make any warranties regarding the completeness, reliability, or accuracy of this information. All investments involve risk, and past performance does not guarantee future results. We recommend consulting a financial advisor before making any investment decisions.
Victor Olanrewaju is a crypto analyst and reporter at CCN with deep roots in on-chain research and technical analysis. His crypto journey began in 2017, but it was the 2020 Uniswap airdrop that sparked a full-time pivot into the space.
With a foundation in copywriting, Victor honed his craft creating high-converting content for leading crypto brokers — most notably an XRP price prediction that ranked #1 on Google during the 2021 bull run.
He later joined AMBCrypto in 2022, where he combined storytelling with technical and on-chain analysis to cover key market narratives.
In 2024, he expanded his expertise at BeInCrypto, collaborating with analysts and using tools like Glassnode, Santiment, and IntoTheBlock to break down Bitcoin and altcoin trends.
At CCN, Victor covers the top cryptocurrencies, memecoins, macro shifts, blending real-time insights with deep-dive metrics.
He holds a Bachelor’s degree in Physics from the University of Ibadan, equipping him to simplify complex data for a wide audience. Follow his work or connect on LinkedIn or X.