Why Liquidity Is the Real Game in Crypto, Not Bitcoin Price
Share
Key Takeaways
Bitcoin (BTC) has fallen below its short-term holder (STH) realized price.
The STH and LTH NUPL indicator predicts more downside this year.
Has the Bitcoin market cycle come to an end, or is another high likely in 2026?
Bitcoin has slipped below its short-term holder (STH) realized price for the third time this cycle.
This drop highlights potential weakness in the current market cycle, as past breakdowns below this level have sparked volatility and uncertainty.
Historically, this level has served as a key support during bull markets; however, each subsequent drop below it has sparked increased volatility and uncertainty.
With both the STH and LTH NUPL indicators indicating weakening investor sentiment, the charts suggest that another correction may be on the horizon.
During this cycle, it has risen above this level on several occasions.
Examining how Bitcoin responds once its price drops below the STH realized price reveals key turning points in the market cycle.
Get These Top Crypto Casino Offers Now!
Sponsored
Disclosure
We sometimes use affiliate links in our content, when clicking on those we might receive a commission at no extra cost to you. By using this website you agree to our terms and conditions and privacy policy.
When Bitcoin’s price dropped below this level earlier this year, it repeatedly rebounded, quickly reclaiming the STH realized price each time.
Currently, the BTC price trades below the STH realized price, which is at $113,000.
The last two drops below this level were in September 2024 and April 2025. Both times, Bitcoin bounced before reaching the realized price at $88,500.
If this pattern continues, Bitcoin’s price could approach $88,500 before rebounding and moving back above the STH realized price, continuing the observed cycle of declines and recoveries.
If it does, it will mean that the bull trend is still intact and new highs are likely.
However, a close below the realized price at $88,500 will confirm that the bull market has ended. This was the case in the previous cycle and could be the same again.
If that happens, Bitcoin could fall to the LTH realized price at $56,000.
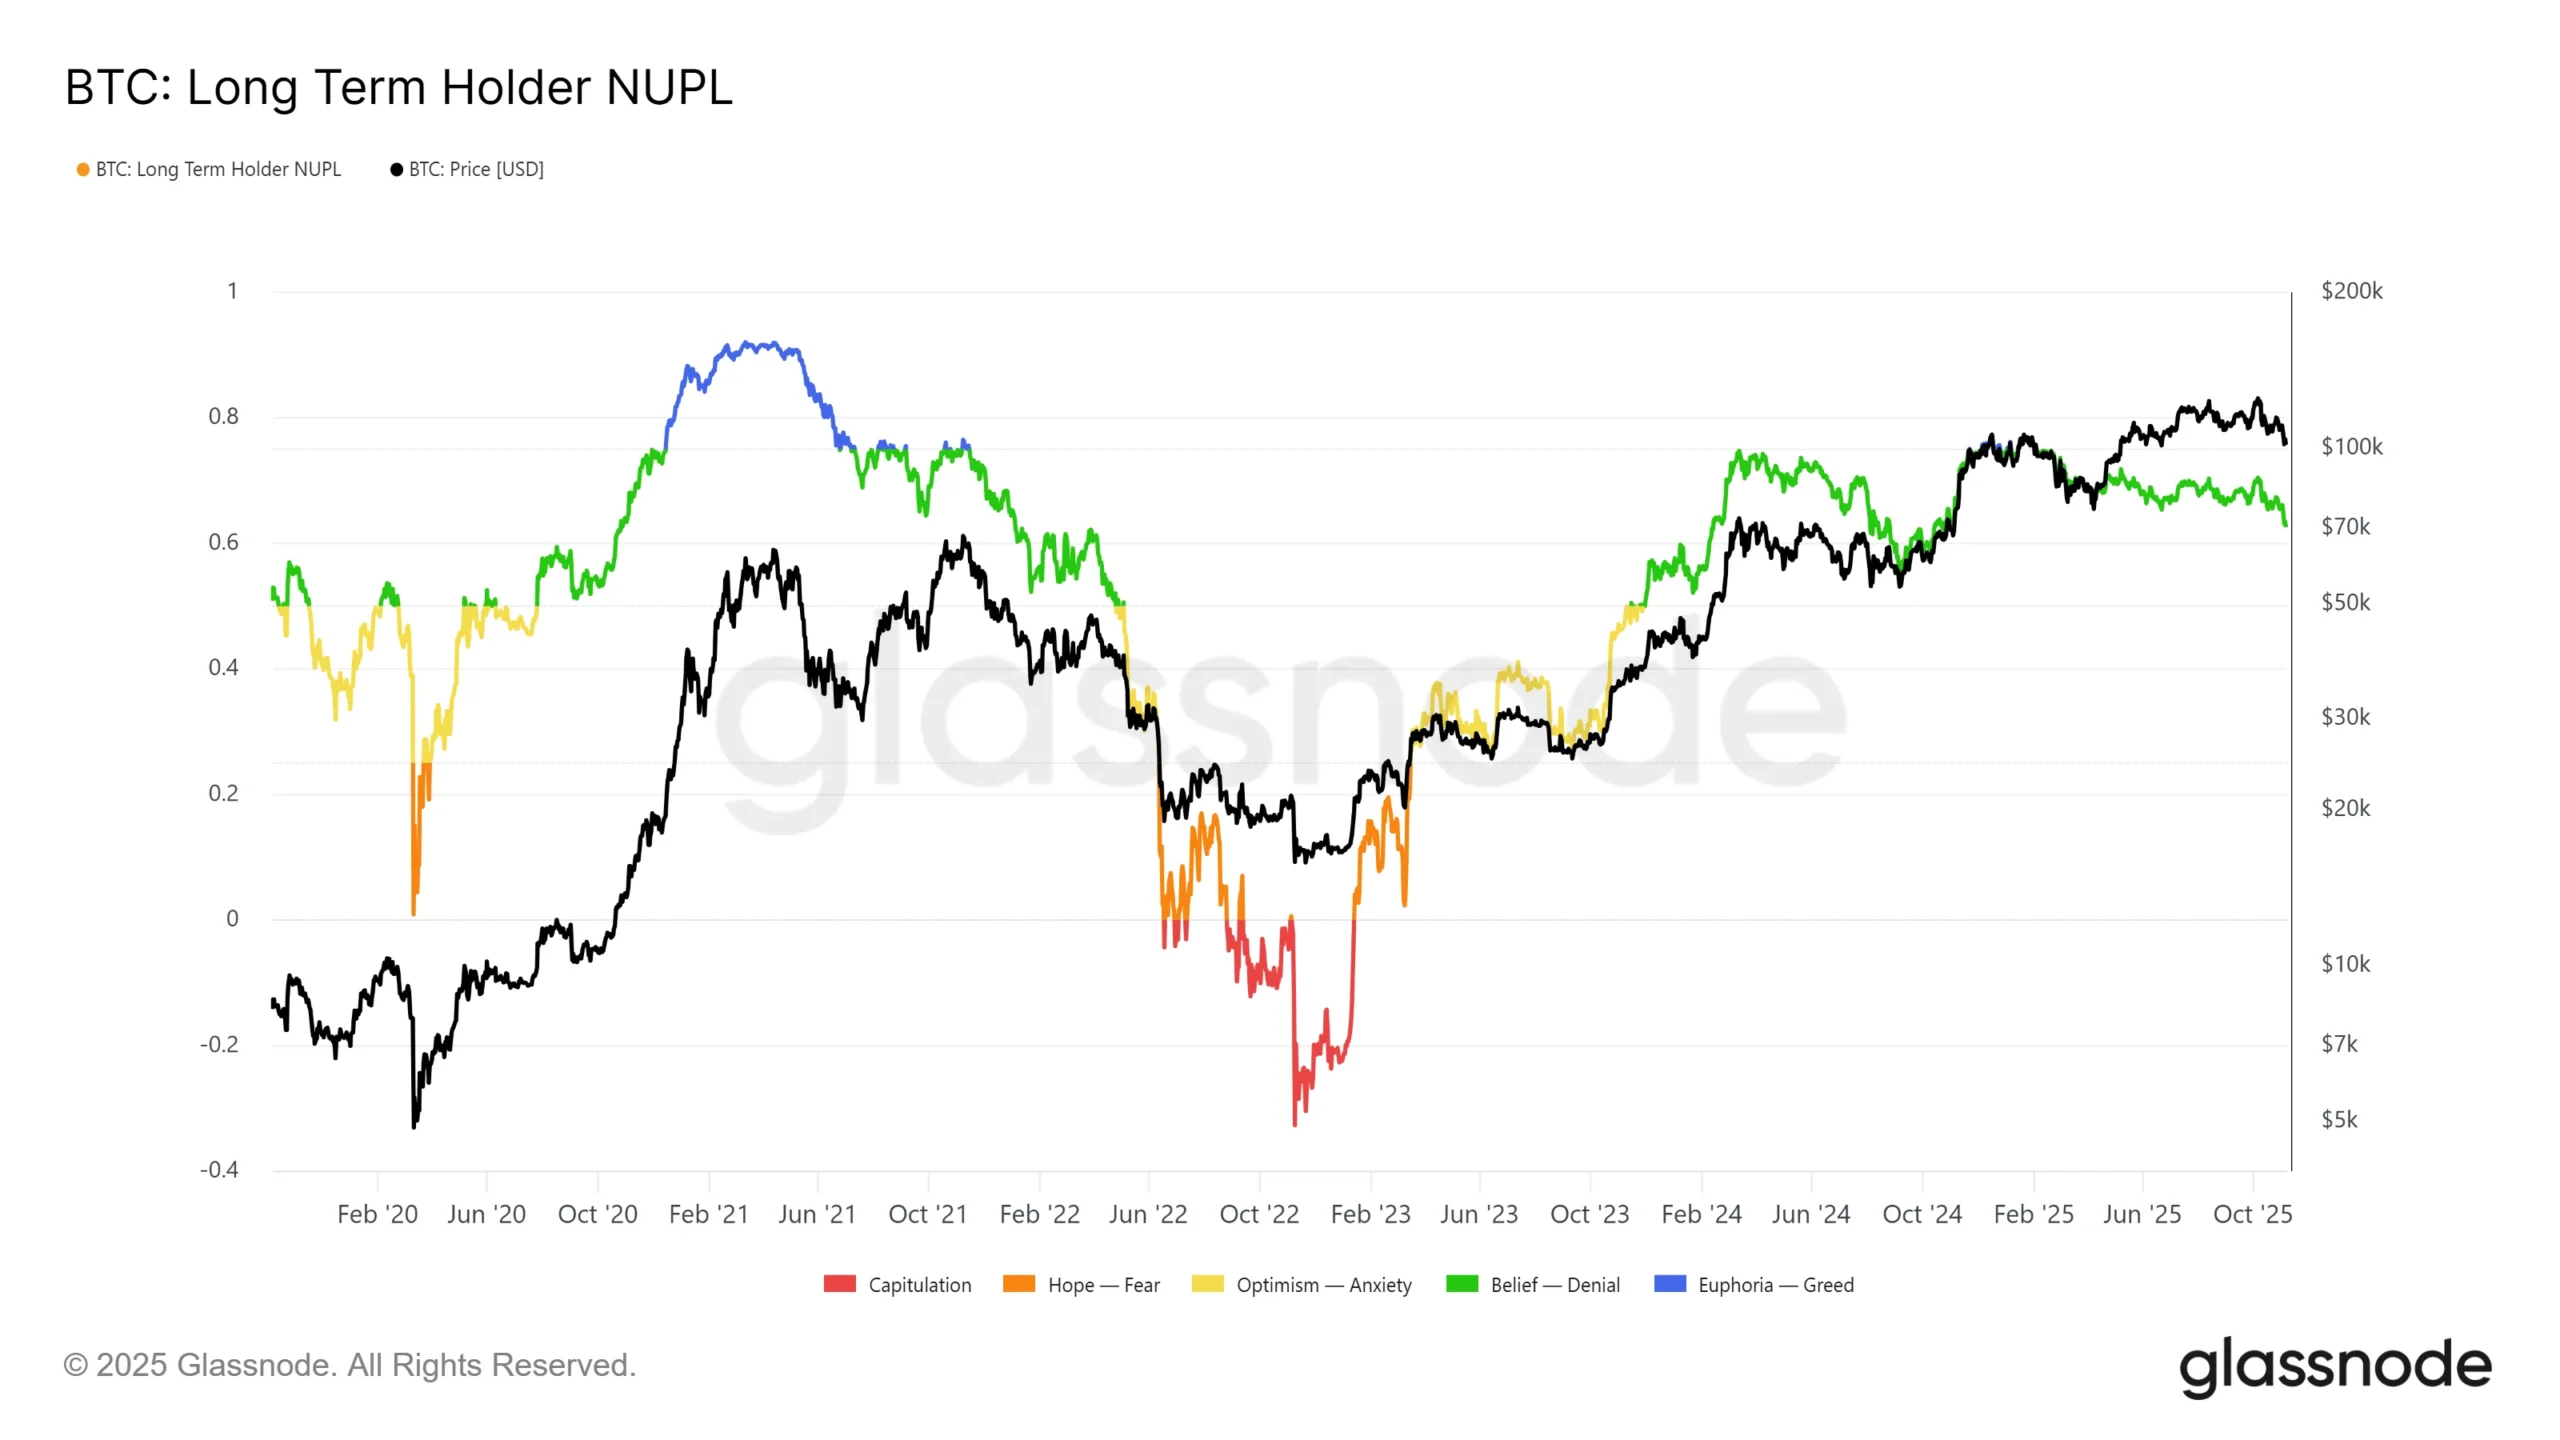
Bitcoin’s NUPL
Staying with the STH and NUPL indicators, the STH Net Unrealized Profit/Loss indicator reveals the behavior of short-term investors, indicating whether they are in profit or not.
As a result, the readings relating to short-term holders suggest another Bitcoin price decline will occur, and if that happens, LTH indicators will confirm the end of the market cycle.
Bitcoin Bears Have Taken Over
The latest on-chain data paints a cautious picture for Bitcoin in the short term.
Disclaimer:
The information provided in this article is for informational purposes only. It is not intended to be, nor should it be construed as, financial advice. We do not make any warranties regarding the completeness, reliability, or accuracy of this information. All investments involve risk, and past performance does not guarantee future results. We recommend consulting a financial advisor before making any investment decisions.
Valdrin Tahiri is a cryptocurrency analyst and reporter at CCN, specializing in technical analysis with a focus on Elliott Wave theory, on-chain metrics, and fundamental research. He brings over seven years of experience in the crypto space as both a trader and writer.
He discovered cryptocurrencies in 2017 while earning his MSc in Financial Markets at the Barcelona School of Economics, which sparked a deep interest in blockchain and market dynamics. Since then, he’s contributed to top crypto outlets like BeInCrypto and CoinGape.
Valdrin also served as Community Manager of BeInCrypto’s Telegram group for three years, helping grow it into one of the largest crypto communities worldwide. His expertise in market structure and price patterns allows him to break down complex trends into clear, actionable insights.
He’s published thousands of articles covering altcoins, Bitcoin cycles, and macro trends.