Home / Analysis / Crypto / Technical Analysis / BitMine in $6.6B Unrealized Loss, Strategy Near $1B: Here’s How Bitcoin and Ethereum Crash Has Hit Crypto Treasury Firms
BitMine’s ETH drawdown and MSTR’s BTC stress show how balance sheets reprice when liquidity disappears | Credit: Hameem Sarwar
Share
Key Takeaways
Corporate crypto-treasury strategies are being stress-tested in major drawdowns, exposing how fragile balance sheets are.
BitMine’s heavy ETH concentration has translated into a multi-billion-dollar unrealized hit as ETH slid toward $2,200.
MicroStrategy’s BTC-only model is simpler but leverage-sensitive since Bitcoin doesn’t generate cash flow to service debt.
Neither company has been forced to sell, but the longer prices stay depressed, the more the market will test their funding runway.
The corporate crypto-treasury trade is running headfirst into its first true crypto winter. As major cryptocurrencies slide to multi-month lows in February 2026, the idea of parking digital assets on balance sheets is no longer just a theoretical debate.
Instead, it’s being stress-tested in real time.
What once looked like disciplined, long-duration conviction is now being repriced as exposure to volatility that corporate structures are not designed to absorb easily.
Here is how all that has played out and what it could imply in the long run.
ETH Crash Wipes Out BitMine Holdings Value
Nowhere is that clearer than at BitMine Immersion Technologies. Under the influence of investor Tom Lee’s strategy, the company took a distinctly non-consensus path by leaning heavily into Ethereum (ETH) rather than Bitcoin.
That bet grew aggressive. BitMine’s holdings now exceed 4.24 million ETH, a position that looked prescient when ETH was trading comfortably higher.
However, that decision has become problematic as the ETH price slid toward the $2,200 area.
At this level, BitMine’s unrealized losses have climbed to roughly $6.6 billion.
If the position were ever forced into realization, it would rank as the fifth-largest documented principal trading loss in history.
The comparison that puts it in perspective is Archegos in 2021.
For context, Archegos remains the largest loss ever recorded, and BitMine’s current unrealized drawdown is already approaching two-thirds of that magnitude.
Amid that, equity markets have already passed judgment. BMNR is down more than 80% from its 52-week high.
BMNR Price Slides As Well
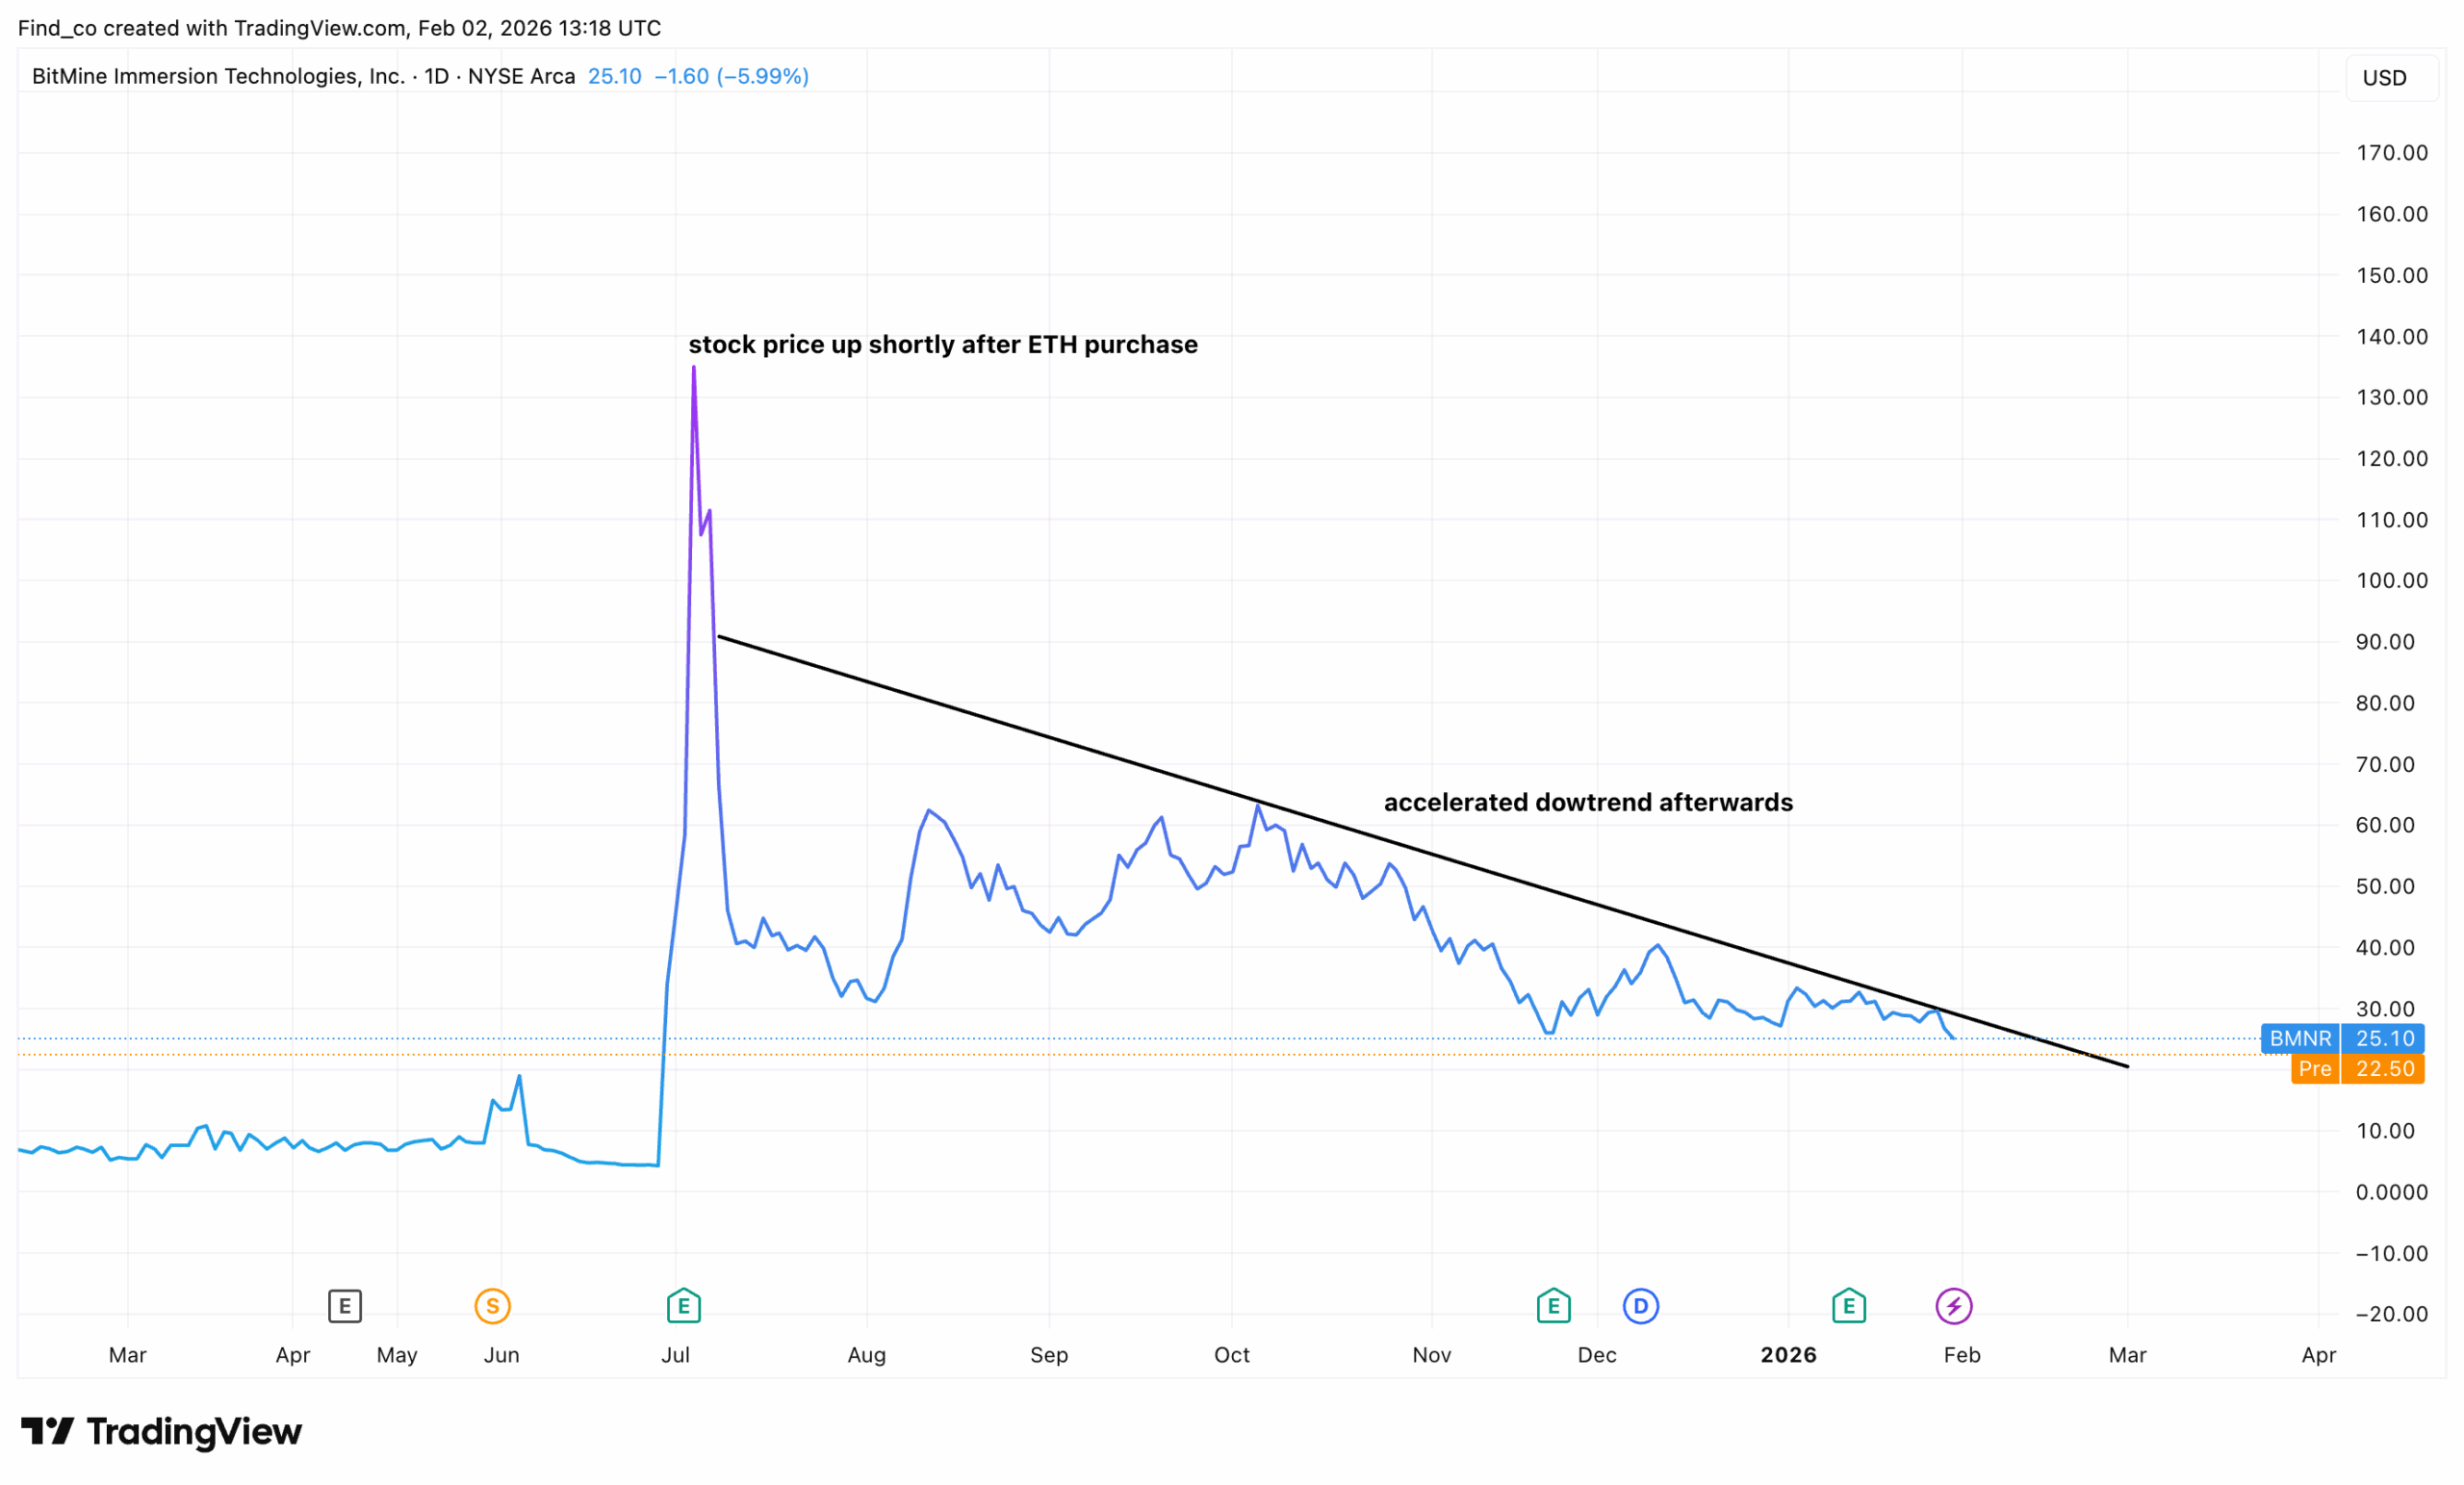
Besides its ETH holding, the BMNR stock of BitMine Immersion Technologies is back under pressure.
The chart shows a sharp, news-driven spike last summer, triggered shortly after the company disclosed an Ethereum purchase. Shares surged violently in a short window.
However, the move failed to hold.
Almost immediately, the rally reversed. Selling accelerated.
What followed was a persistent downtrend, defined by a series of lower highs and lower lows. The descending trendline drawn from the post-spike peak has capped every rebound since.
Importantly, the ETH-related optimism proved short-lived.
While the initial announcement lifted sentiment, price action suggests the market quickly reassessed the fundamentals. Liquidity faded.
Now, BMNR is trading near $25, hovering just above prior support and close to pre-spike valuation levels. The long-term trend remains bearish. No structural reversal is visible.
From a technical perspective, this is classic sell-the-news” behavior.
Parabolic moves tied to crypto exposure often attract speculative capital early. But without sustained earnings growth or balance-sheet follow-through, the price tends to revert to the mean.
Looking ahead, the trendline remains the key level.
As long as the BMNR stock price stays below the descending resistance, rallies are likely to be corrective. A break below current support would open the door to a full retrace toward pre-ETH-announcement lows.
Conversely, only a notable break above the descending trendline. would signal that the market is willing to reprice the stock on more than crypto headlines.
But for now, that seems unlikely.
The Scale of the Loss (Broken Down)
Total Holdings: BitMine currently holds approximately 4.24 million ETH (roughly 3.5% of the total circulating supply).
Cost Basis vs. Market Value: The company’s average purchase price is estimated at $3,849 per ETH.With Ethereum prices recently sliding toward $2,222, the total value of its stack dropped to roughly $9.6 billion, down from a high of $13.9 billion.
Historical Context: If realized, this would rank among the largest proprietary trading losses in financial history, comparable to the $10 billion collapse of Archegos Capital Management in 2021.
Metric
October 2025 (Peak)
February 2026 (Current)
Change
Total ETH Held
4.24 Million
4.24 Million
+40k (Buying the dip)
Portfolio Value
$13.9 Billion
$9.6 Billion
-$6.6Billion
ETH Price
High $4,892
$2,200 – $2,300
30% Decline
Why Does BitMine Have a $6.6B Unrealized Loss?
BitMine’s reported $6.6 billion unrealized loss is the straightforward result of its aggressive Ethereum treasury strategy colliding with a sharp ETH drawdown.
The company accumulated roughly 4.24 million ETH (about 3.5% of the circulating supply), with the position valued at nearly $13.9 billion at the October 2025 peak.
As ETH slid into the $2,200–$2,300 range in early 2026, the mark-to-market value reset sharply, triggering a paper loss.
The damage was amplified by a broader leverage reset: thin liquidity and forced liquidations turned declines into air pockets, pulling ETH’s price lower faster than fundamentals would suggest.
And because BitMine is intentionally concentrated in ETH, there’s no diversification cushion—its balance sheet moves with the token.
That’s why the Archegos comparison keeps showing up. At $6.6B, the loss is already roughly two-thirds the size of Archegos’ 2021 collapse.
However, he key distinction is that BitMine’s loss is still unrealized. It only becomes “history-book” material if it’s forced into a sale.
Ethereum Volatility Since BitMine’s First ETH Purchase
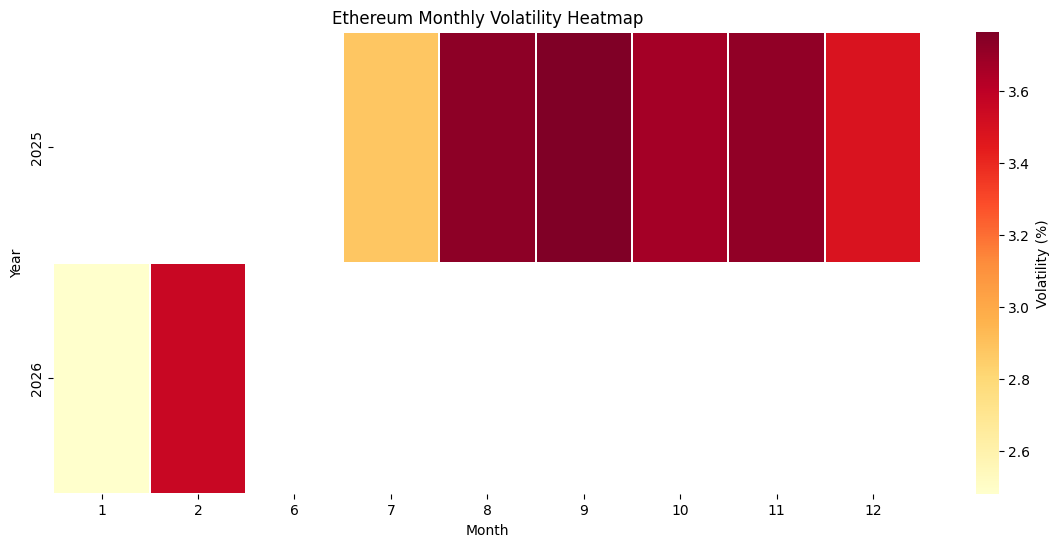
Ethereum’s monthly volatility heatmap illustrates how the intensity of ETH price movements evolved over the observed period, primarily from mid-2025 through early-2026.
Notably, this was when BitMine began accumulating ETH.
Volatility here represents the magnitude of short-term price fluctuations, with higher values indicating sharper and more frequent swings.
ETH Monthly Volatility | Credit: Python analysis based on CoinGecko (via Dr. Guneet Kaur)
The Breakdown
2025: Ethereum experienced consistently elevated volatility throughout the second half of the year. Monthly volatility generally ranged from approximately 2.8% to 3.8%, with the highest levels occurring between August and November.
This pattern suggests an active, highly responsive market, with frequent, pronounced price movements. The sustained dark shading across multiple consecutive months indicates that heightened volatility was not confined to isolated events but persisted over an extended period.
The latter part of 2025 shows volatility easing slightly toward December, falling closer to the mid-3% range. This reduction implies a gradual cooling of market conditions after a period of intense activity, although volatility remained meaningfully higher than what is typically observed during consolidation phases.
Early 2026: The limited data available points to a mixed but generally moderating environment. January displays comparatively lower volatility, around the mid-2% range, suggesting calmer price behavior at the start of the year. February, however, shows a noticeable increase back above 3.5%, indicating a brief resurgence in price fluctuations.
Given the partial nature of the data, these early-year movements should be interpreted cautiously. Overall, the heatmap suggests that Ethereum during this period was characterized by sustained volatility rather than sharp, isolated spikes.
Compared to long-term consolidation phases, the market appears more dynamic, reflecting strong participation and sensitivity to market developments.
The gradual moderation toward late 2025 and the mixed signals in early 2026 suggest a market that is active but beginning to stabilize, rather than one experiencing extreme speculative stress.
Like Tom Lee’s BitMine, Like Saylor’s Strategy
However, BitMine is not the only firm facing such a rough path. As of today, Strategy (formerly MicroStrategy), led by Chairman Michael Saylor, sits at the other end of the same spectrum.
With an estimated average Bitcoin cost basis in the $75,000–$76,000 range, the brief dip below $74,500 earlier this month pushed the company’s entire Bitcoin stack into unrealized loss territory.
The irony is that this comes after a period of extraordinary paper gains during the 2024 to 2025 rally, gains that have now been fully erased by the recent drawdown.
Strategy has been here before, disclosing nearly $17 billion in unrealized losses during prior volatility. But this moment feels different because the margin for error has narrowed.
To its credit, the company has been preparing. A recent $2.25 billion cash raise has given MicroStrategy breathing room and reinforced its argument that it is not a forced seller.
Still, the concern among analysts isn’t immediate liquidation risk. Its duration.
If Bitcoin price remains pinned below $75,000 for a prolonged stretch, the balance between conviction and capital preservation becomes harder to maintain.
MSTR Price Not Left Out of the Bloodbath
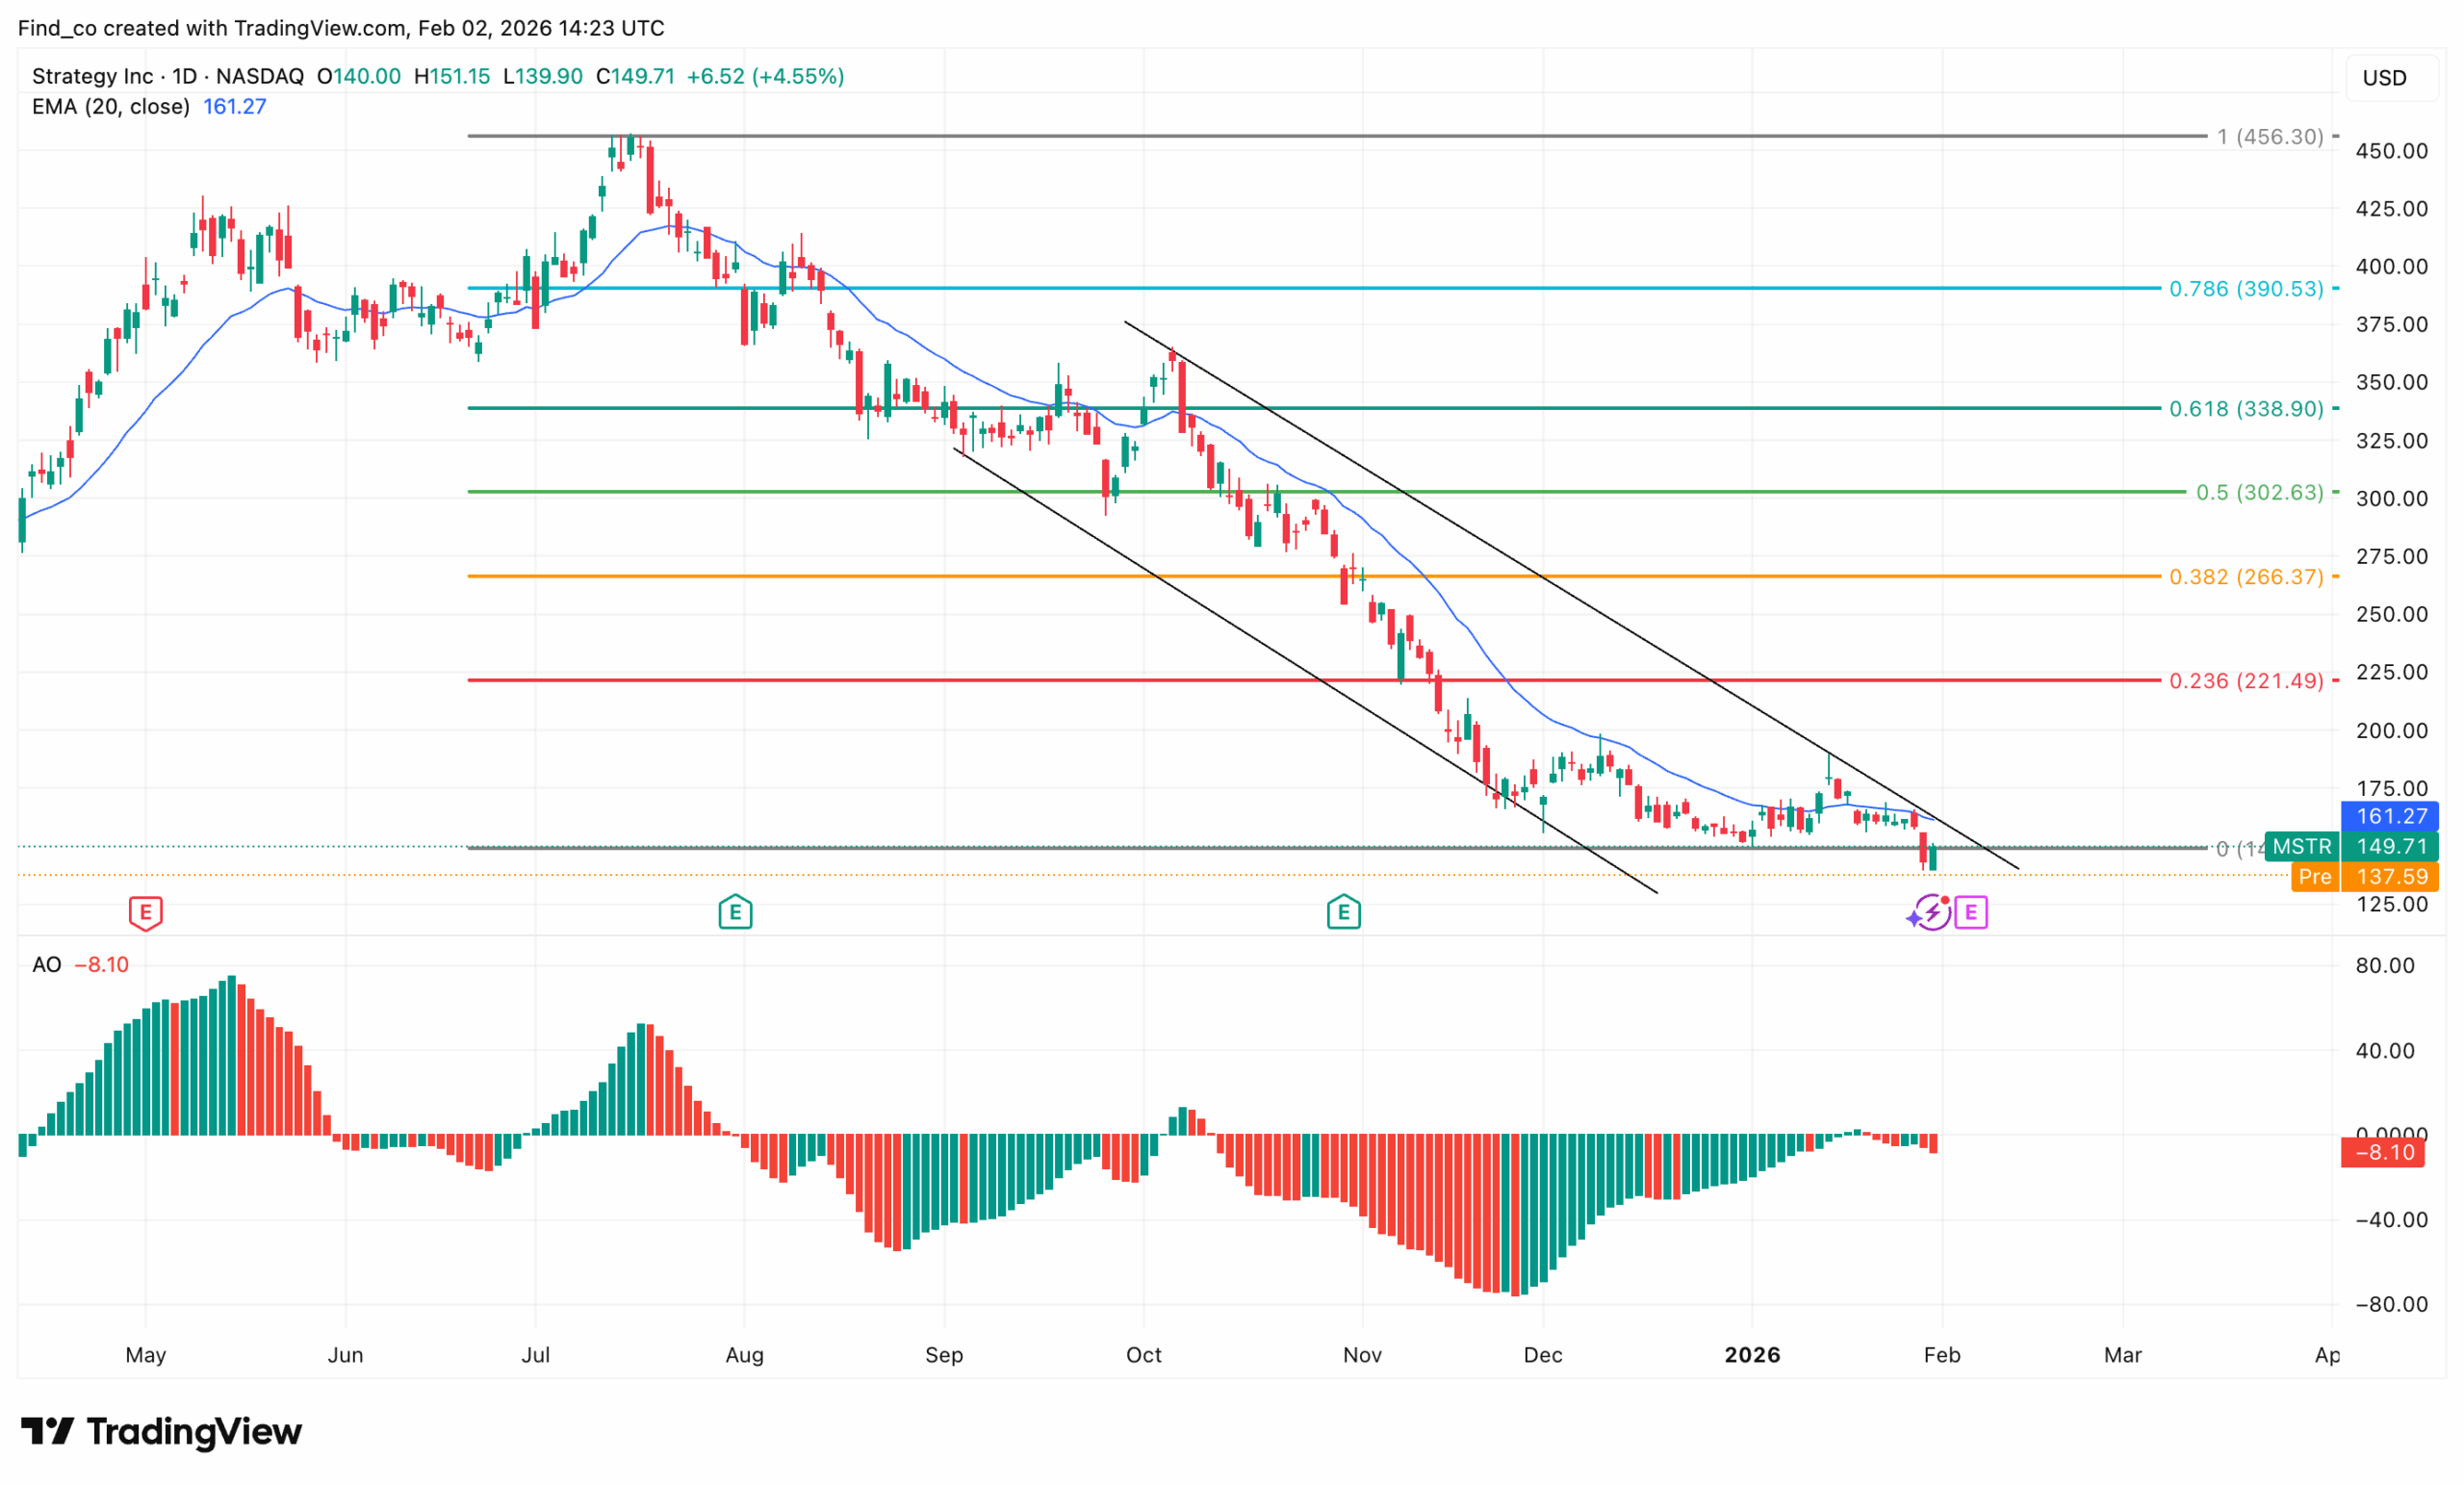
From a technical perspective, MSTR attempted a short-term rebound on the daily chart. However, the broader technical picture remains fragile.
On the daily chart, MSTR is trading around $150, recovering modestly after a sell-off. The bounce follows a prolonged decline that began after the stock peaked near $455 earlier in the cycle.
Importantly, the stock is trading well below the 20-day EMA, which now sits near $161. This moving average has acted as key resistance throughout the decline, repeatedly rejecting upside attempts.
The 0.236 level near $221, the 0.382 level around $266, and the 0.5 retracement near $303 are all well above the current price. As a result, any rally faces stacked resistance.
In the near term, holding above the $145 support zone is critical. A break below this area would expose downside toward the $125 region
On the other hand, bulls need a decisive reclaim of the 20-day EMA and a breakout from the descending channel to shift the narrative
Bitcoin Volatility Since Microstrategy’s First Purchase
Looking at historical data, Bitcoin’s volatility changed after MicroStrategy’s first BTC purchase in August 2020.
On Aug. 11, 2020, the firm announced a $250 million allocation, with Bitcoin’s price trading near $11,500.
That moment marked the start of sustained institutional participation and a sharp shift in price action.
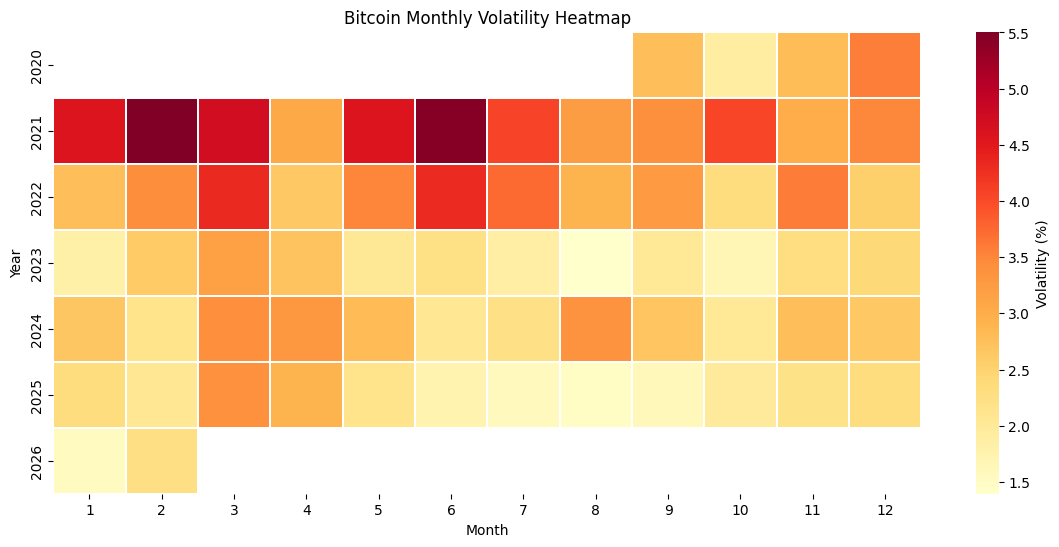
BTC Monthly Volatility | Credit: Python analysis based on CoinGecko (via Dr. Guneet Kaur)
2020: Bitcoin exhibited moderate volatility, generally ranging between 2.5% and 3.5% during the available months. Price movements were active but not extreme, suggesting a market gradually gaining momentum. This period can be interpreted as a build-up phase, where volatility increased slightly as investor interest grew ahead of the subsequent bull market.
2021: This stands out as the most volatile period in the dataset. Monthly volatility frequently exceeded 4%, with peaks reaching approximately 5.5% in February and June. These elevated levels reflect an environment of intense speculation, rapid price appreciation, and sharp corrections. The consistently high volatility throughout the year aligns with Bitcoin reaching new all-time highs, followed by significant pullbacks.
2022: Volatility remained high at the beginning of the year but showed a clear downward trend as the year progressed. In the early months, volatility remained above 4%, driven by major market disruptions and sharp price declines. By the latter part of the year, volatility had fallen closer to the 2.3%–2.5% range, indicating that the market was beginning to stabilize after a prolonged period of stress.
After the 2022 Bear Market
2023: This year marked a phase of pronounced stabilization. Monthly volatility during this period was the lowest across the entire timeline, typically ranging from 1.4% to 2.8%. The absence of extreme spikes suggests reduced speculative activity and a consolidation phase, during which prices moved more steadily, and market participants adopted a more cautious stance.
2024: Volatility increased modestly compared to 2023 but remained well below the levels observed during the 2021 bull market. Most months recorded volatility between 2.2% and 3.2%, indicating renewed market activity and growing participation, while still maintaining a relatively controlled risk environment.
2025: Bitcoin’s volatility remained stable and moderate, largely confined to the 2.0% to 3.1% range. The lack of extreme fluctuations suggests a more mature market structure, supported by deeper liquidity and broader participation, which helped dampen sharp price movements.
2026: Although limited, early data indicate relatively calm market conditions, with volatility around 1.5% in January and approximately 2.1% in February. While this partial data should be interpreted cautiously, it suggests continued stability at the start of the year.
BMNR vs MSTR: Which Treasury Model Is Riskier? ETH Staking vs BTC Leverage?
Looking at BitMine and MicroStrategy side by side in early 2026 makes it clear that today’s corporate crypto-treasury trade isn’t a single strategy with different tickers.
It’s two fundamentally different philosophies wearing the same label. Unfortunately, they seem to have failed in very different ways.
The company is trying to behave less like a passive holder and more like an on-chain operator, accumulating a massive ETH position, now roughly 3.5% of total supply, and putting it to work through staking.
In theory, this creates native protocol revenue and turns Ethereum exposure into something closer to a productive asset.
However, in practice, it introduces a very specific class of risk.
Staked ETH is not perfectly liquid, especially during stress, and exit queues can turn a paper decision into a timing problem.
On top of that, BitMine is concentrating operational risk by building its own U.S.-based validator infrastructure. Any technical failure, slashing event, or regulatory action aimed at staking-as-a-service doesn’t just dent margins.
The final layer is equity risk. To pursue its stated goal of eventually owning 5% of all ETH, BitMine has authorized a massive increase in share count, signaling that dilution is not a side effect but a feature of the strategy.
Even if the ETH stack grows, existing shareholders are exposed to owning a smaller and smaller slice of it.
MSTR
MicroStrategy sits at the opposite end of the spectrum. Its approach is simpler, purer, and in some ways more fragile.
The company operates like a Bitcoin-backed financial vehicle, issuing debt and equity to accumulate a non-yielding asset with the explicit aim of increasing Bitcoin per share over time.
The risk here is not operational complexity, but leverage.
With more than $8 billion in debt on the balance sheet and an average BTC cost basis hovering in the mid-$70,000s, the model becomes increasingly binary as price falls.
Bitcoin itself doesn’t generate cash flow. So, servicing interest and dividends depends on a relatively small software business or continued access to capital markets.
Compounding that issue is the decay of the “Saylor premium.” With spot Bitcoin ETFs now offering liquid exposure, MicroStrategy has lost its unique position as the only equity proxy for BTC, causing its stock to trade closer to, or even below, its Net Asset Value (NAV) at times.
The trade-off between the two is subtle but important. BitMine is arguably the riskier proposition for shareholders, because dilution and execution risk can erode equity value even if Ethereum’s price recovers.
MicroStrategy, on the other hand, is riskier on the balance sheet. Its dependence on debt turns Bitcoin exposure into a leveraged bet on duration.
Therefore, if BTC enters a multi-year crypto winter, the pressure doesn’t just show up in the stock price. It might also threaten the entire capital structure.
Feature
BitMine (BMNR)
MicroStrategy (MSTR)
Risk Winner
Primary Asset
Ethereum (ETH)
Bitcoin (BTC)
MSTR (BTC is generally less volatile)
Revenue Source
$374M/year staking yield
Software sales (minimal)
BMNR (Higher organic cash flow)
Capital Source
Aggressive Equity (Dilution)
Debt/Convertibles (Leverage)
MSTR (Debt can lead to bankruptcy)
Exit Strategy
Staking rewards / Selling ETH
“HODL” forever / Refinancing
BMNR (Yield provides a floor)
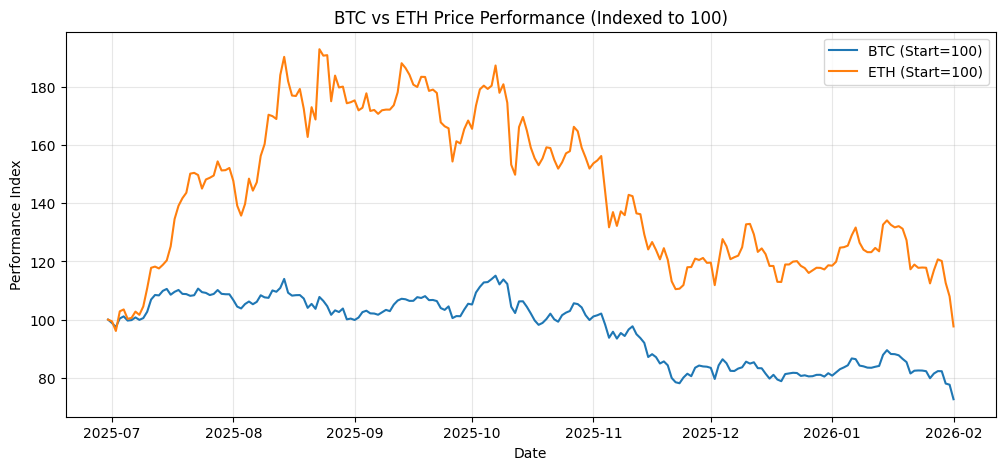
BTC vs ETH Performance
From BitMine’s first accumulation date, ETH massively outperformed, peaking at roughly 85% to 90%. BTC, on the other hand, only managed 10% to 15%.
That explains why BitMine’s ETH treasury model looked brilliant in mid- to late 2025.
Then the cycle turned. ETH round-tripped, giving back nearly all of that outperformance and sliding back toward flat vs the start by early Feb 2026.
BTC also fell, but more gradually, ending around 20% to25% down on the same index.
ETH vs BTC Performance | Python analysis based on CoinGecko (via Dr. Guneet Kaur)
What it means: BitMine’s balance sheet is more fragile because it’s concentrated in the asset that both rallies and unwinds faster.
The drawdown is harsher and more reflexive. Strategy’s BTC exposure is less explosive but more durable, so its losses tend to be more linear and tied to the macro tape rather than a high-beta unwind.
Final Thoughts
What’s notable is what hasn’t happened yet. Neither BitMine nor Strategy has been forced to sell.
Both structures avoid direct leverage on their crypto holdings, giving them time.
But time isn’t free. It has to be funded by stable cash flows and market tolerance, and both of those are being tested as the drawdown drags on.
For now, it does not seem like ETH and BTC will take BitMine and Strategy out of the woods. It also remains unclear if these treasury firms will sell some of their assets.
Disclaimer:
The information provided in this article is for informational purposes only. It is not intended to be, nor should it be construed as, financial advice. We do not make any warranties regarding the completeness, reliability, or accuracy of this information. All investments involve risk, and past performance does not guarantee future results. We recommend consulting a financial advisor before making any investment decisions.
Victor Olanrewaju is a crypto analyst and reporter at CCN with deep roots in on-chain research and technical analysis. His crypto journey began in 2017, but it was the 2020 Uniswap airdrop that sparked a full-time pivot into the space.
With a foundation in copywriting, Victor honed his craft creating high-converting content for leading crypto brokers — most notably an XRP price prediction that ranked #1 on Google during the 2021 bull run.
He later joined AMBCrypto in 2022, where he combined storytelling with technical and on-chain analysis to cover key market narratives.
In 2024, he expanded his expertise at BeInCrypto, collaborating with analysts and using tools like Glassnode, Santiment, and IntoTheBlock to break down Bitcoin and altcoin trends.
At CCN, Victor covers the top cryptocurrencies, memecoins, macro shifts, blending real-time insights with deep-dive metrics.
He holds a Bachelor’s degree in Physics from the University of Ibadan, equipping him to simplify complex data for a wide audience. Follow his work or connect on LinkedIn or X.