Crypto’s worst liquidation event of 2026 followed a metals flash crash as BTC broke key levels| Credit: Veronica Cestari
Share
Key Takeaways
A liquidation shock wiped out $1.68 billion in crypto as gold and silver crashed simultaneously.
Bitcoin broke key support levels near $86,400 and now risks a deeper slide toward $80,000 or lower.
ETF outflows, a Fed rate pause, and geopolitical risks have drained liquidity amid the development.
The last week of January 2026 is shaping up to be one to forget, not because of a single headline, but because multiple narratives unraveled at once.
In the aftermath of what traders are already calling a “Black Thursday,” a violent deleveraging wave ripped through crypto and precious metals simultaneously, producing a rare collapse that left more than $1.68 billion in crypto liquidations and erased trillions in paper value elsewhere.
The initial shock came from the metals market. Gold, which had been behaving like a one-way trade for weeks, suffered its most extreme intraday swing in more than a decade.
Specifically, the gold price collapsed from near $5,600 to around $5,100 in a matter of minutes. In the move, gold shed roughly $3 trillion in market capitalization before the recent bounce.
Silver followed with a near 12% drawdown. As expected, Bitcoin (BTC) was not left out, leading the crypto market crash with a decline below $83,000.
The flagship cryptocurrency now appears at risk of falling below the crucial $80,000 support level. Here is why and what could be next.
How the Crypto Market Crashed
That spillover was immediate.
As cross-asset correlations snapped higher, automated liquidations swept through the crypto market, wiping out $1.68 billion in positions over 24 hours, the largest liquidation event of 2026 so far.
Bitcoin bore the brunt of it, plunging to a fresh yearly low near $83,383 and effectively unwinding almost the entire advance from earlier in the month.
What made the move particularly destabilizing was its character: stops, margin calls, and forced selling rather than discretionary exits.
By early Friday trade, markets attempted a tentative bounce. However, it only feels like stabilization, not relief.
At the time of writing, Bitcoin’s price is hovering around $82,300. Besides that, the focus has narrowed to one level that now matters more than any headline: $80,000.
That zone lines up with the October 2025 correction lows and serves as both a psychological anchor and a technical reference point.
If buyers can’t defend it, the chart opens up quickly, with the risk of a deeper flush toward the $74,000 becoming increasingly feasible.
Why Else Is the Crypto Market Down
Sentiment isn’t helping.
Institutional positioning has turned noticeably more defensive, with spot Bitcoin ETFs shedding roughly $1.13 billion over the past five days
That flow suggests fatigue rather than panic. But in a market still digesting forced liquidations, the absence of a steady buying volume matters.
At the same time, the Fed’s decision to pause rate cuts has stripped away the liquidity narrative that many bulls were leaning on to justify a fast track toward $100,000.
Without that, Bitcoin’s price is being forced to stand on structure alone.
“Insanity today, big liquidity crush on the markets. The best part? Everything V-shaping back upwards. It’s going to be a remarkably volatile period for all assets,” Crypto analyst Michaël van de Poppe said about the recent drawdown.
Another driver was the surge in geopolitical and policy uncertainty that pulled the risk bid out from under the market.
Escalating U.S.–Iran tensions collided with renewed speculation that former Fed Governor Kevin Warsh, widely viewed as hawkish, could be nominated as the next Fed Chair.
BTC Price Likely To Keep Falling
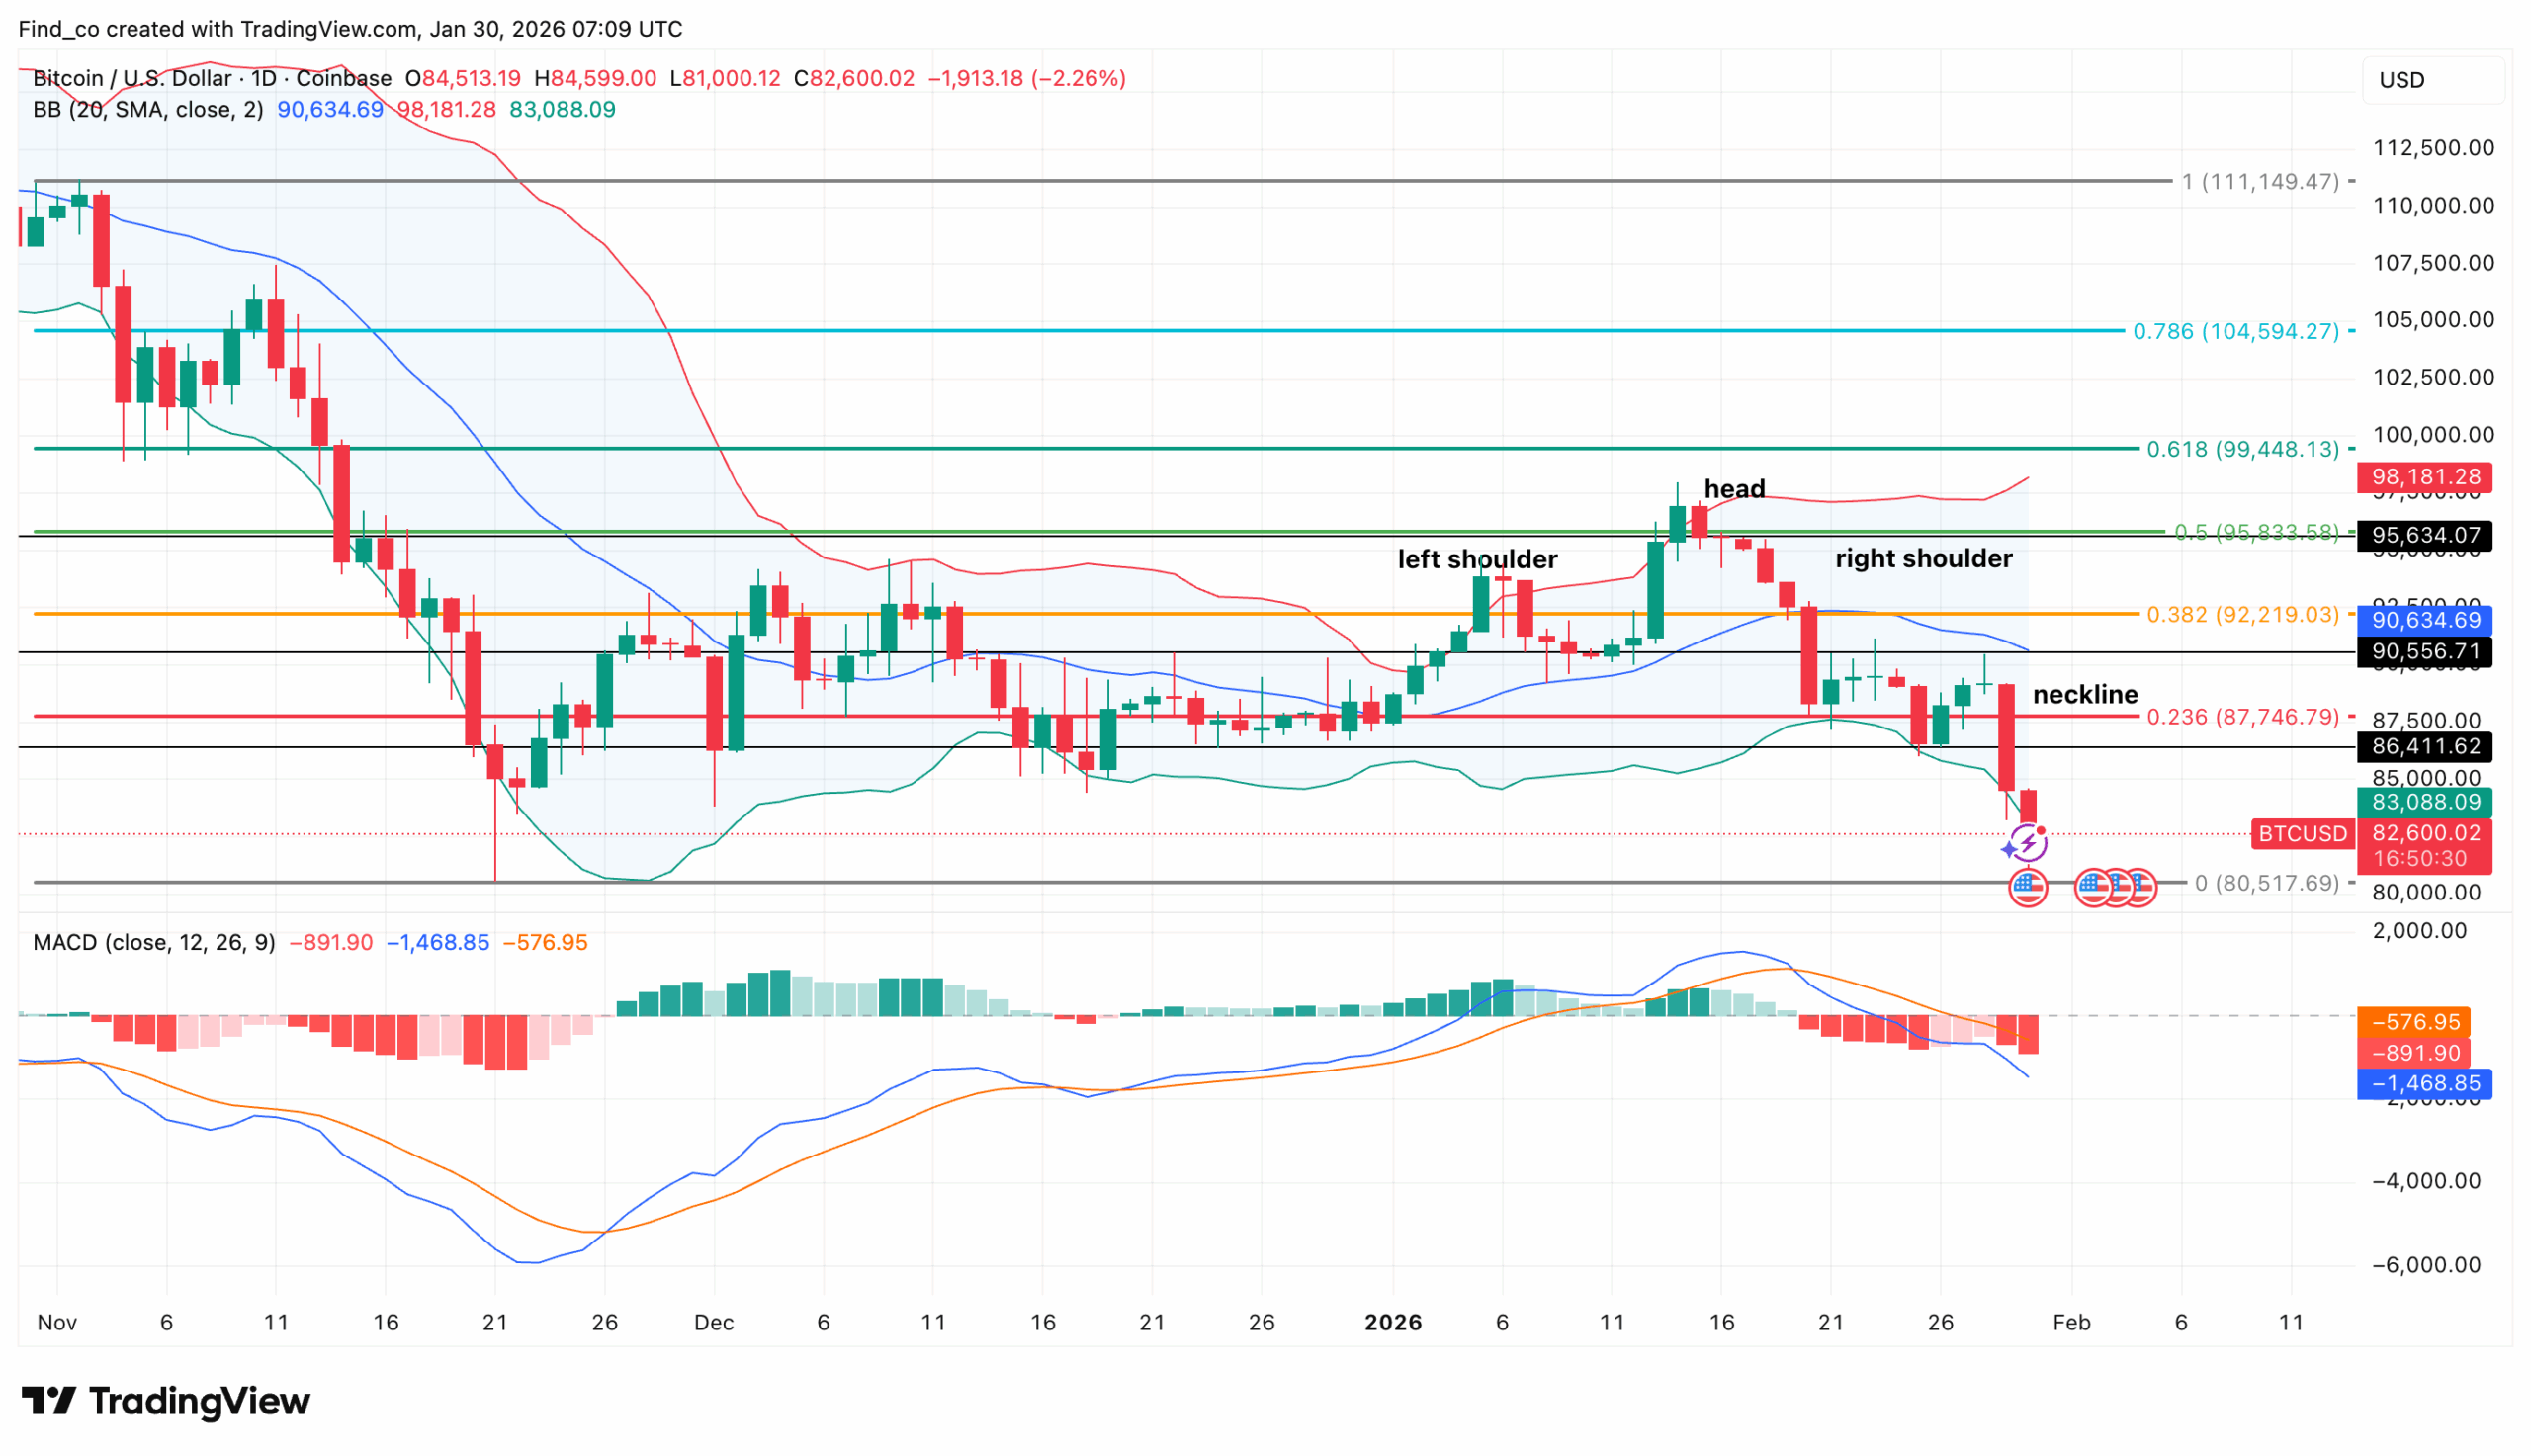
From a technical perspective, Bitcoin’s price extended its sell-off, breaking below the $86,400 neckline and confirming a head-and-shoulders breakdown on the daily chart.
Importantly, price also slipped below the 0.236 Fibonacci level, signaling that buyers failed to defend a key retracement zone.
Momentum indicators back the downside move.
For example, the Moving Average Convergence Divergence (MACD) has crossed into negative territory. Notably, the expanding red histogram bars indicate strengthening bearish pressure.
At the same time, Bitcoin trades below the mid-Bollinger Band, while the lower band near $83,000 is now acting as short-term support.
Historically, confirmed head-and-shoulders patterns tend to trigger follow-through moves.
If selling pressure persists, Bitcoin could drift toward $80,517 if the crypto market crash fails to turn around.
Should that be the case, BTC price risks hitting $78,000, where prior demand and structural support sit.
However, a quick reclaim of the neckline would weaken the bearish setup and force shorts to reassess. In that scenario, BTC might bounce to $92,219
What To Look Out for
For now, the market sits in an uneasy holding pattern.
The worst of the forced selling may be behind it. However, the liquidation left visible gaps in positioning and open interest that remain unresolved.
With key U.S. labor data still ahead, and the Fed signaling patience rather than accommodation, the coming days look less like a clean rebound setup and more like a test of conviction.
The weekend may bring calm, but the damage has already reframed the conversation.
Disclaimer:
The information provided in this article is for informational purposes only. It is not intended to be, nor should it be construed as, financial advice. We do not make any warranties regarding the completeness, reliability, or accuracy of this information. All investments involve risk, and past performance does not guarantee future results. We recommend consulting a financial advisor before making any investment decisions.
Victor Olanrewaju is a crypto analyst and reporter at CCN with deep roots in on-chain research and technical analysis. His crypto journey began in 2017, but it was the 2020 Uniswap airdrop that sparked a full-time pivot into the space.
With a foundation in copywriting, Victor honed his craft creating high-converting content for leading crypto brokers — most notably an XRP price prediction that ranked #1 on Google during the 2021 bull run.
He later joined AMBCrypto in 2022, where he combined storytelling with technical and on-chain analysis to cover key market narratives.
In 2024, he expanded his expertise at BeInCrypto, collaborating with analysts and using tools like Glassnode, Santiment, and IntoTheBlock to break down Bitcoin and altcoin trends.
At CCN, Victor covers the top cryptocurrencies, memecoins, macro shifts, blending real-time insights with deep-dive metrics.
He holds a Bachelor’s degree in Physics from the University of Ibadan, equipping him to simplify complex data for a wide audience. Follow his work or connect on LinkedIn or X.