Bitcoin has turned deflationary with a −0.21% effective inflation rate as dormant supply grows, while the US, Russia, and China now control 65% of global Bitcoin hashrate. | Credit: CCN.com
Share
Key Takeaways
Bitcoin’s drop below $75,000 signals a shift to the bear market, not just a routine correction.
Macro shocks, including a hawkish Fed outlook and geopolitical risk, contributed to the decline.
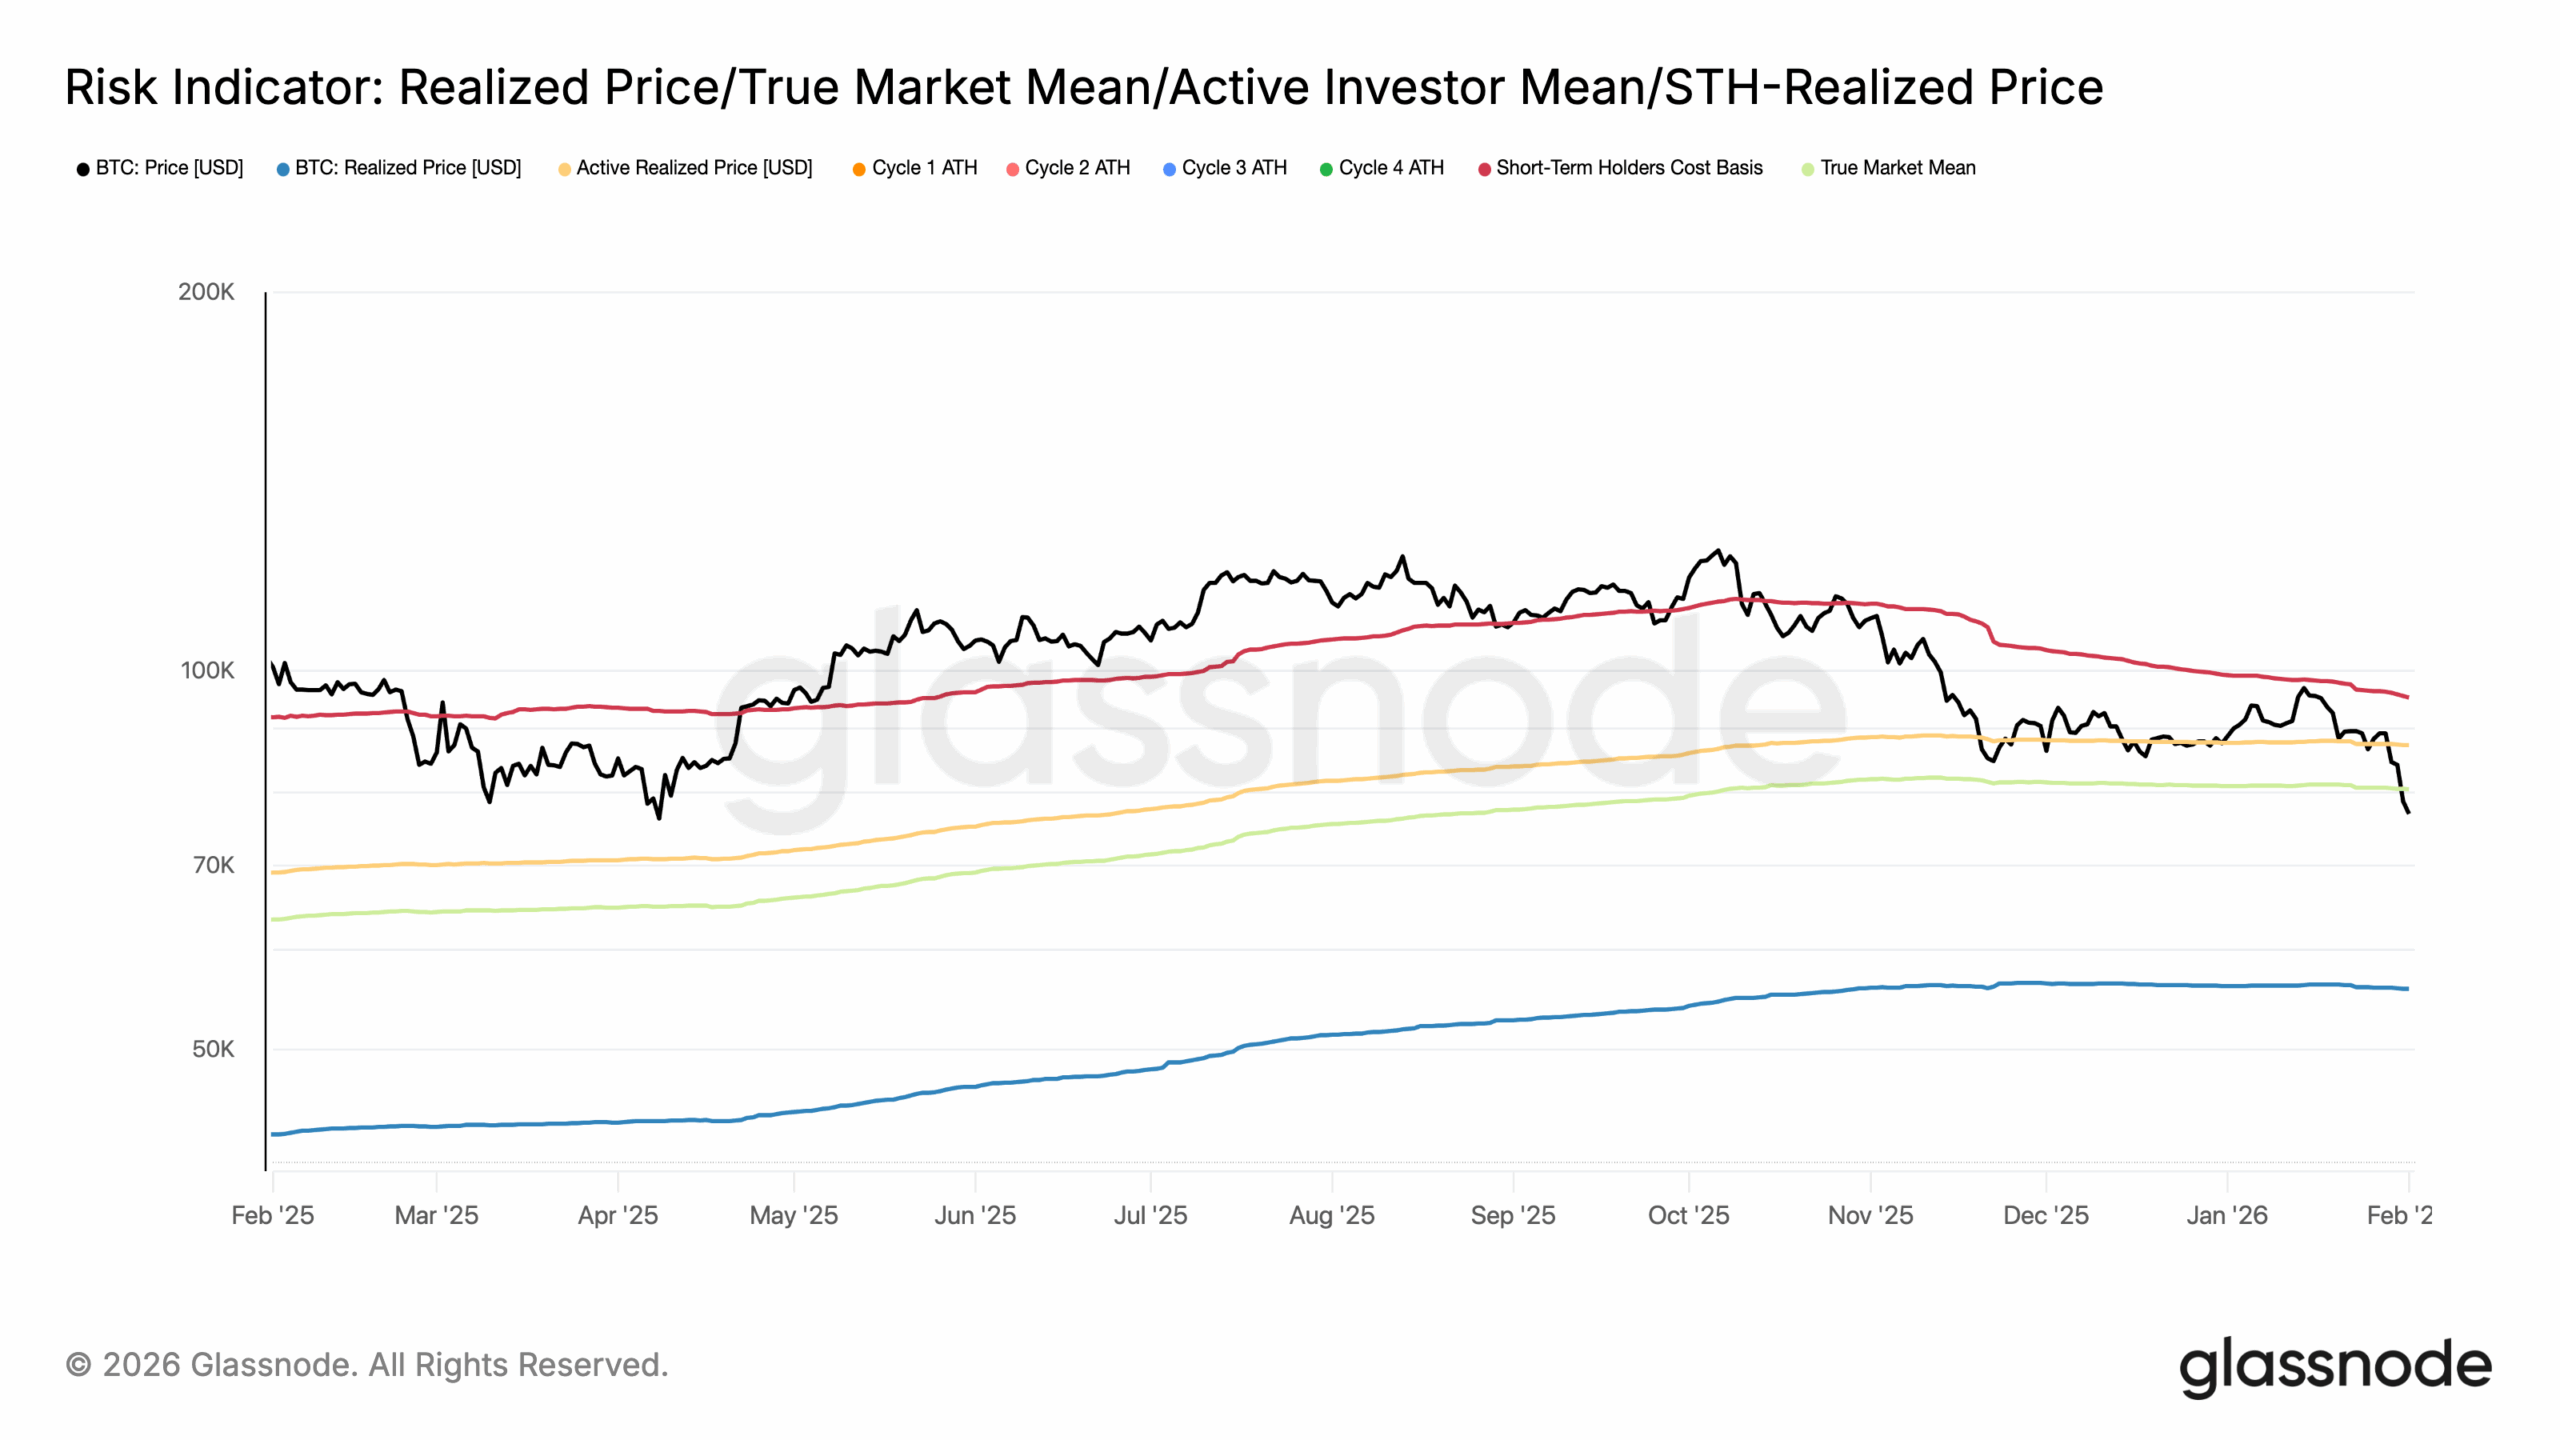
With Bitcoin’s price breaking below the True Market Mean, it risks falling below $60,000.
The crypto market has tipped from stress into outright crisis.
This happened as the Bitcoin (BTC) price briefly broke below the $75,000 psychological threshold before it bounced.
Notably, BTC tagged an intraday low near $74,683 and confirming a roughly 40% drawdown from its October 2025 peak.
What had been framed as a deep correction has turned into something more structural.
Over the past 48 hours alone, more than $2.58 billion in leveraged positions have been liquidated.
This also brings the total liquidations over the past five days to approximately $5 billion.
Historically, this scale of forced selling typically marks a cycle change.
So, the question here is — Is Bitcoin now in a bear cycle?
Why Is Bitcoin Price Falling?
This move wasn’t driven by a single headline, but by a convergence of pressures that hit simultaneously.
At the center of it was policy. President Trump’s nomination of Kevin Warsh to succeed Jerome Powell as Federal Reserve Chair landed as a shock to markets that were still clinging to the idea of renewed easing in 2026.
Warsh’s reputation as a monetary hawk and his long-standing criticism of balance-sheet expansion immediately reset expectations.
The U.S. dollar surged, rate-cut odds for the first half of 2026 collapsed, and risk assets were repriced lower in one sweep.
Bitcoin, which had been trading on residual liquidity optimism, suddenly found itself on the wrong side of a tightening narrative.
Geopolitics added fuel to the fire. Reports of an explosion at Iran’s Bandar Abbas port reignited fears of a broader U.S.–Iran escalation, sending oil prices higher and pushing global risk sentiment into extreme fear territory.
In that environment, Bitcoin failed a test it passed in earlier cycles.
Rather than behaving like a hedge, it traded as a high-beta asset, sold aggressively as investors raised cash to cover losses elsewhere.
The dollar, not crypto or even gold, became the preferred refuge.
In the near term, Bitcoin’s price faces two paths. A rapid recovery above the True Market Mean would likely signal that this move is a bear trap.
However, the current position indicates that the cryptocurrency is unlikely to reclaim it.
If that is the case, Bitcoin’s price risks an extended correction, possibly moving the coin into a bear market.
Analysts Agree on the Timing
Amid this development, several analysts also see the recent decline as a bear-market confirmation.
For instance, Julio Moreno, Head of Research at CryptoQuant, shares this bias. According to him, the blame lies largely on the treasury companies.
“If I was asked to blame someone for the bear market it would be treasury companies. They diverted demand from real spot Bitcoin and then destroyed all that value,” Moreno stated.
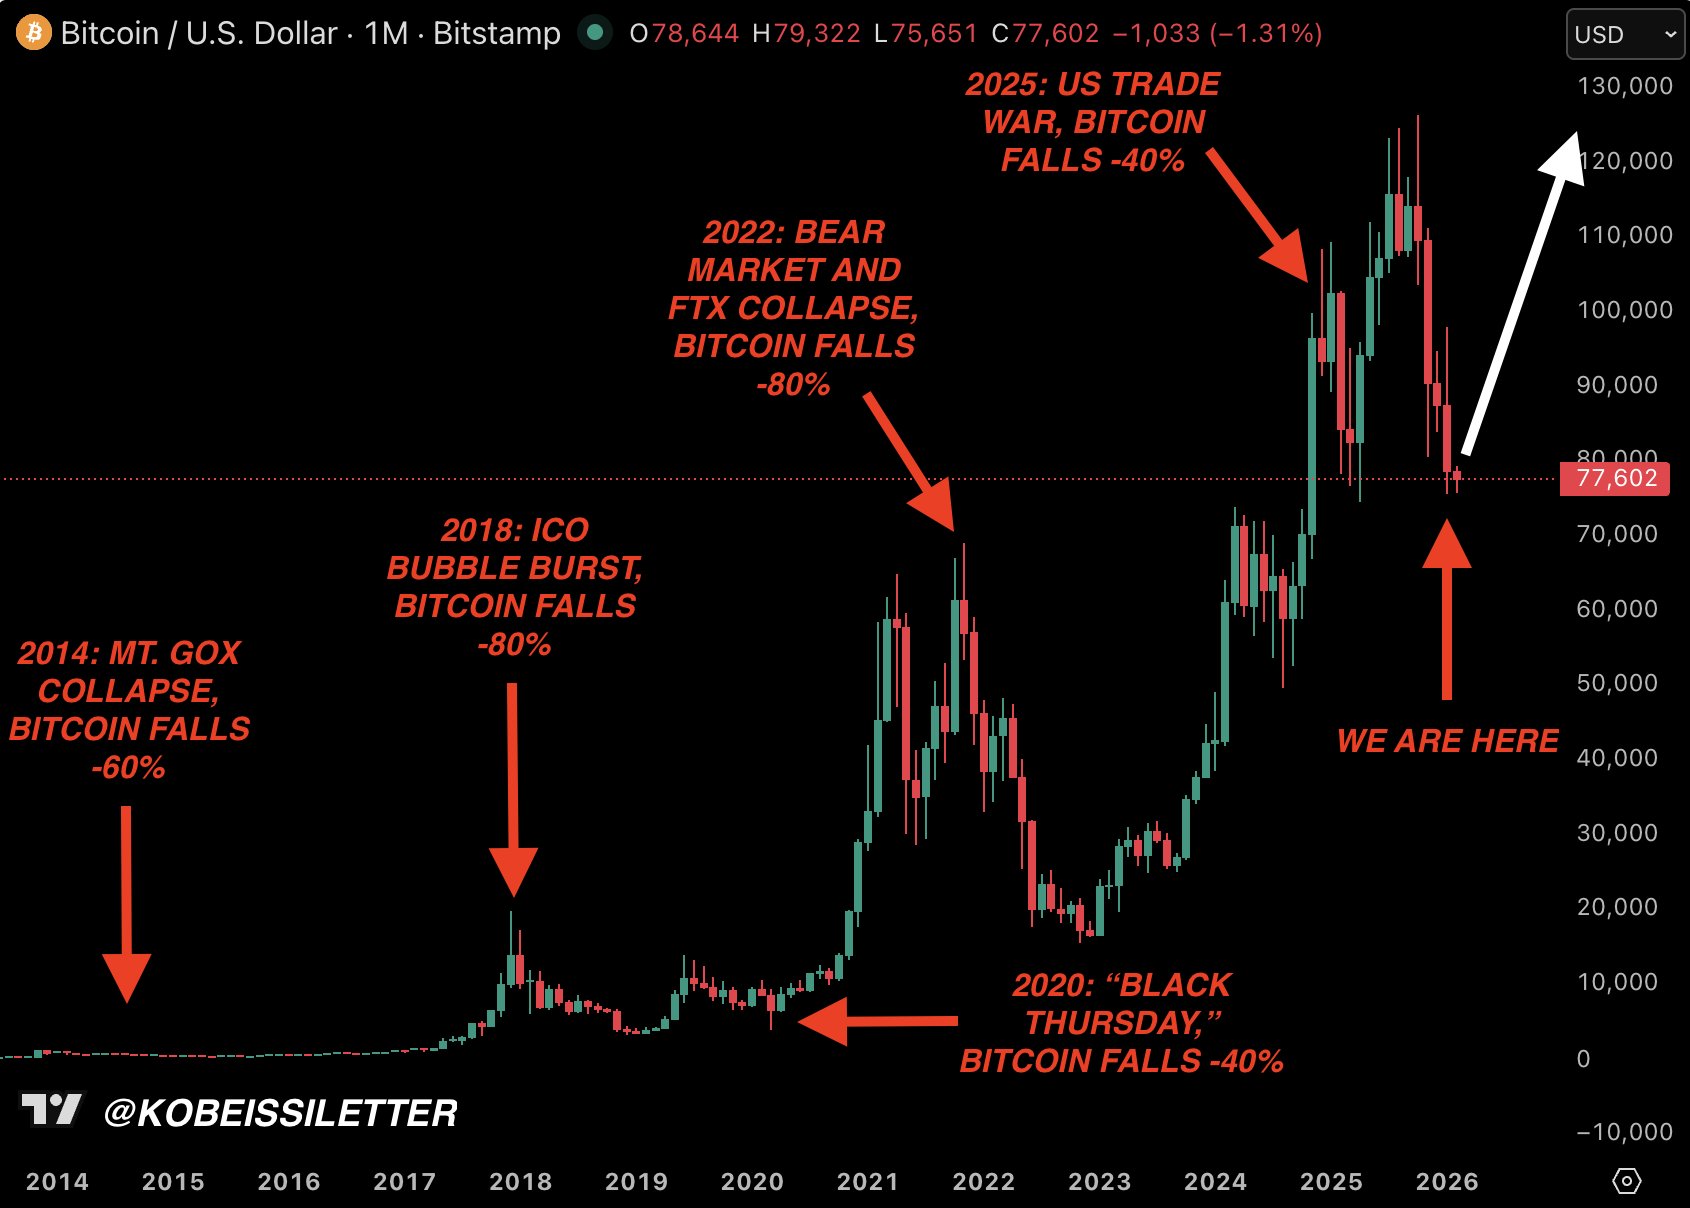
Meanwhile, leading commentary on the global capital markets, The Kobeissi Letter, agreed that 2026 could remain a bear market.
However, the handle noted that it will not be the end of crypto as a bullish reversal could occur in a year or two.
The ETF bid that underpinned Bitcoin through much of 2025 has evaporated. U.S. spot Bitcoin ETFs have seen roughly $1.6 billion in net outflows in January, with BlackRock’s IBIT posting a single-day redemption of more than $500 million on Jan. 30.
At the same time, market depth has thinned dramatically.
With liquidity down sharply and weekend conditions amplifying every order, the break of $80,000 turned into a vacuum, accelerating the slide once stops and margin calls cascaded.
On-chain and technical signals are now lining up with the price damage.
Realized cap has flattened while market cap continues to fall, a sign that fresh capital has stopped entering and more informed holders are exiting.
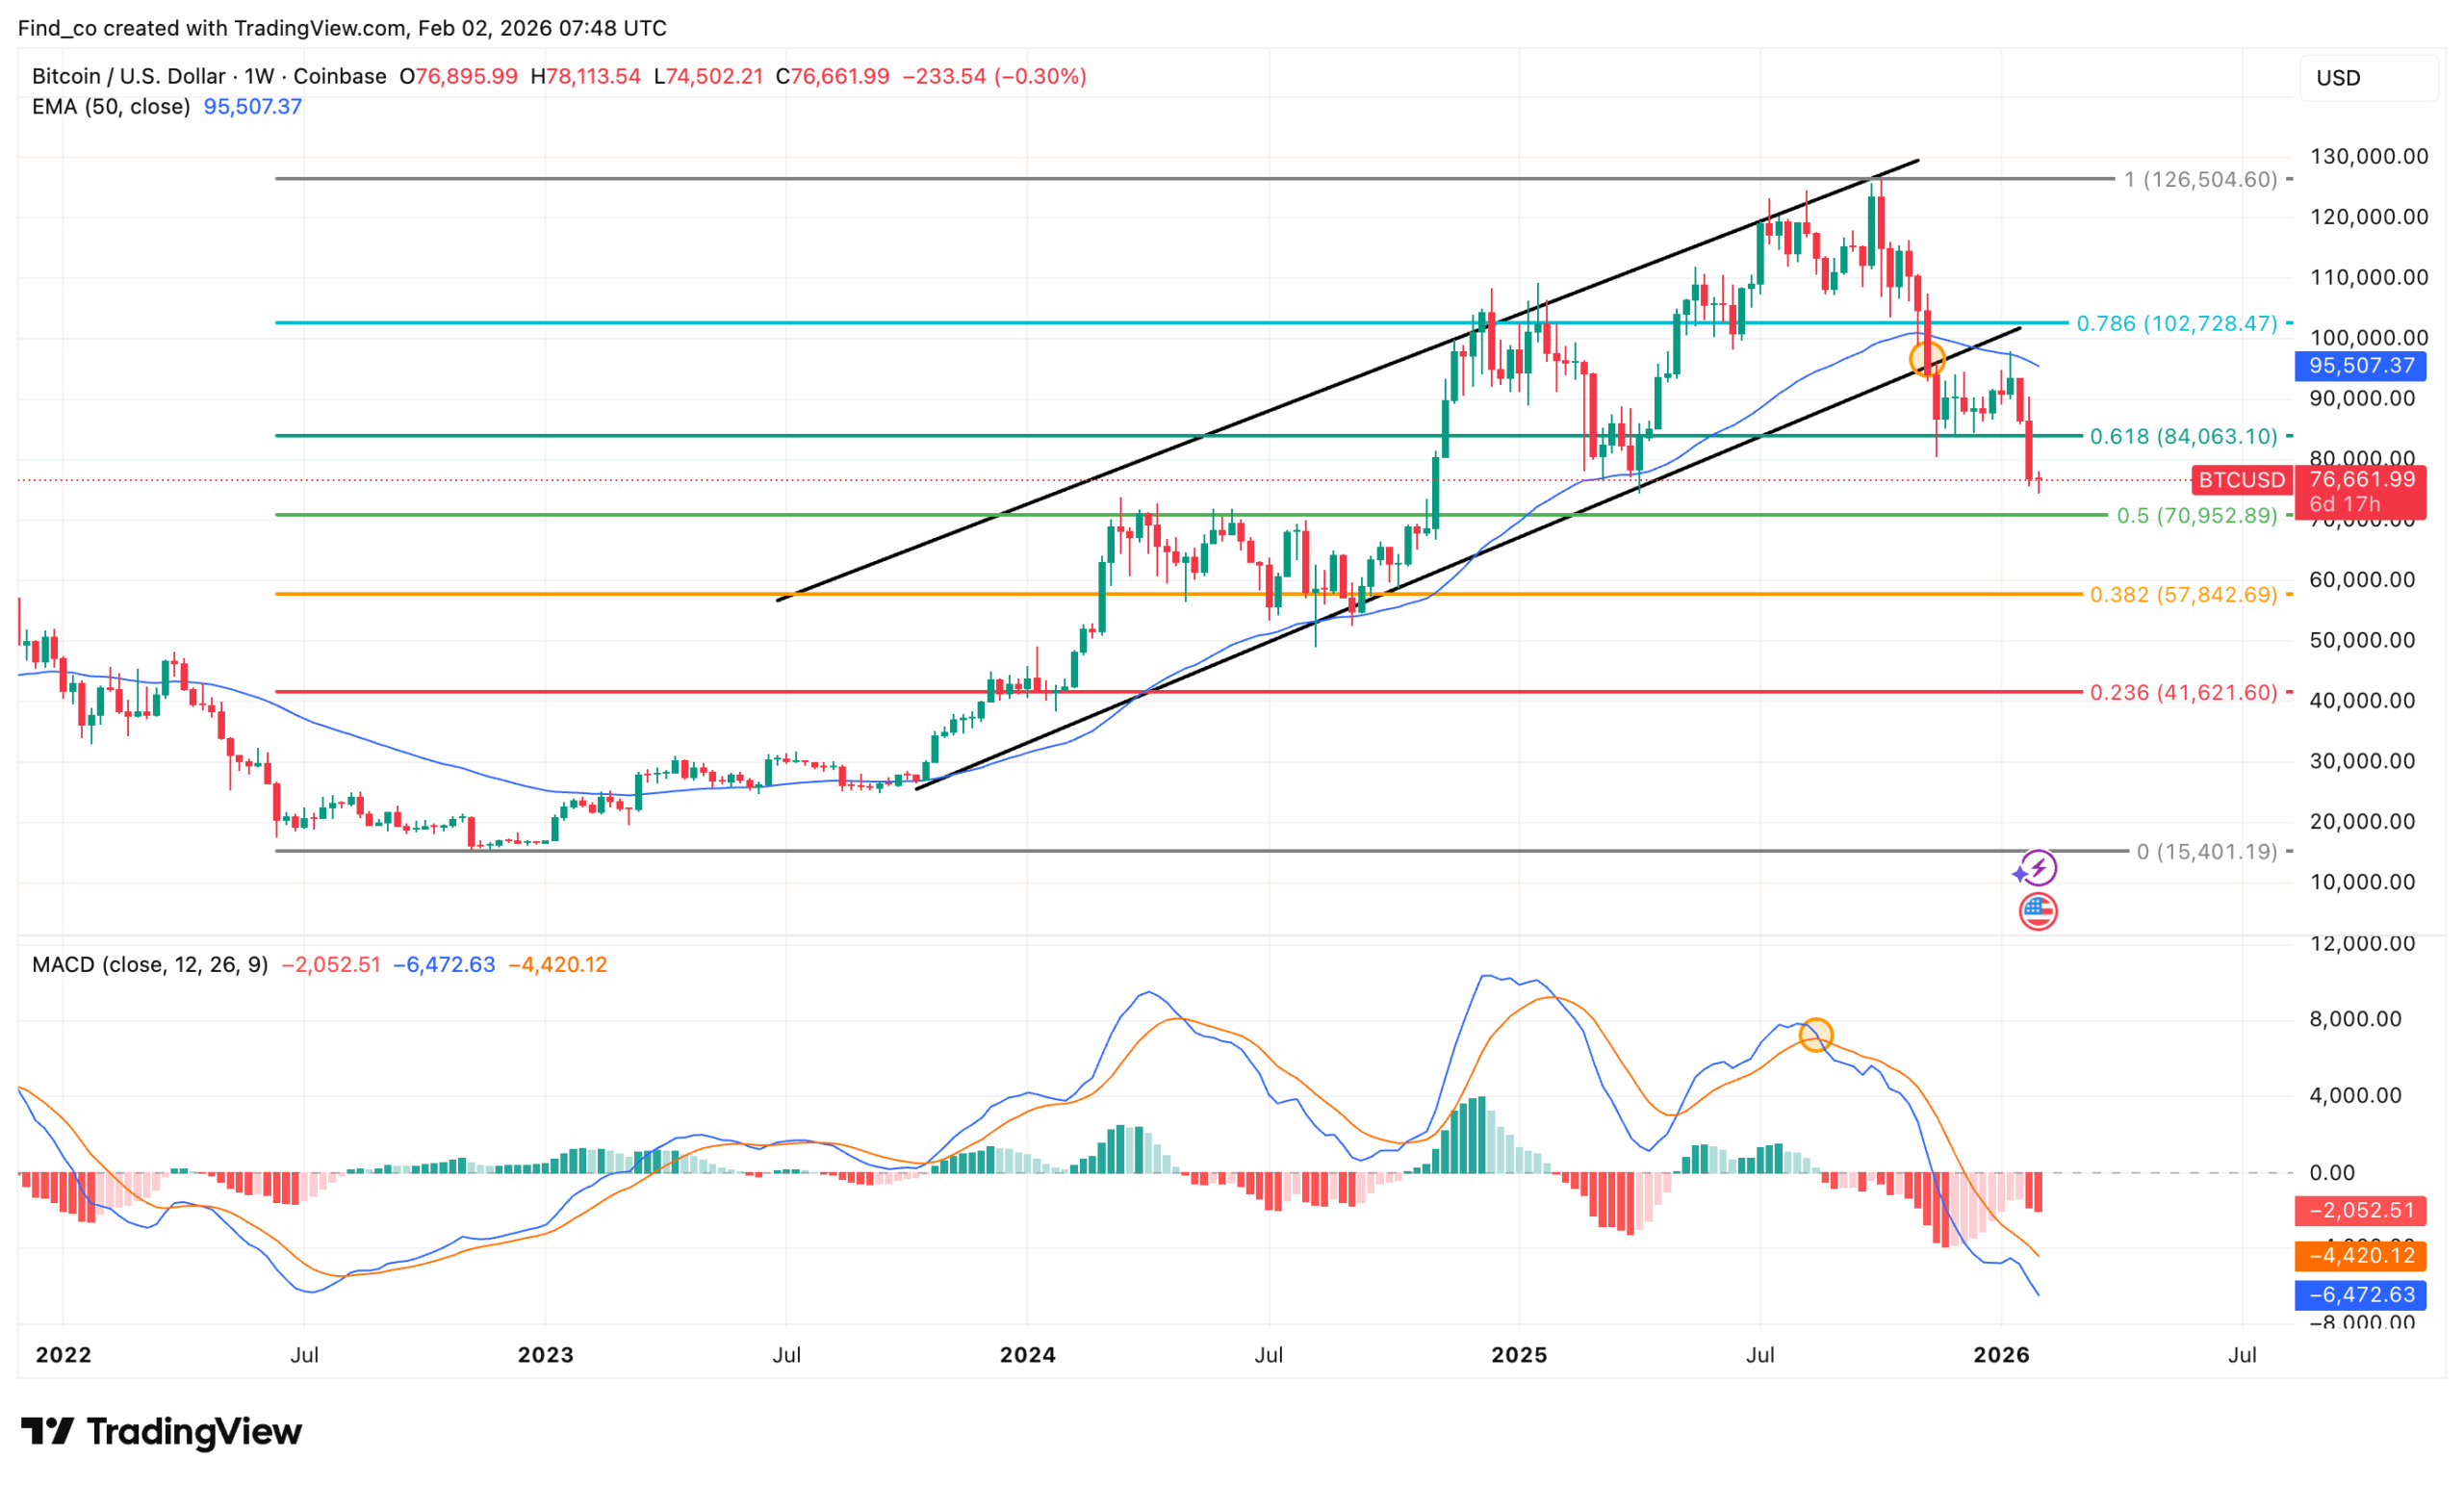
Still, the structure is not fully broken. As long as BTC holds above the $70,000 to $72,000 region, the move can still resolve into a deep but healthy retracement.
However, by the looks of things, a weekly close below that zone is likely.
In that scenario, Bitcoin’s price might decline toward the 0.382 retracement near $57,842, shifting the narrative toward a larger bear cycle.
Disclaimer:
The information provided in this article is for informational purposes only. It is not intended to be, nor should it be construed as, financial advice. We do not make any warranties regarding the completeness, reliability, or accuracy of this information. All investments involve risk, and past performance does not guarantee future results. We recommend consulting a financial advisor before making any investment decisions.
Victor Olanrewaju is a crypto analyst and reporter at CCN with deep roots in on-chain research and technical analysis. His crypto journey began in 2017, but it was the 2020 Uniswap airdrop that sparked a full-time pivot into the space.
With a foundation in copywriting, Victor honed his craft creating high-converting content for leading crypto brokers — most notably an XRP price prediction that ranked #1 on Google during the 2021 bull run.
He later joined AMBCrypto in 2022, where he combined storytelling with technical and on-chain analysis to cover key market narratives.
In 2024, he expanded his expertise at BeInCrypto, collaborating with analysts and using tools like Glassnode, Santiment, and IntoTheBlock to break down Bitcoin and altcoin trends.
At CCN, Victor covers the top cryptocurrencies, memecoins, macro shifts, blending real-time insights with deep-dive metrics.
He holds a Bachelor’s degree in Physics from the University of Ibadan, equipping him to simplify complex data for a wide audience. Follow his work or connect on LinkedIn or X.