. China-led ETF outflows and margin calls suggest gold and silver aren’t done falling | Credit: Hameem Sarwar
Share
Key Takeaways
Gold and silver are undergoing a sharp, volatility-driven correction amid multiple sell pressures.
China-linked ETFs are draining a key pillar of demand, removing the bid that supported the uptrend.
Crypto liquidations are adding forced, cross-asset selling, increasing the odds that metals prices decline.
The precious metals market is now going through a correction that feels uncomfortably familiar to crypto traders.
After January’s historic rally, gold and silver have rolled into a violent deleveraging phase. Notably, the price action looks less like orderly profit-taking and more like forced unwinds colliding across markets.
Here is why the metals are unlikely to rebound anytime soon.
China Lets Go of the Metals
The immediate gravity point has been China.
While Western desks were fixated on the Fed and U.S. macro signals, the real pressure came from the world’s largest bullion market.
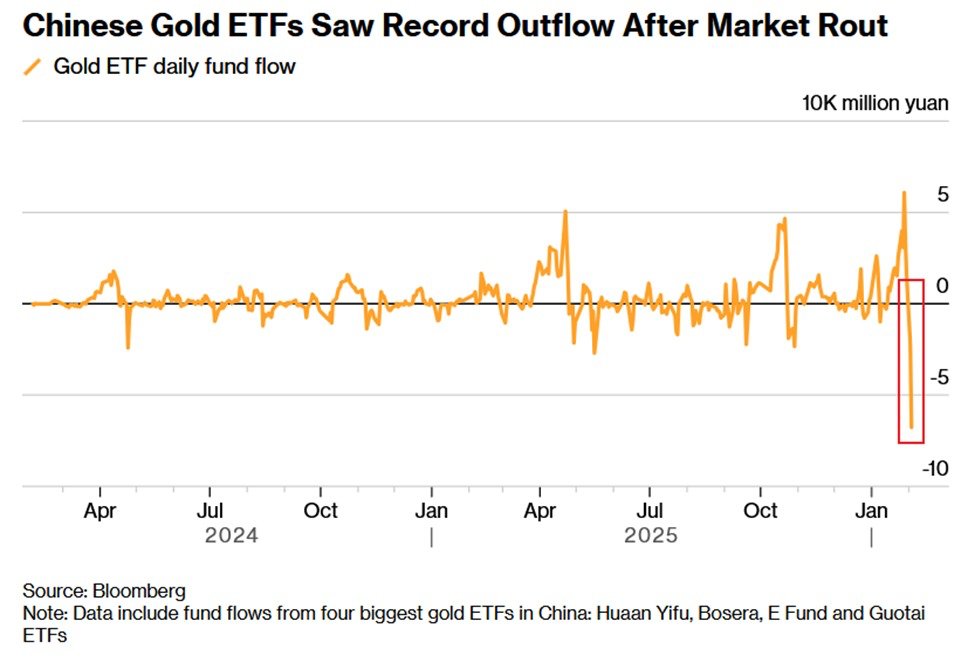
After pulling in more than $7 billion during January’s parabolic run, Chinese gold-backed ETFs flipped abruptly into distribution mode.
Over two days, funds such as the HuaAn Gold ETF reportedly saw outflows of between $890 million and $1 billion.
In fact, this is one of the largest short-term drawdowns on record. The behavioral shift showed up everywhere.
For instance, Shanghai Gold Exchange premiums, which had blown out to an extreme of $43 per ounce over London, began to collapse as retail enthusiasm reached saturation.
Reports of gold-buying apps briefly buckling under traffic as investors rushed to sell signify how crowded the trade had become at the peak.
What’s made this correction more dangerous is its synchronization with crypto. The $2.58 billion liquidation cascade in digital assets didn’t stay contained.
Many hedge funds and multi-asset traders now operate under portfolio margin frameworks, where crypto and metals are treated the same way in the collateral pool.
To raise cash quickly, traders sold what they could, and that meant liquid, profitable positions in gold and silver.
Gold Price Forecast
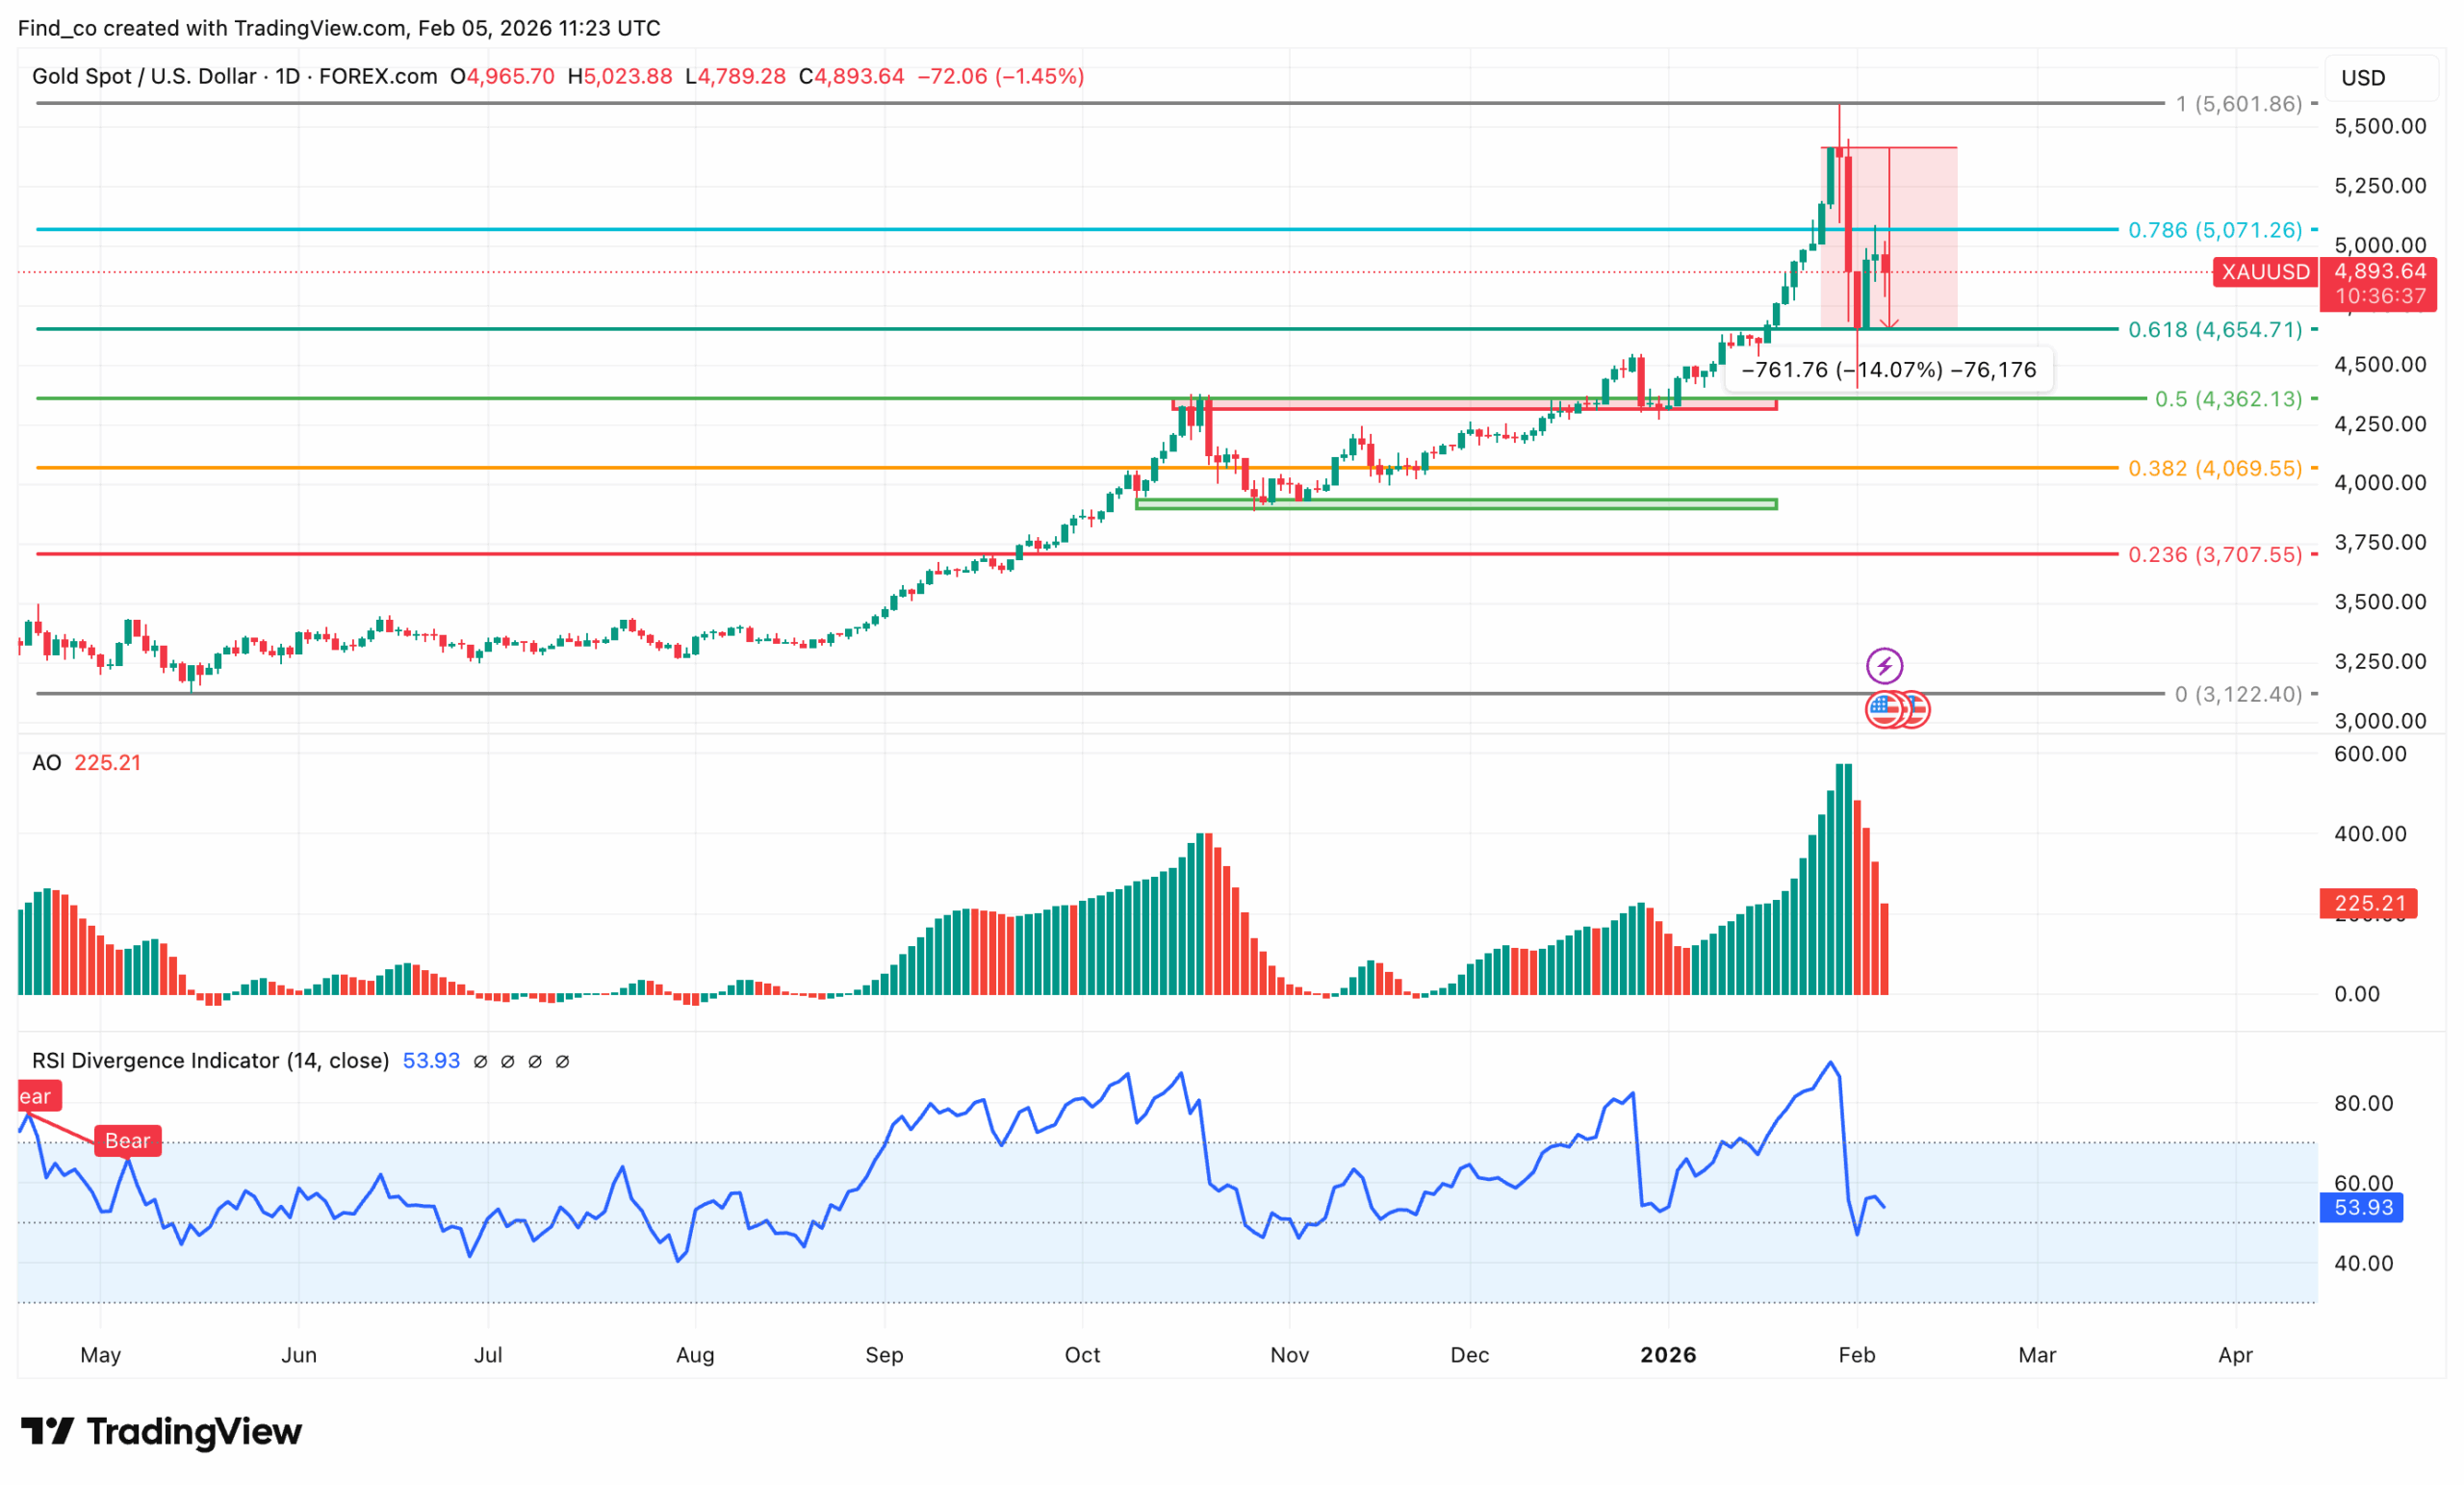
The damage has been severe. Gold has fallen roughly 14% from its January peak near $5,595 to around $4,812.
On the daily chart, Gold, like silver, has formed a textbook post-breakout. Previously, gold’s price accelerated into the $5,600 region, where it was rejected near the upper extension zone.
Technically, the correction so far remains controlled. Gold has pulled back from the 0.786 Fibonacci extension and is now hovering just below $4,900, with the 0.618 retracement around the mid-$4,600s acting as the next major support.
As long as price holds above the 0.5 retracement near $4,360, the broader bullish structure remains intact. In previous gold cycles, similar pullbacks into the 0.5 to 0.618 zone often acted as reset points before the next leg higher.
Furthermore, the Awesome Oscillator (AO) has started to roll over from elevated levels.
This signals slowing upside momentum. However, the Relative Strength Index (RSI) has dropped back toward neutral territory after spending time near overbought conditions.
This suggests excess bullish leverage is being worked off, which is healthy for trend continuation.
From a forward-looking perspective, if gold’s price stabilizes between $4,600 and $4,400 and reclaims $5,000, the prior highs near $5,600 come back into focus.
However, a loss of the $4,360 level would shift the narrative toward a deeper correction, possibly targeting the $4,070 range.
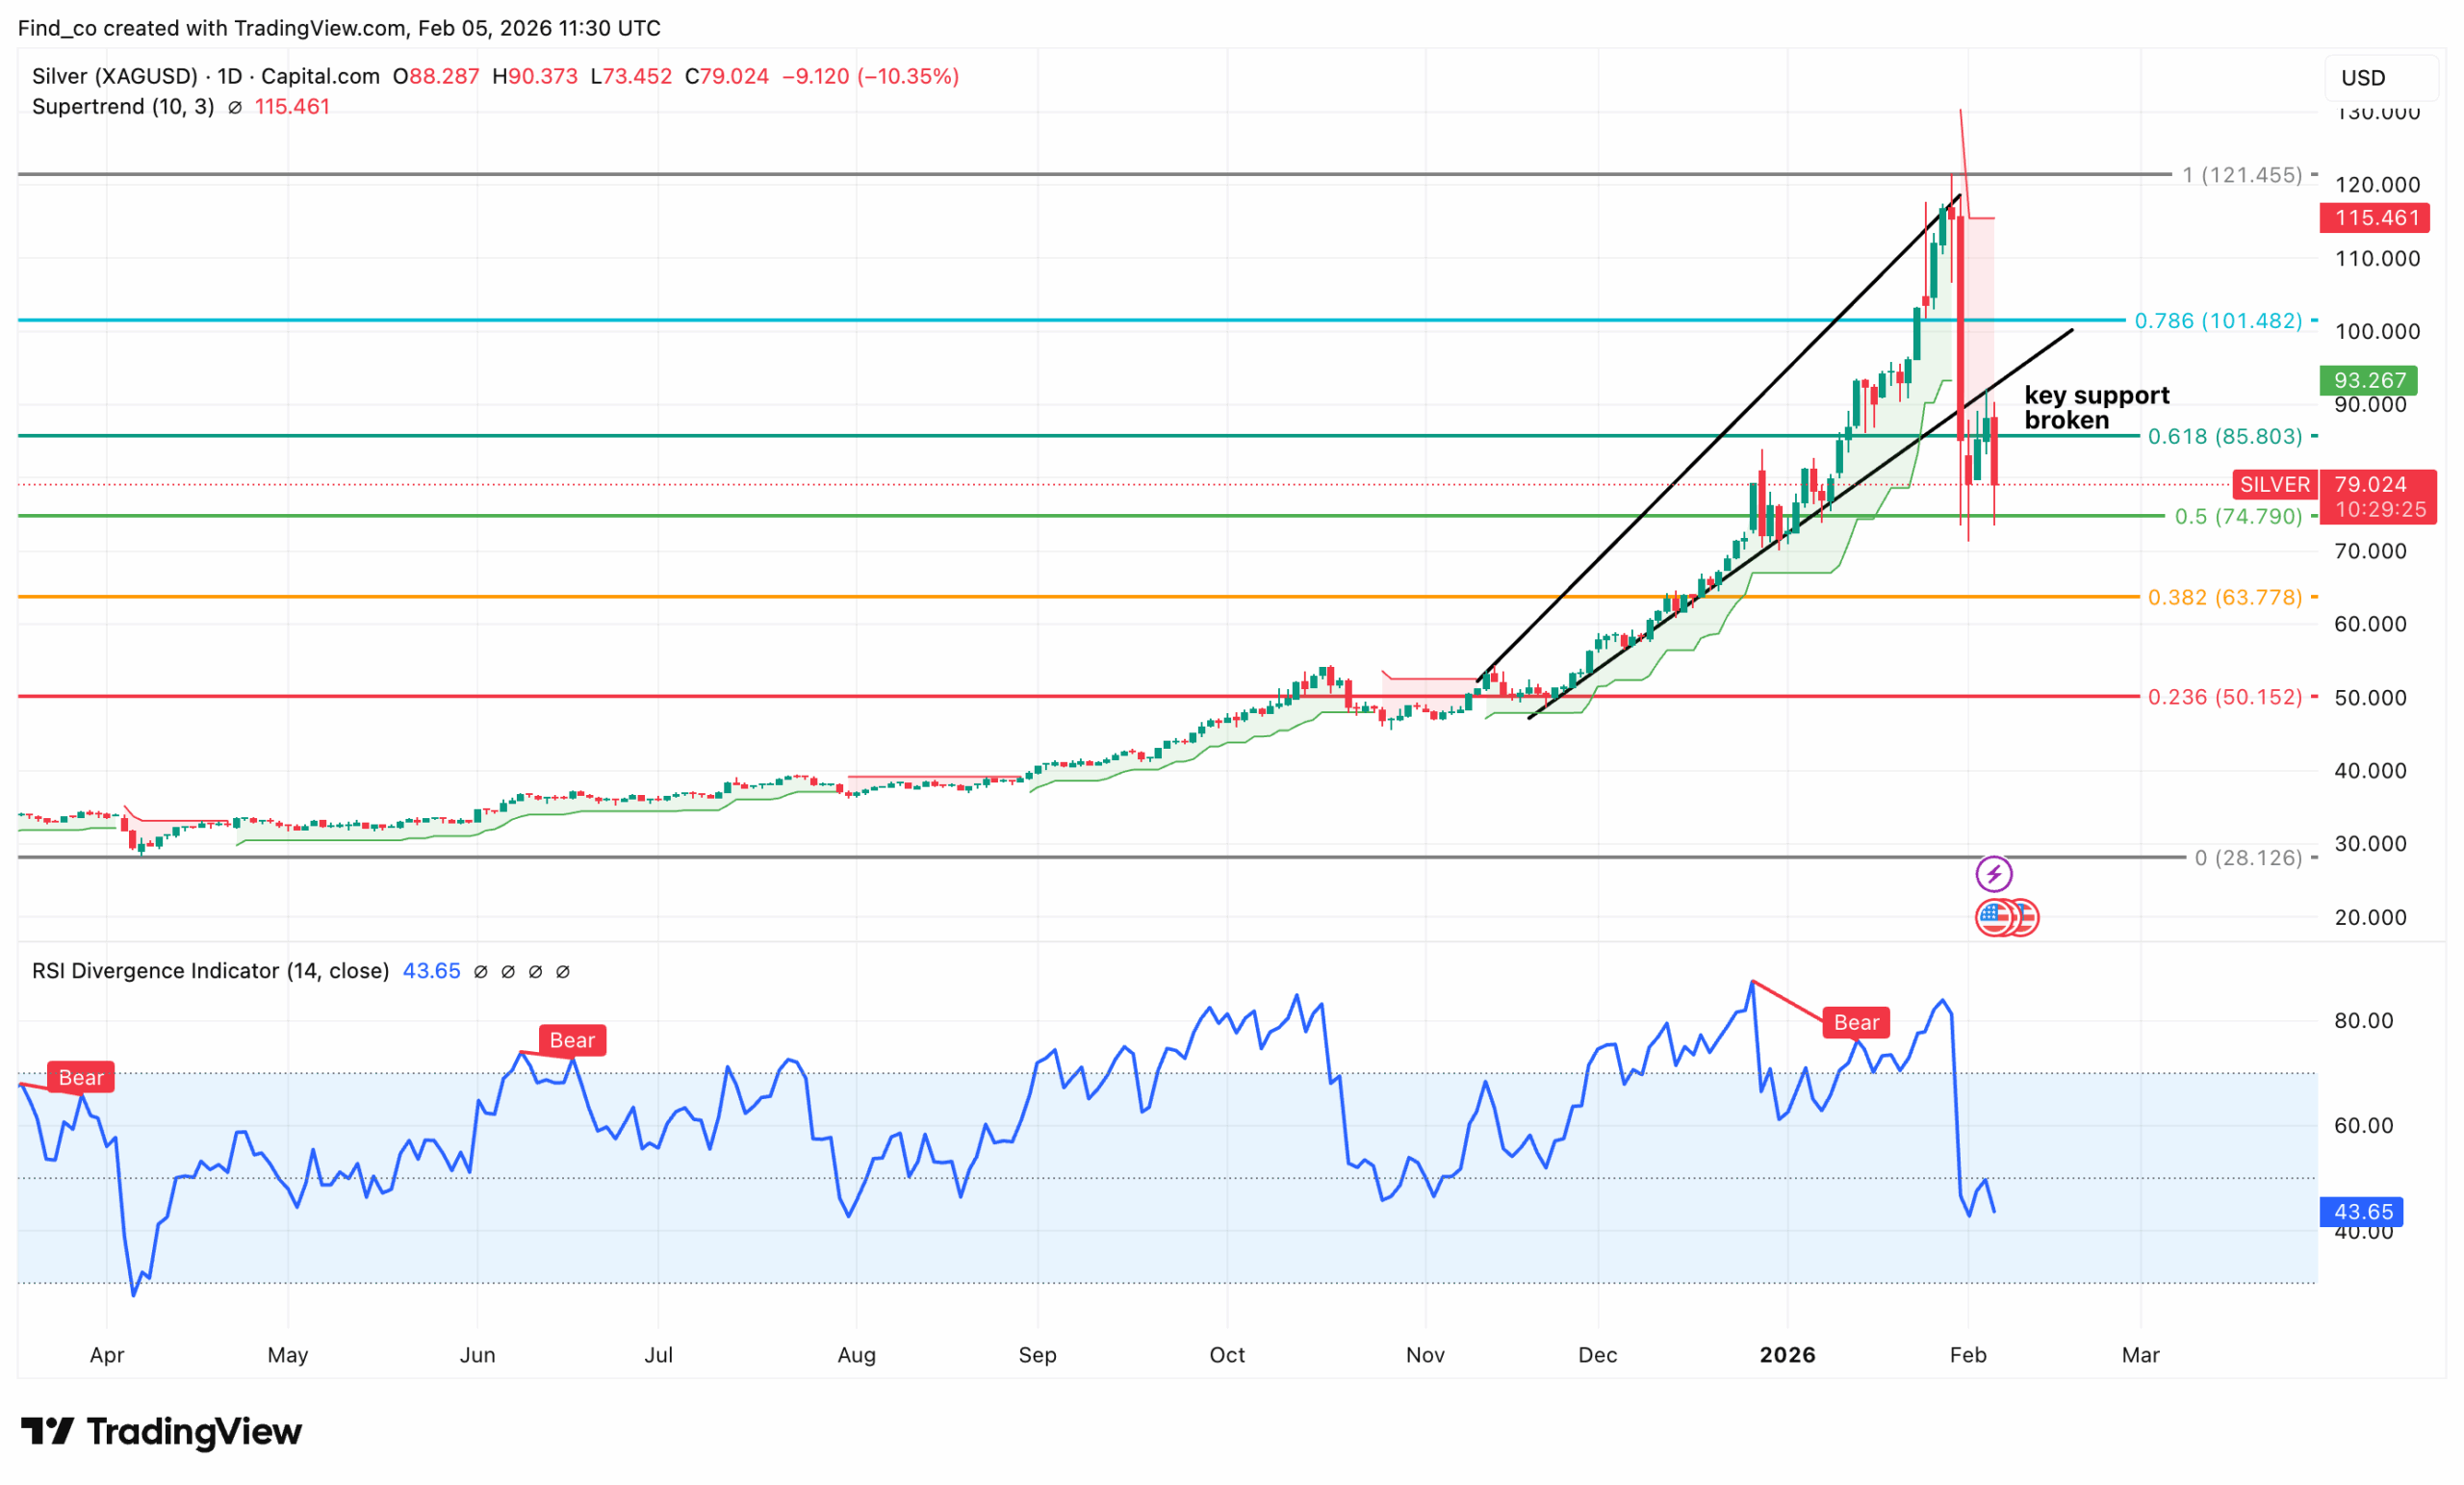
Furthermore, silver entered a corrective phase after an aggressive multi-month rally, as did gold.
A close look shows that the metal was rejected near $120. This move marks one of the strongest downside candles in the current cycle.
Technically, a key support level has now been broken. Silver lost the 0.618 Fibonacci retracement around $85, a zone that previously acted as strong demand during the uptrend.
The break below this level weakens the immediate bullish structure and opens the door for a deeper retracement.
At the time of writing, the price is currently hovering just above the 0.5 retracement at $74.8, which has now become a critical line for bulls to defend.
Failure to hold this area would expose the 0.382 level near $63.8 as the next downside target.
The Relative Strength Index (RSI) has dropped into the low-40s after flashing multiple bearish divergences.
Those divergences warned of weakening upside momentum even as silver’s price continued higher
From a broader perspective, this move still fits within a larger bullish cycle, provided deeper supports hold.
Strong silver bull markets have historically included violent pullbacks that reset sentiment and leverage before continuation.
If price stabilizes between $75 and $64 and reclaims the $90 region, the longer-term uptrend remains intact.
However, continued weakness below $75 would signal a more prolonged corrective phase.
Disclaimer:
The information provided in this article is for informational purposes only. It is not intended to be, nor should it be construed as, financial advice. We do not make any warranties regarding the completeness, reliability, or accuracy of this information. All investments involve risk, and past performance does not guarantee future results. We recommend consulting a financial advisor before making any investment decisions.
Victor Olanrewaju is a crypto analyst and reporter at CCN with deep roots in on-chain research and technical analysis. His crypto journey began in 2017, but it was the 2020 Uniswap airdrop that sparked a full-time pivot into the space.
With a foundation in copywriting, Victor honed his craft creating high-converting content for leading crypto brokers — most notably an XRP price prediction that ranked #1 on Google during the 2021 bull run.
He later joined AMBCrypto in 2022, where he combined storytelling with technical and on-chain analysis to cover key market narratives.
In 2024, he expanded his expertise at BeInCrypto, collaborating with analysts and using tools like Glassnode, Santiment, and IntoTheBlock to break down Bitcoin and altcoin trends.
At CCN, Victor covers the top cryptocurrencies, memecoins, macro shifts, blending real-time insights with deep-dive metrics.
He holds a Bachelor’s degree in Physics from the University of Ibadan, equipping him to simplify complex data for a wide audience. Follow his work or connect on LinkedIn or X.