ChatGPT and crypto analysts examine how low Bitcoin’s price could fall, exploring worst-case scenarios, historical crashes, and key market risks. | Credit: CCN.com
Share
Key Takeaways
Theoretically, BTC could fall to near-zero since it lacks intrinsic fundamental value like cash flows or earnings.
Past BTC crashes have ranged from 50-86%, with each successive cycle showing smaller retracement percentages relative to preceding rallies.
Interest rates, liquidity conditions, institutional adoption, and regulatory clarity can influence BTC’s downside risk and market stability.
ChatGPT emphasizes probabilistic floors based on adoption and network effects.
Bitcoin (BTC) remains one of the most debated assets in modern finance. Extraordinary volatility, rapid rallies, and dramatic crashes mark its price history. For both seasoned investors and casual observers, a pressing question persists: how low could Bitcoin really go?
To answer this, we’ll explore perspectives from ChatGPT, based on historical data and theoretical factors, alongside the analysis of CCN crypto analyst Valdrin Tahiri, who applies technical tools like Fibonacci retracements and logarithmic channels to Bitcoin cycles.
Together, these viewpoints help us understand both the probabilistic and technical floors for BTC.
ChatGPT’s Take: Bitcoin’s Price Dynamics and Theoretical Floors
Bitcoin differs fundamentally from traditional assets. Unlike stocks, bonds, or commodities, BTC does not generate cash flows, dividends, or earnings. A government guarantee does not back it.
In other words, it has no intrinsic fundamental value in the traditional financial sense. This implies that, theoretically, Bitcoin could fall to very low levels if market confidence collapses.
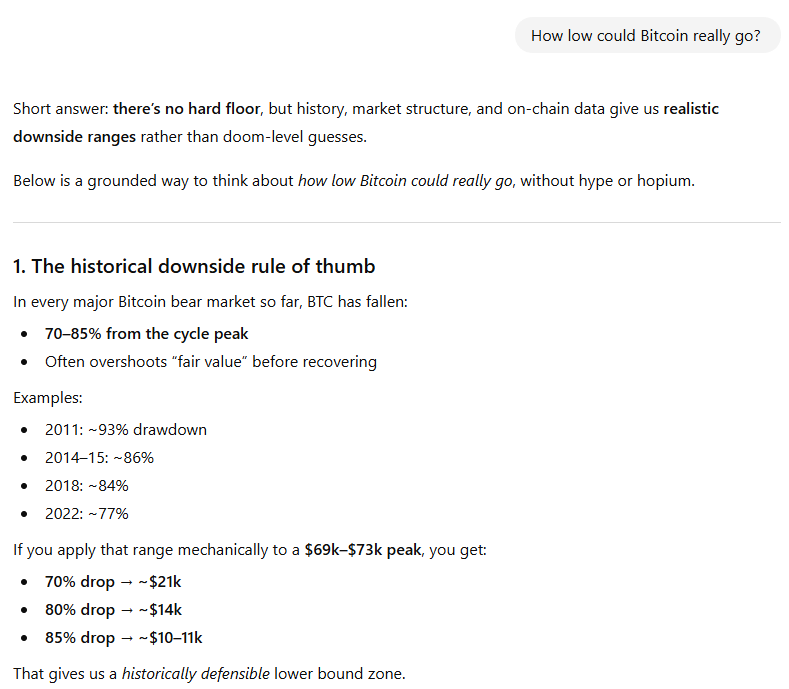
ChatGPT response. | Credit: ChatGPT
However, historical trends and market dynamics suggest there are practical floors:
Historical corrections: Bitcoin has seen losses of 50-80% during major bear markets. For instance, after peaking near $20,000 in 2017, BTC fell to around $3,200 in late 2018, an 84% drop. While extreme, Bitcoin has consistently recovered and established new all-time highs in the aftermath.
Technical support: Analysts often utilize psychological levels ($10,000, $20,000, etc.), historical accumulation zones, and mining economics to estimate support levels. Miners’ cost structures can create natural selling pressure limits; if BTC falls below mining costs, some miners may reduce sales, stabilizing the price.
Macro and regulatory influences: Bitcoin reacts to broader financial conditions. High interest rates, inflation, and reduced liquidity can increase downward pressure. Conversely, regulatory clarity can foster adoption and prevent extreme collapses.
Extreme scenarios: While unlikely, total collapse is possible under conditions such as a global crypto ban, catastrophic exchange failures, or network vulnerabilities.
From ChatGPT’s perspective, Bitcoin could theoretically drop very low, but a complete collapse is improbable due to a combination of historical resilience, long-term adoption, and network effects.
Severe bear markets (50-70% drops) remain a plausible scenario, but total annihilation is a low-probability event.
Crypto Analyst’s View: Fibonacci Retracements and Logarithmic Channels
CCN’s crypto analyst Valdrin Tahiri offers a complementary, more technical view. Tahiri focuses on Bitcoin’s price cycles, which feature rapid rallies followed by lengthy crashes.
His analysis examines historical bear markets and upward movements, revealing patterns that may guide future price predictions.
Key points from Tahiri’s research:
Past bear market declines:
2023: BTC crashed by 86.5%.
2019: BTC crashed by 83.86%.
Previous cycle: BTC dropped 77%.
Tahiri notes that each successive decline has been smaller than the previous one relative to the preceding rally. That is, BTC has retraced less deeply as adoption and market maturity have grown.
Using logarithmic channel and Fibonacci levels, Tahiri observes that:
In 2015, BTC did not reach the 0.382 Fibonacci retracement level.
By 2022, it declined to around 0.5 of its previous peak.
For the future, Tahiri predicts that, in the next cycle, BTC may experience a more profound retracement than 0.5 but less than 77% from its all-time high.
The 0.5-0.618 Fibonacci support zone lies between approximately $33,000 and $44,000, representing a potential bottom range if a bear market continues.
Based on this method, BTC could experience an additional 55% decline from current levels before reaching a significant low.
This aligns with historical cyclical behavior, indicating that technical floors are often lower than current market prices but still above the levels of total collapse.
Bitcoin Price Floors Explained: ChatGPT vs Technical Analysis
When combining ChatGPT’s theoretical perspective with Tahiri’s technical approach, a clearer picture emerges:
Speculative vs. historical floors: ChatGPT emphasizes that, in theory, Bitcoin could approach near-zero if confidence in it evaporates. However, historical resilience, network effects, and long-term adoption create a practical floor well above zero.
Technical support as anchor: Tahiri’s Fibonacci retracements suggest a concrete support range between $33,000 and $44,000 for the current cycle, giving investors a reference point for potential downside. These levels consider prior cycles, retracement ratios, and logarithmic trends, making them grounded in historical price behavior rather than purely theoretical speculation.
Macro factors matter: Both perspectives acknowledge that broader financial conditions, regulatory clarity, and institutional adoption heavily influence BTC’s downside risk. For example, clarity provided by frameworks can reduce volatility by encouraging adoption and mitigating regulatory uncertainty.
Volatility remains inherent: Regardless of the method used, Bitcoin is highly volatile. Sharp intra-cycle declines of 50-70% are plausible, even when technical or historical floors provide guidance.
Bitcoin Price Prediction: Balancing Risk, Support and Uncertainty
Predicting Bitcoin’s exact bottom is impossible, but combining historical patterns, technical analysis, and theoretical considerations provides a probabilistic framework:
Extreme theoretical lows exist, but total collapse is unlikely given adoption, network effects, and historical resilience.
Historical bear markets suggest 50-70% drops are plausible within cycles.
Technical floors based on Fibonacci retracements and logarithmic channels point to a potential range of $33,000-$44,000 as support in the current cycle.
Macro and regulatory factors, including interest rates, global liquidity, and frameworks, can mitigate severe declines.
Ultimately, Bitcoin’s price is shaped by a blend of market sentiment, adoption, and speculative behavior rather than traditional fundamentals.
Investors must consider both technical patterns and the broader financial ecosystem when assessing downside risk. While BTC could drop significantly during bear markets, historical cycles suggest that well-established support zones and institutional participation provide a buffer against catastrophic losses.
For investors, the key takeaway is to prepare for volatility, monitor technical and macro signals, and understand that Bitcoin’s “floor” is probabilistic rather than guaranteed.
What does it mean that Bitcoin has “no fundamental value”?
Bitcoin does not generate cash flows, dividends, or earnings like stocks or bonds. Its price is largely determined by supply, demand, and market sentiment, rather than intrinsic economic factors. Critics argue this means there’s no guaranteed floor for BTC.
How low could Bitcoin theoretically go?
In theory, Bitcoin could fall close to zero if market confidence collapses completely. However, historical trends, adoption, and network effects create practical floors well above zero. Severe bear markets of 50–70% declines are plausible, but total collapse is considered unlikely.
What do logarithmic channels tell us about BTC?
Logarithmic channels help visualize Bitcoin’s long-term price trends, accounting for exponential growth. Tahiri uses them to track price cycles and estimate likely retracement levels in bear markets, complementing Fibonacci analysis.
What’s the difference between ChatGPT’s perspective and analyst predictions?
ChatGPT focuses on theoretical and historical factors, highlighting extreme scenarios and probabilistic floors. Analysts like Tahiri focus on technical patterns, such as Fibonacci retracements and logarithmic channels, to estimate more concrete support levels. Combining both perspectives gives a holistic view of potential downside risks.
Disclaimer:
The information provided in this article is for informational purposes only. It is not intended to be, nor should it be construed as, financial advice. We do not make any warranties regarding the completeness, reliability, or accuracy of this information. All investments involve risk, and past performance does not guarantee future results. We recommend consulting a financial advisor before making any investment decisions.
Giuseppe Ciccomascolo began his career as an investigative journalist in Italy, where he contributed to both local and national newspapers, focusing on various financial sectors.
Upon relocating to London, he worked as an analyst for Fitch's CapitalStructure and later as a Senior Reporter for Alliance News. In 2017, Giuseppe transitioned to covering cryptocurrency-related news, producing documentaries and articles on Bitcoin and other emerging digital currencies. He also played a pivotal role in establishing the academy for a cryptocurrency exchange website. Crypto remained his primary area of interest throughout his tenure as a writer for ThirdFloor.


 Easy
Easy