Key Takeaways
-
Horizontal levels are the backbone of technical analysis, acting as reliable support and resistance zones.
-
Patterns like triangles, wedges, and channels signal whether the trend will continue.
-
Discipline and risk management are crucial since not every pattern plays out perfectly.
Technical analysis is one of the most widely used methods for traders to predict price movements.
At its core, it revolves around identifying key levels and patterns that shape market behavior.
The most straightforward tools are horizontal levels, which act as strong support and resistance zones.
These levels provide traders with clear entry and exit points, allowing them to manage risk while spotting potential breakout opportunities.
Beyond horizontal levels, technical analysis introduces diagonal trendlines, chart patterns like triangles and wedges, and candlestick formations.
By combining them, traders can increase the probability of catching major market shifts.
When used correctly, technical analysis creates a structured approach to trading, helping beginners and professionals stay disciplined and confident in their decisions.
Horizontal Levels
The easiest way to apply technical analysis to your trading is by using horizontal levels as support and resistance.
Unlike diagonal levels, horizontal ones are drawn straightforwardly since their slope is not subject to wick movements.
Horizontal levels act as resistance when an asset’s price is below them and as support when it is above them.
The longer a horizontal level remains in place, the more violent the movement once the price finally moves outside.
One example is the $11,800 horizontal resistance area, which existed for 483 days between June 2019 and October 2020.

- BTC/USDT Weekly Chart | Credit: Valdrin Tahiri/TradingView
The Bitcoin price made three unsuccessful breakout attempts (red icons) before moving outside the range.
The breakout was swift, offering no retest and almost no pullbacks until the then-all-time high of $64,854.
So, a breakout from a 483-day range led to an upward movement lasting 175 days.
Support Turns to Resistance
Once the price exits a long-term range, one common movement is that the previous resistance turns to support and vice versa.
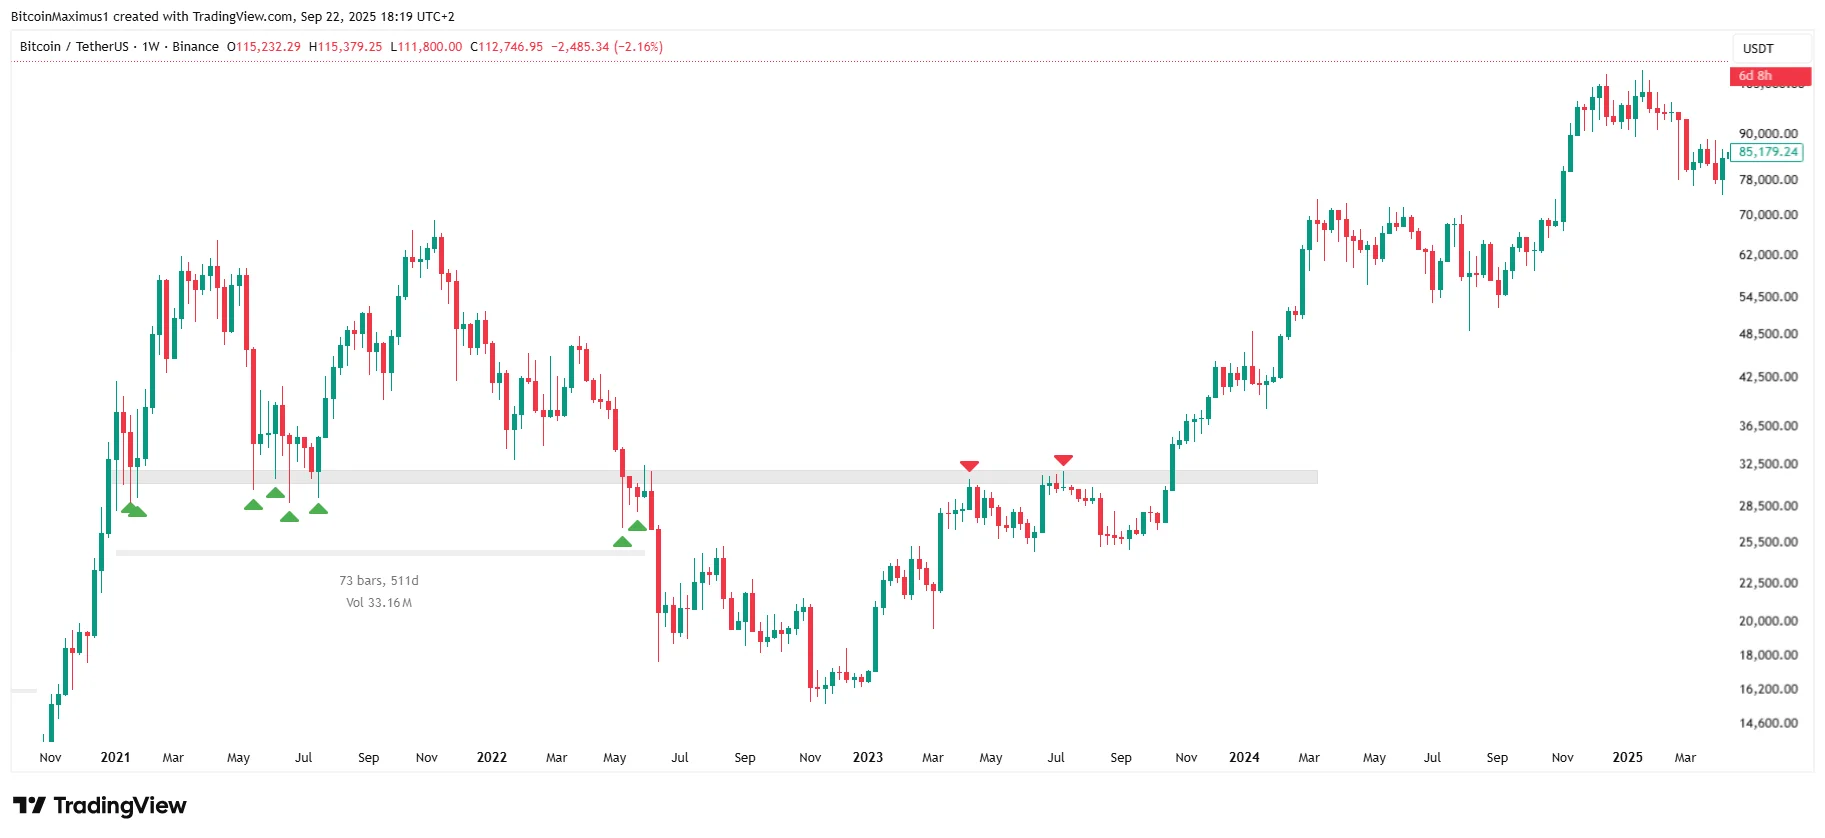
This happened with the $32,000 horizontal support area, which existed for 500 days starting in January 2021.
Like the previous example, the breakdown from the area led to a violent downward movement that continued for several months.
- BTC/USDT Weekly Chart | Credit: Valdrin Tahiri/TradingView
This movement was different because the $32,000 area turned to resistance in 2023 (red icon), twice pushing the price downward.
Bitcoin’s price finally broke out in October 2023, leading to an explosive upward movement that is still ongoing.
It is important to note that this does not always happen. Very often, the price does not even return to the breakout level, especially during bull markets.
However, in choppy markets, support almost always turns to resistance, offering traders a second chance at entering the trade.
Breakout & Retests
Another common occurrence is the breakout and retest, which often happens once the price breaks out from a shorter-term horizontal level.
The breakout and retest confirm the move’s strength and usually lead to trend continuation.
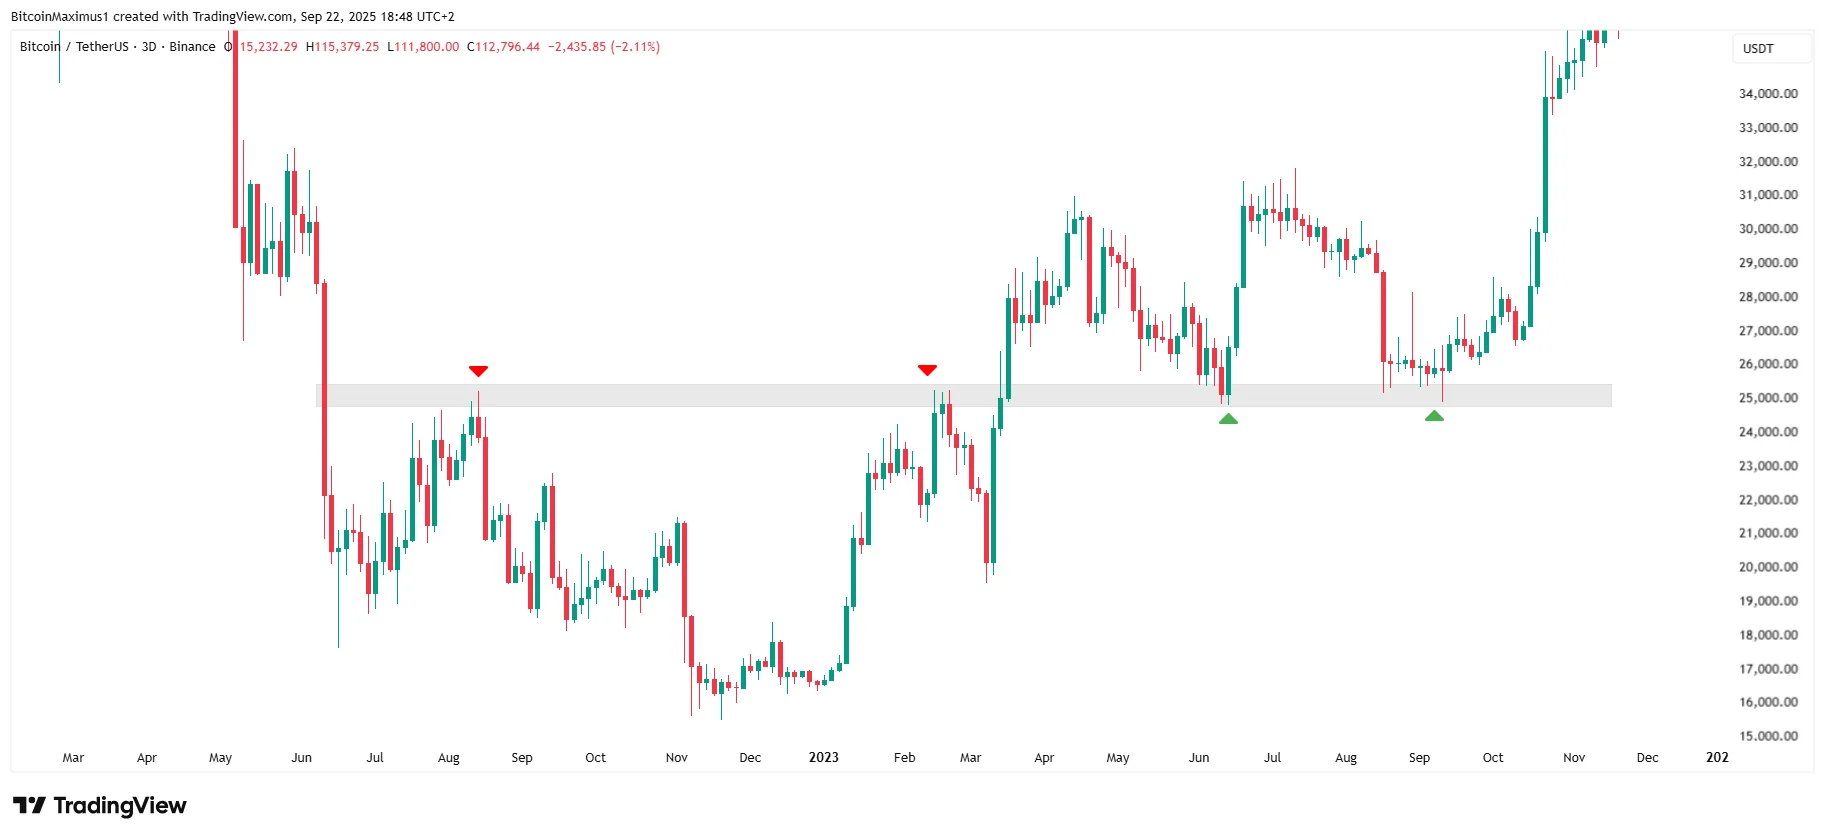
In March 2023, the BTC price broke out from the $25,000 horizontal resistance area after two attempts, and then returned to retest the area as support twice (green icons).
- BTC/USDT 3-Day Chart | Credit: Valdrin Tahiri/TradingView
The breakout and retest are similar to the support-turning resistance; however, they occur in a shorter timeframe and lead to the continuation of the movement in the same direction instead of the other one, as in the previous example.
Practical Tips
The first practical tip for beginners attempting to draw horizontal levels is to use levels that have been touched numerous times. These levels are more likely to be accurate than levels that are still forming.
Another tip is to decrease the focus on levels not touched in a long time.
Even if a horizontal level existed for two years in 2020, it is less likely to provide resistance or support if the price returns to it in 2025.
Finally, long-term horizontal levels take precedence over short-term ones.
For example, if the BTC price trades at a support level in the weekly time frame, but the same level has turned to resistance in the two-hour time frame, the area is more likely to act as support than turn to resistance.
Chart Patterns
Diagonal Trendlines
Once horizontal levels are utilized, the next step in technical analysis is using patterns.
The easiest way to do so is to use diagonal trend lines, which create descending resistance and ascending support trend lines.
- BTC/USDT Six-Hour Chart | Credit: Valdrin Tahiri/TradingView
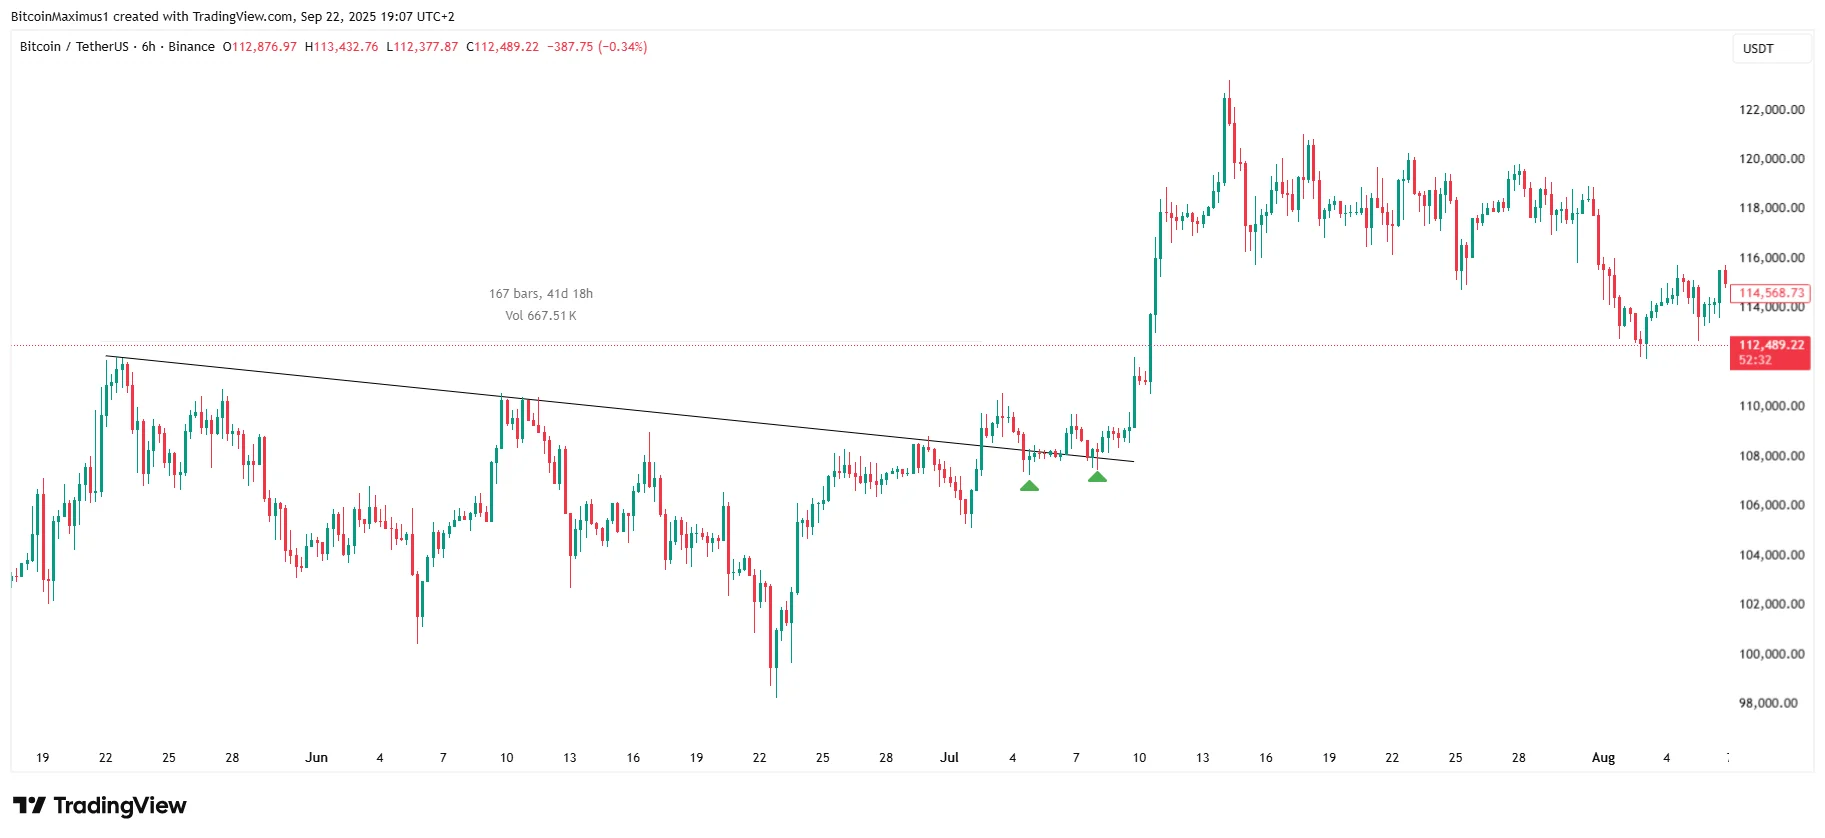
Unlike horizontal levels, there is some leeway when drawing the exact slope of the pattern, since either wicks or closes can be used.
In July 2025, the Bitcoin price broke out from a 41-day resistance and rallied to a new all-time high.
Like it happens with horizontal levels, the price validated the resistance as support twice (green icons) before resuming it.
Triangle Pattern
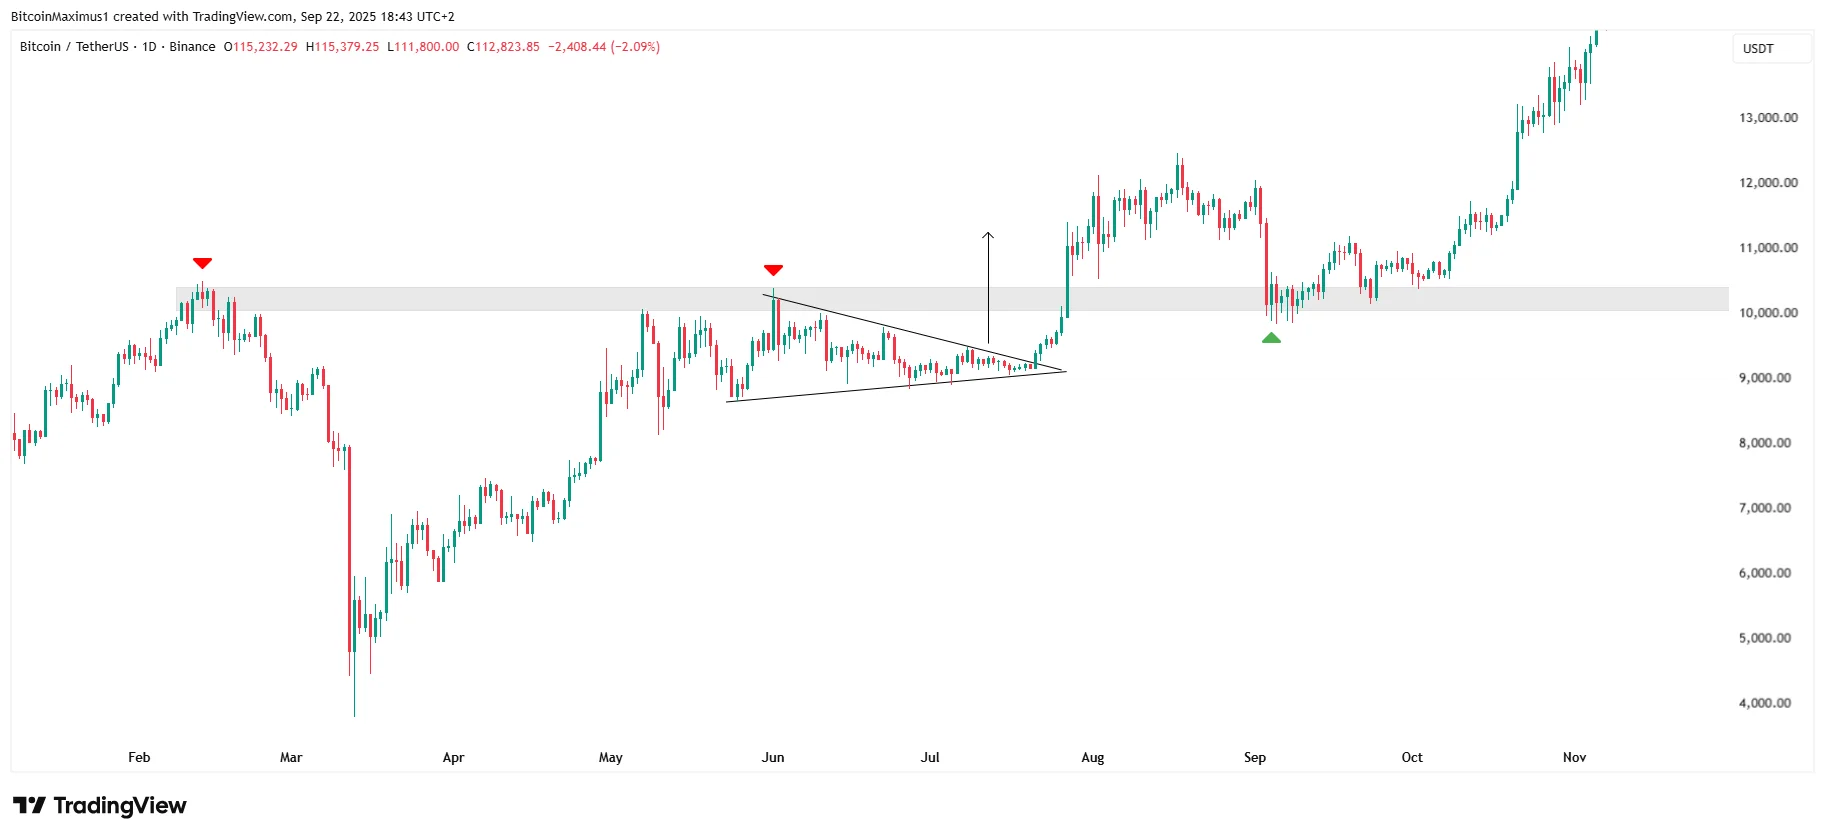
The most common pattern in technical analysis is the symmetrical triangle.
The symmetrical triangle is a neutral pattern, so it usually provides continuation.
With Bitcoin in 2024, the preceding trend was bullish, so the triangle led to a breakout and upward movement.
- BTC/USDT Daily Chart | Credit: Valdrin Tahiri/TradingView
In such cases, the minimum length of the upward movement is the same as the triangle’s height, though the price often overshoots that, as was the case here.
Patterns can be used in combination with horizontal levels. As seen in the triangle example, the Bitcoin price also broke out from the $10,500 horizontal resistance area before returning to validate it as support (green icon).
Hence, the triangle breakout made the breakout from the horizontal level more likely, and that was confirmed with the ensuing retest.
Ascending & Descending Wedges
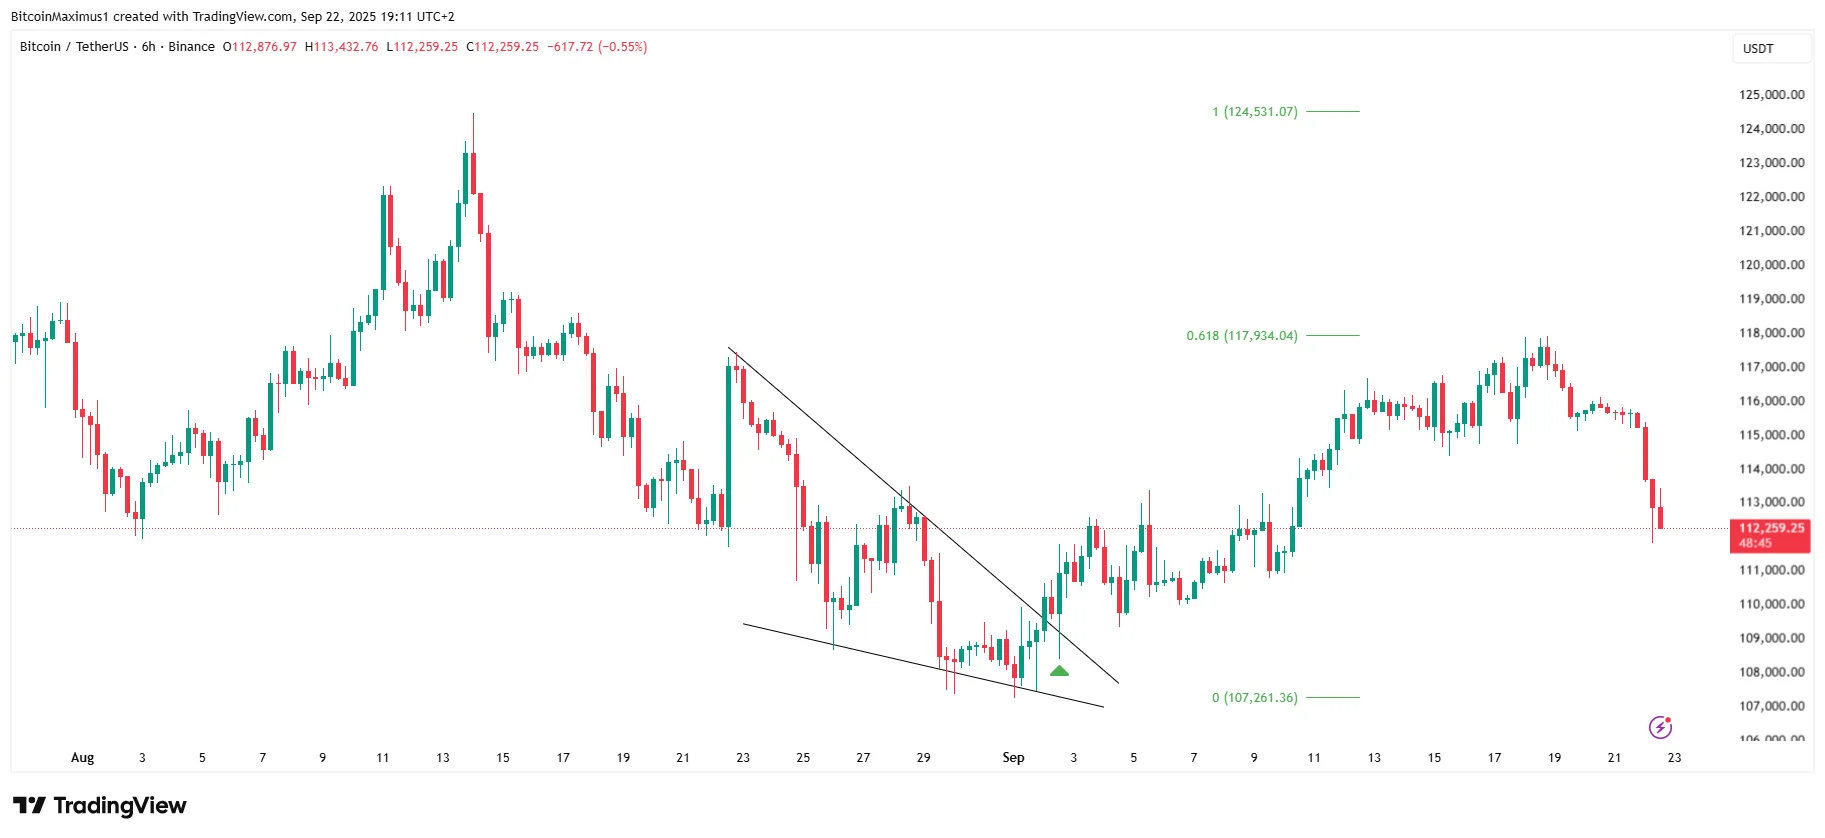
The following common patterns used in technical analysis are descending and ascending wedges.
Descending wedges are bullish patterns, while ascending wedges are bearish.
They usually transpire at the bottom of downward trends and at the top of upward trends and lead to a reversal.
- BTC/USDT Six-Hour Chart | Credit: Valdrin Tahiri/TradingView
The Bitcoin price broke out from a descending wedge at the beginning of September and rallied until it hit the 0.618 Fibonacci retracement resistance.
While the wedge breakout was swift, the Bitcoin price returned to validate it as support (green icon) on Sept. 2 before resuming its upward trend.
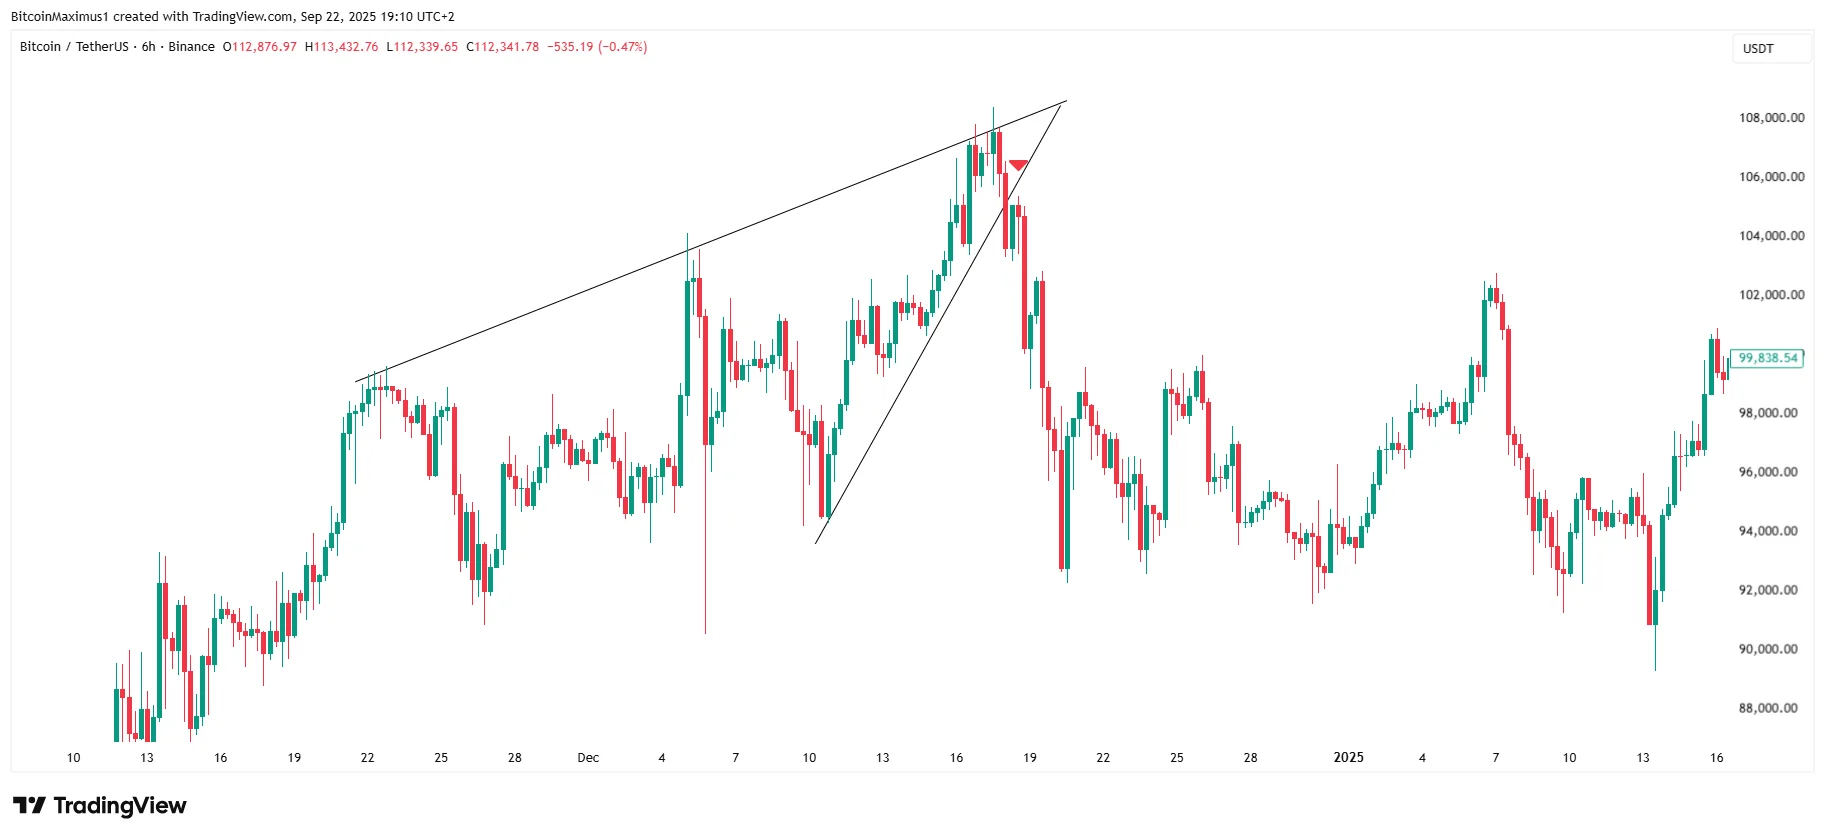
The same thing happened with an ascending wedge created in November and December 2024.
- BTC/USDT Six-Hour Chart | Credit: Valdrin Tahiri/TradingView
Once the price consolidated at the wedge’s convergence points, it eventually broke down, marking the end of the upward trend.
In this breakdown, BTC gave a retest, confirming the wedge as resistance.
Ascending & Descending Channel
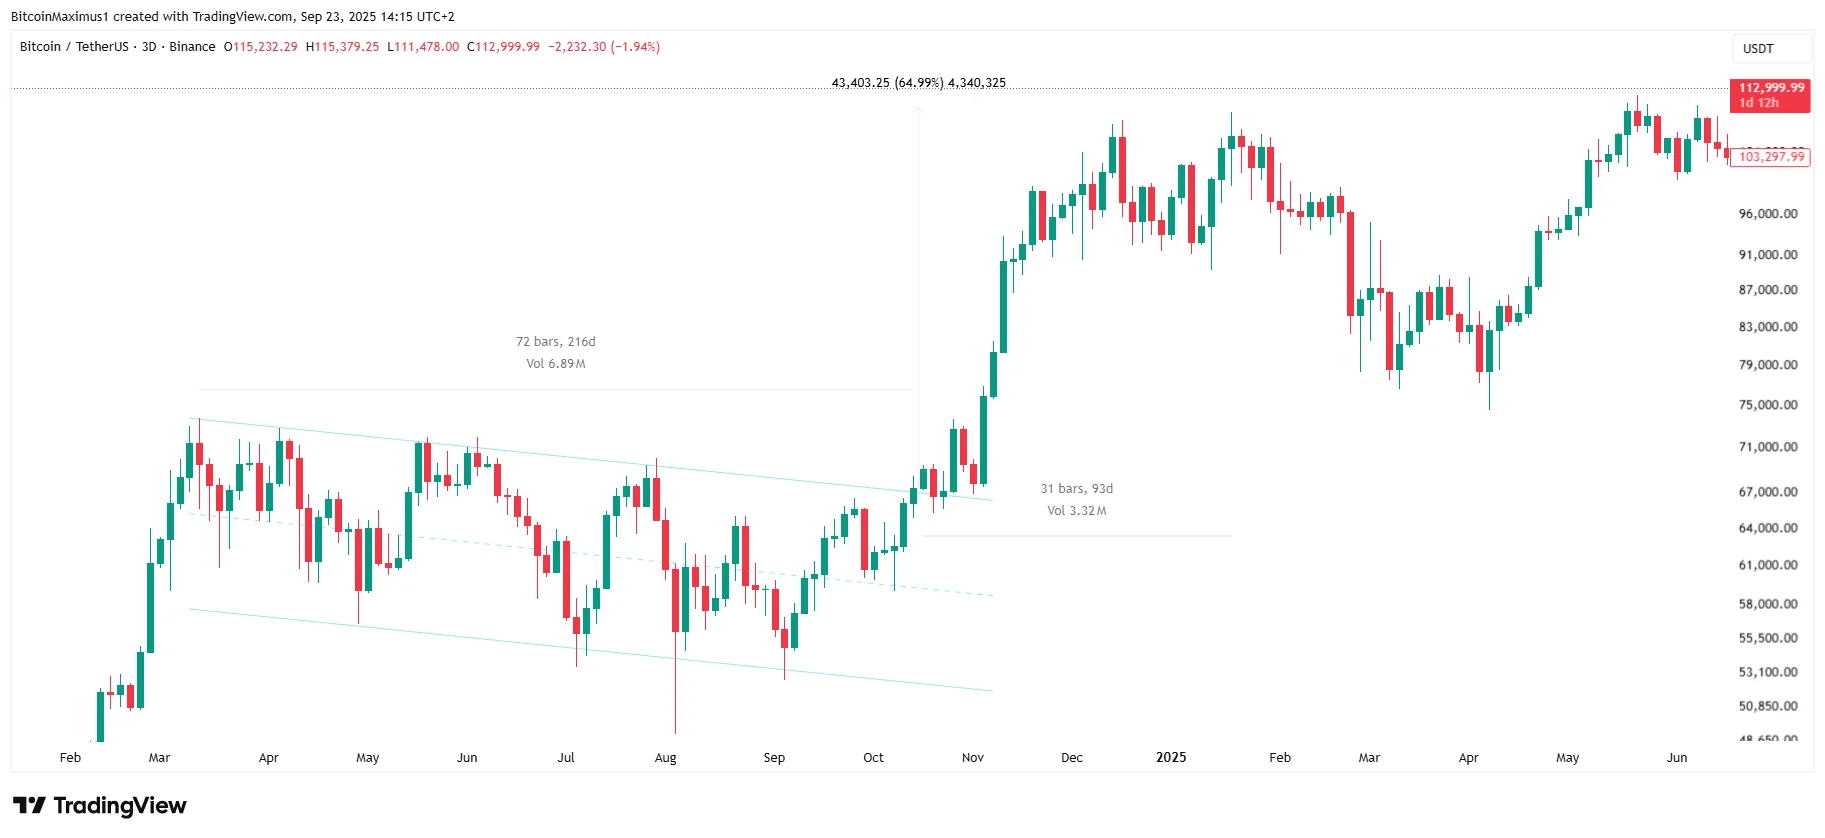
The next essential patterns we will cover will be the ascending and descending parallel channels.
These channels usually contain corrective movements, so descending parallel channels lead to breakouts, while ascending ones lead to breakdowns.
Hence, they are very similar to wedges, with the exception that the diagonal trend lines are parallel to each other instead of converging.
- BTC/USDT 3-Day Chart Credit: Valdrin Tahiri/TradingView
Unlike wedges, channels are also characterized by extremely choppy movement, where previous highs and lows are consistently removed.
One example of a long-term channel happened in Bitcoin between March and October 2024, containing the price movement for more than 210 days.
The breakout from the channel was explosive, similar to one from a long-term descending wedge, leading to a 65% rally that continued for 93 days.
On the other hand, Bitcoin created an ascending parallel channel between June and August 20222, which led to a massive breakdown that lasted several months.
Since the channel existed for a shorter time, the price retested it as resistance (red icon) before resuming its downward movement.
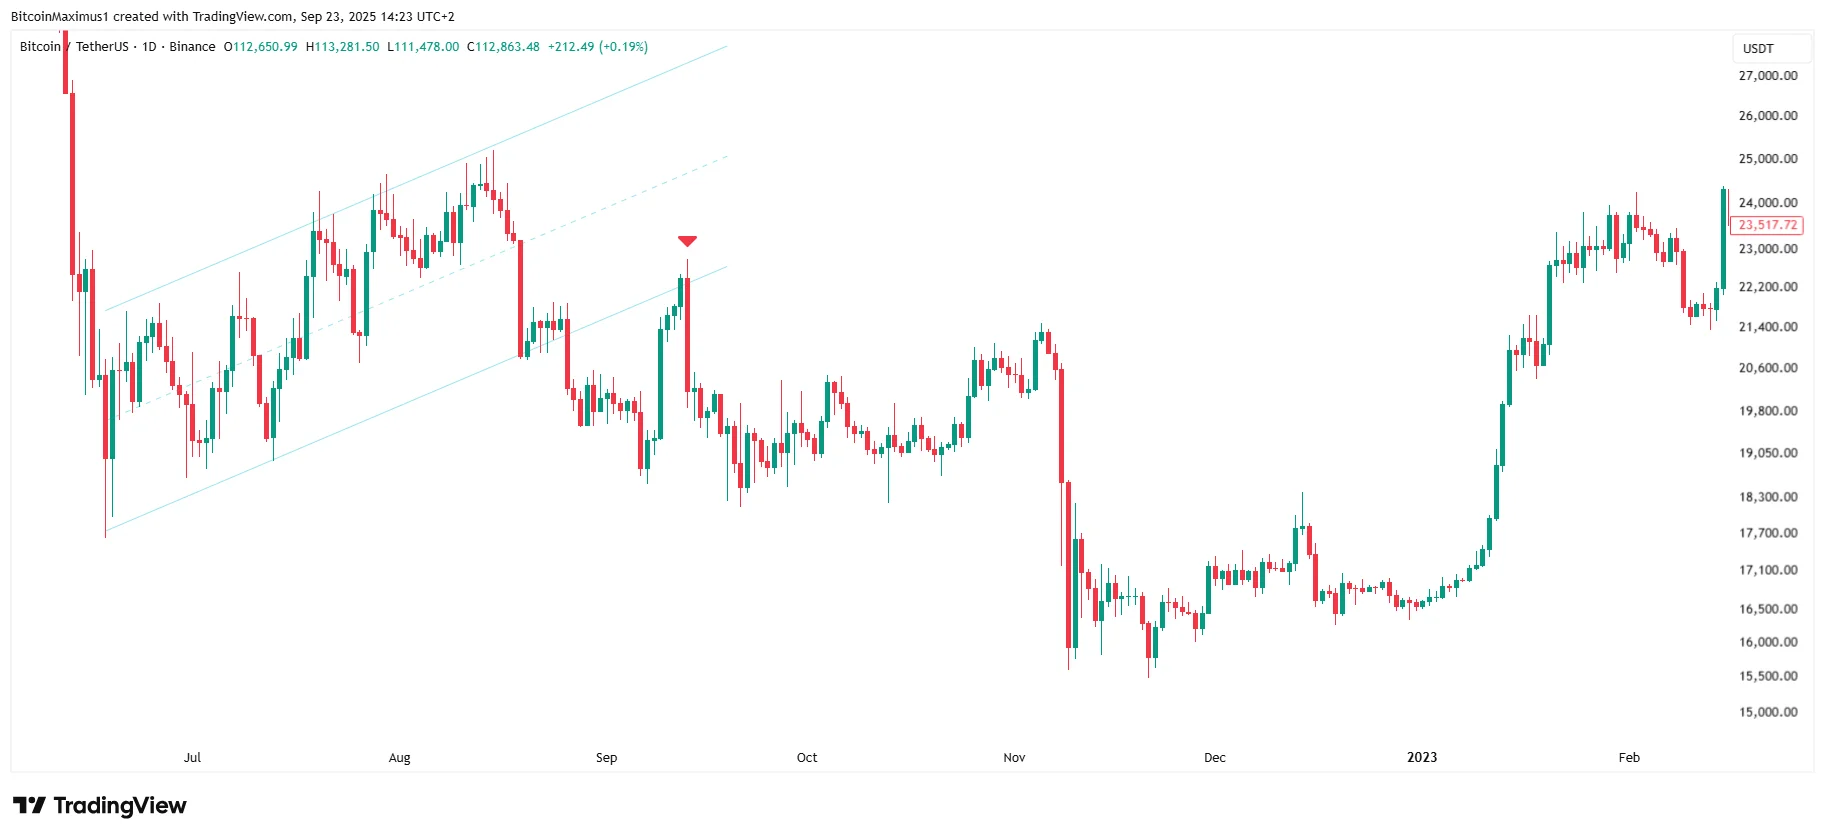
- BTC/USDT Daily Chart Credit: Valdrin Tahiri/TradingView
As with other patterns, long-term movements don’t often leave room for a retest, while short-term ones do.
In conclusion, channels and wedges are similar patterns that should be traded similarly. Their main differences are channel choppy movement and wedge converging trend lines.
How to Safely Trade Patterns
One practical tip for beginner technical analysts who trade patterns is to always buy near the support trend lines, especially if they ascend.
This allows you to cut losses if the price closes below the trend line and to move the stop loss in profit if the trend line is ascending.
The opposite is true when opening a short position. In that case, traders should target the price close to the resistance trend line.
While the price often moves the entire pattern’s height after a breakdown, this is not necessary.
Sometimes, the trend will reverse before the price reaches its maximum target; hence, taking profit at the 0.381 and 0.618 lengths of the pattern is a safer way to trade.
Candlestick Patterns
Single Candlestick Patterns
The final item analyzed will be the candlestick pattern, which is slightly more complicated than a regular pattern.
Starting with a single candlestick pattern, the first important one to note is the shooting star pattern.
The shooting star happens in an upward trend and often marks the top of the movement, leading to a bearish trend reversal.
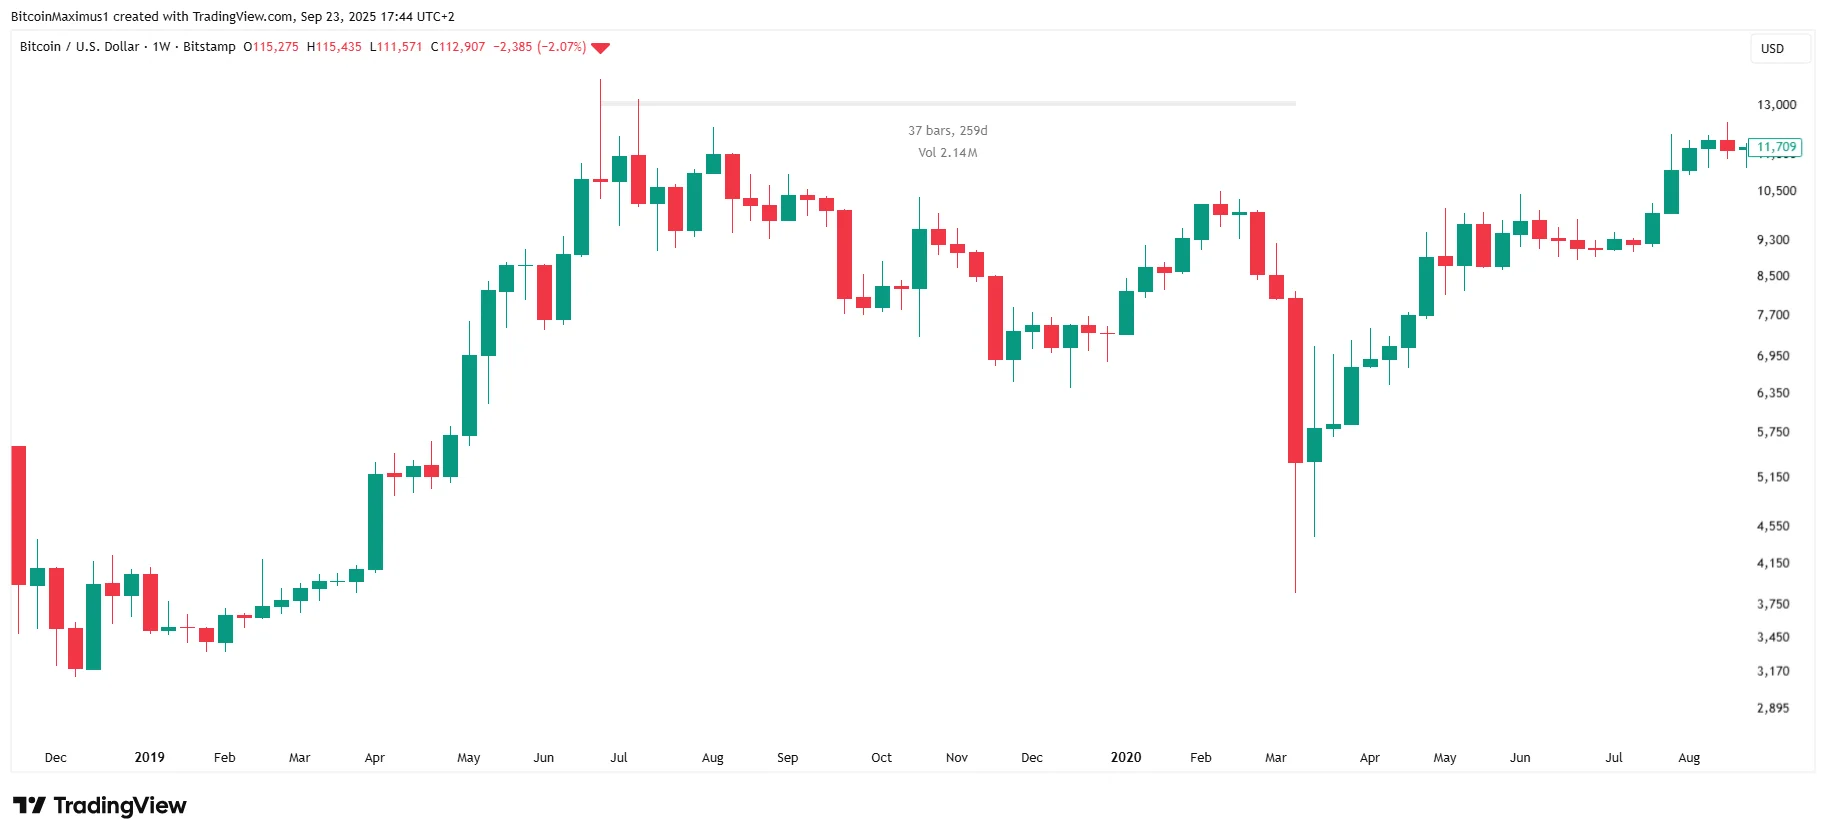
- BTC/USDT Weekly Chart | Credit: Valdrin Tahiri/TradingView
Following a six-month upward trend, one such pattern transpired in June 2019 (red icon).
The shooting star marked the top of the upward movement and catalyzed a 260-day bear market.
The opposite of a shooting star is a hammer candlestick, its mirror image.
The opposite of a shooting star is a hammer candlestick, its mirror image.

- BTC/USDT Weekly Chart | Credit: Valdrin Tahiri/TradingView
It creates the opposite price reaction, as noted by Bitcoin’s trend reversal in January 2024 (green icon).
The candlestick stopped a two-week decline, leading to a significant rally until April.
Multiple Candlestick Patterns
Slightly more complicated than single-pattern candlesticks are multiple-pattern ones.
The most common multiple candlestick patterns are the bullish and bearish engulfing candlesticks.
A bullish engulfing candlestick pattern occurs when the entire body of the previous candlestick is engulfed in the next one, hence the pattern’s name.
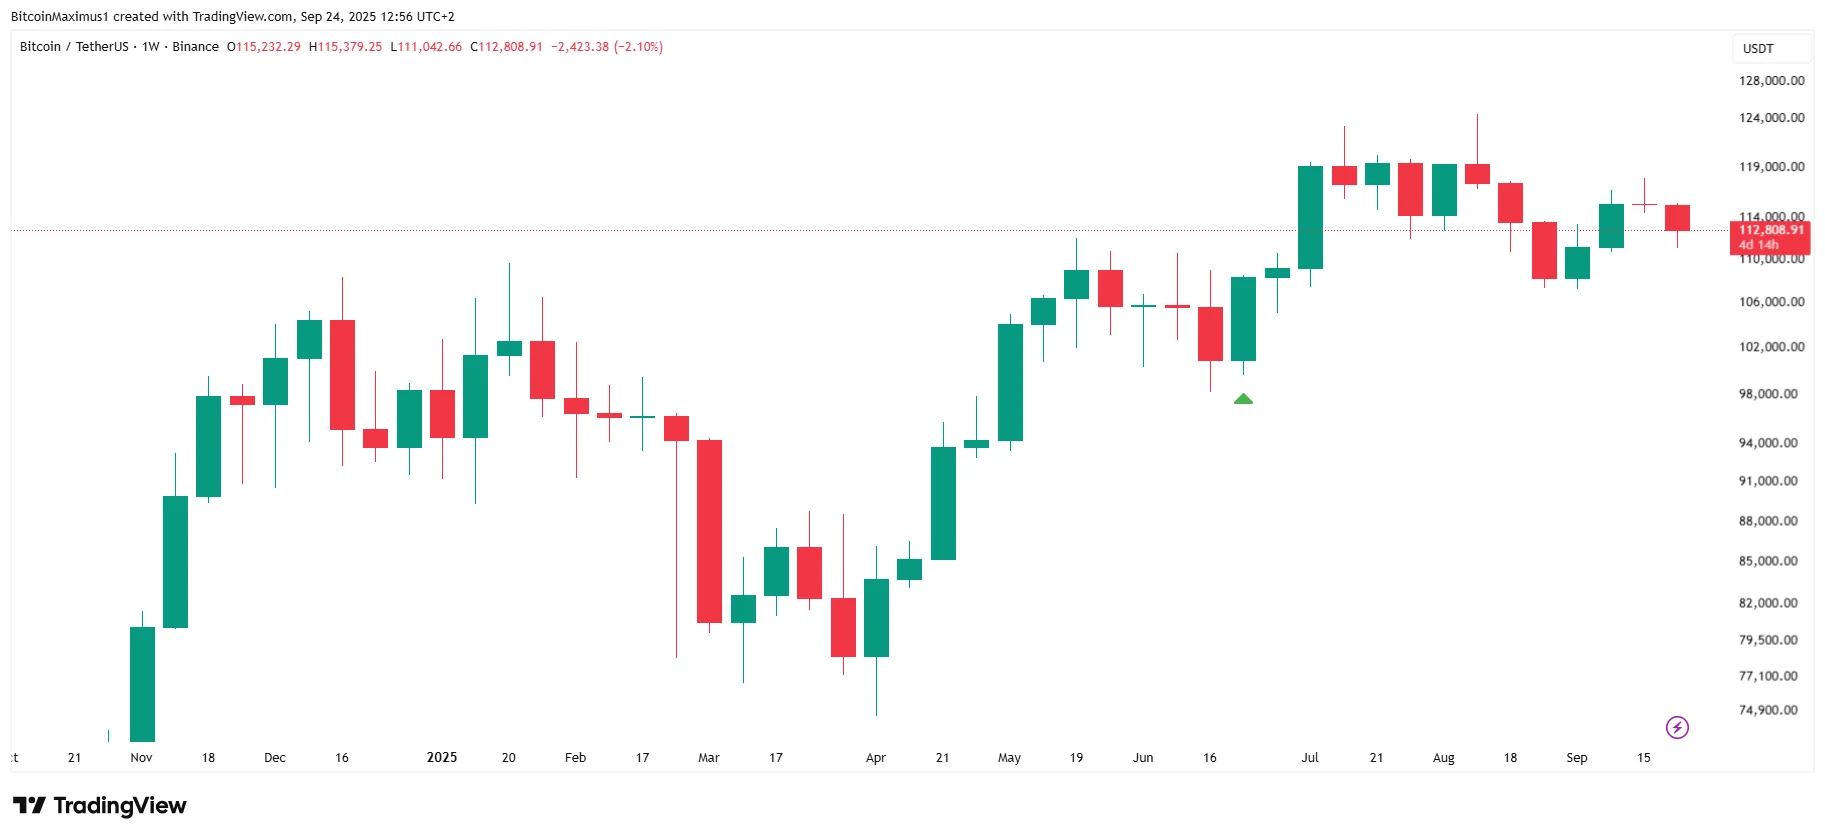
- BTC/USDT Weekly Chart | Credit: Valdrin Tahiri/TradingView
One such engulfing candlestick transpired in June 2025 (green icon), when Bitcoin ended a four-week decline with a strong bounce, triggering a two-month upward movement.
To confirm the pattern, the asset has to close above the opening price of the previous candlestick.
The mirror image of the bullish engulfing candlestick is the bearish engulfing one.
It is created the same way; however, it occurs after an upward movement instead of a downward one, leading to a bearish trend reversal.
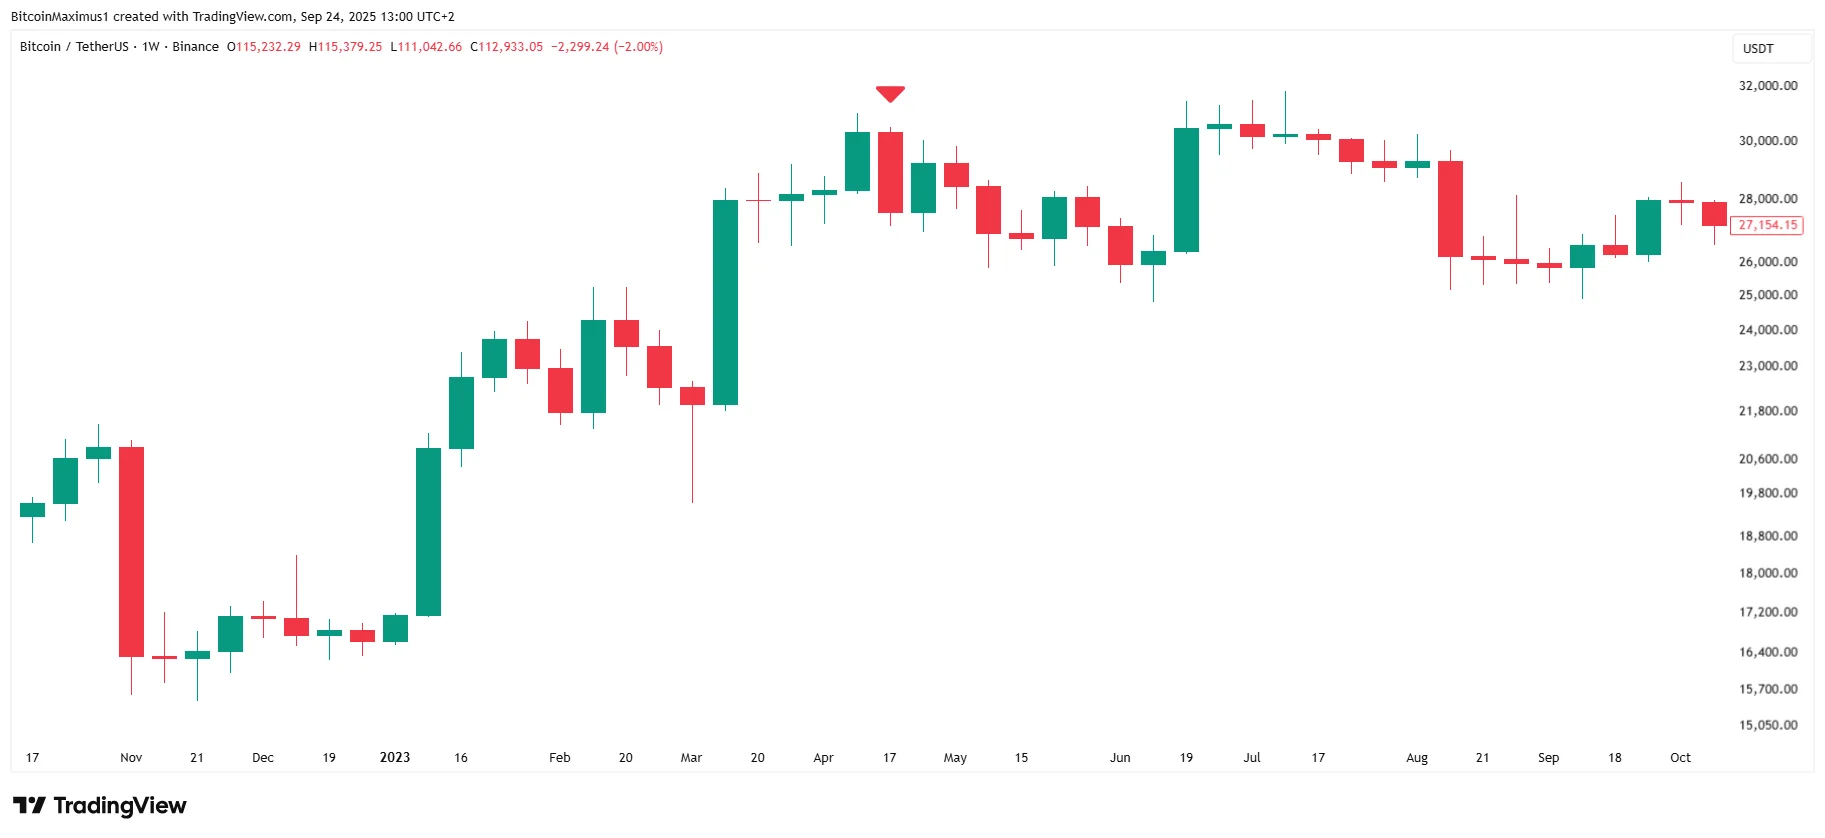
- BTC/USDT Weekly Chart | Credit: Valdrin Tahiri/TradingView
One such candlestick transpired in April 2023 (red icon), ending a four-month upward movement and leading to a two-month correction.
A Well-Rounded Trading Strategy
Technical analysis may seem complex at first glance, but it always comes back to a few key principles.
Horizontal levels remain the foundation, clarifying where the market will react. When support becomes resistance or vice versa, sharp moves often follow.
Breakouts and retests then serve as confirmations, adding confidence to trend continuation.
Patterns like triangles, wedges, and channels further refine this analysis, signaling whether markets are likely to break or reverse.
Meanwhile, candlestick formations provide short-term insights into buyer and seller sentiment, helping traders spot potential turning points.
By combining these elements, traders can create a well-rounded strategy that balances patience, risk management, and timing.
The information provided in this article is for informational purposes only. It is not intended to be, nor should it be construed as, financial advice. We do not make any warranties regarding the completeness, reliability, or accuracy of this information. All investments involve risk, and past performance does not guarantee future results. We recommend consulting a financial advisor before making any investment decisions.

Valdrin Tahiri is a cryptocurrency analyst and reporter at CCN, specializing in technical analysis with a focus on Elliott Wave theory, on-chain metrics, and fundamental research. He brings over seven years of experience in the crypto space as both a trader and writer.
He discovered cryptocurrencies in 2017 while earning his MSc in Financial Markets at the Barcelona School of Economics, which sparked a deep interest in blockchain and market dynamics. Since then, he’s contributed to top crypto outlets like BeInCrypto and CoinGape.
Valdrin also served as Community Manager of BeInCrypto’s Telegram group for three years, helping grow it into one of the largest crypto communities worldwide. His expertise in market structure and price patterns allows him to break down complex trends into clear, actionable insights.
He’s published thousands of articles covering altcoins, Bitcoin cycles, and macro trends.