Bold 2025 Bitcoin targets, from $170K to $2M, missed the mark. Here’s how Wall Street and crypto’s biggest names got their forecasts wrong. | Credit: Derek Fenech
Share
Key Takeaways
Bitcoin’s $24,000 print on Binance’s USD1-BTC pair on Christmas Day 2025 was a flash anomaly, not a global market crash.
No one can accurately predict Bitcoin’s exact year-end price, not even AI models. Instead, a scenario-based approach offers the most realistic outlook.
Bitcoin now behaves like a major macro asset, with strong correlations to the Nasdaq, S&P 500, and global risk sentiment.
ChatGPT provides four macro scenarios that shape the possible year-end outcomes, ranging from a liquidity-driven rally to a stress scenario.
Speculating about Bitcoin’s future price has become a global hobby, ranging from severe institutional forecasting to late-night Reddit roulette. As 2025 draws to a close, the question dominating crypto conversations is simple but loaded: What will Bitcoin’s price be on Dec. 31?
That question gained fresh urgency on Christmas Day 2025, when Bitcoin briefly appeared to crash to $24,000 on Binance’s USD1-BTC pair, despite trading near $87,000–$88,000 across the broader market. The momentary shock underscored just how misleading isolated price prints can be in today’s fragmented, liquidity-driven crypto landscape.
You might expect an AI like ChatGPT to spit out a precise number, such as $78,522.19 or $104,331.03. But the real story is much more interesting. Predicting Bitcoin requires understanding global liquidity, central bank policy, market psychology, and structural shifts in adoption.
And once you factor all of that in, the prediction becomes far less about a number and more about a range of possible futures.
This article breaks down how ChatGPT approaches the question, not by making impossible guarantees, but by examining the forces most likely to shape Bitcoin’s price into year’s end. And the final prediction is not what most people expect.
Why Predicting Bitcoin’s Exact Price Is Impossible
Before delving into the analysis, we must address the elephant in the room: no model, no AI, and no hedge fund can accurately predict Bitcoin’s short-term price with absolute precision.
Bitcoin’s price is the product of a complex ecosystem:
Macro liquidity conditions (interest rates, global yields, inflation trends).
Expecting a single number is like asking for tomorrow’s exact temperature down to the decimal, except the weather is controlled by hundreds of central banks, thousands of institutions, millions of traders, and unpredictable political events.
We sometimes use affiliate links in our content, when clicking on those we might receive a commission at no extra cost to you. By using this website you agree to our terms and conditions and privacy policy.
Binance’s USD1-BTC Pair and the $24,000 Flash Crash: Why Short-Term Bitcoin Prices Can Mislead
On Christmas Day 2025, Bitcoin briefly appeared to collapse to around $24,000 on Binance’s USD1-BTC trading pair, sparking confusion and alarm across social media. At face value, the move looked like a catastrophic market breakdown. In reality, it was a pair-specific flash event, not a genuine collapse in Bitcoin’s global price.
During the incident, Bitcoin continued trading near its prevailing market range across major exchanges and dominant pairs such as BTC/USDT and BTC/USD. The sharp dip was isolated to the USD1-BTC order book, suggesting thin liquidity, order-book imbalances, or sudden large transfers rather than a systemic repricing of Bitcoin itself.
According to 0xNobler (@CryptoNobler), large transfers of USD1 and BTC to Binance occurred shortly before the flash drop, and certain on-chain balances reportedly increased shortly afterward. These claims remain unverified, but they reinforce a well-known structural reality of crypto markets: price anomalies on low-liquidity or newly introduced pairs can produce extreme prints that do not reflect true market consensus.
Events like this highlight why Bitcoin’s short-term price cannot be interpreted in isolation. Exchange-level mechanics, leverage, liquidation engines, and liquidity depth can temporarily distort prices without changing Bitcoin’s broader macro trajectory. For long-term analysis, these flashes are better understood as market noise, not signals of a fundamental shift.
🚨 BREAKING
WINTERMUTE WAS SENDING BILLIONS OF USD1 AND $BTC TO BINANCE RIGHT BEFORE BITCOIN CRASHED TO $24,000.
THEIR ON-CHAIN BALANCE ALSO SUDDENLY JUMPED BY ≈$102 MILLION RIGHT AFTER THE EVENT.
Also, please note that the BTC price on major exchanges and aggregated market prices stayed near $87 000–$88 000 during the event. In a maturing, institutionally influenced market, Bitcoin’s true direction continues to be dictated by global liquidity conditions, risk sentiment, and macroeconomic policy, not by fleeting anomalies on a single trading pair.
New all-time highs reached after ETF flows and halving cycle.
Key Factors That Will Determine Bitcoin’s Price by December 2025
After analyzing historical data, macro conditions, and current market structure, three variables stand out as the most influential. And they’re not the ones most beginner investors focus on.
1. Global Liquidity: Bitcoin’s True Master
Despite narratives about halvings, hash rate, digital scarcity, or “macro independence,” Bitcoin’s price increasingly follows one indicator: the amount of cheap money in the global financial system.
When central banks:
Cut rates
Buy bonds
Expand balance sheets
Bitcoin rises faster than almost any other asset.
When central banks tighten, as seen in late 2025, Bitcoin becomes the first casualty of higher funding costs.
This means the single most important factor for Bitcoin’s Dec. 31 price is:
What will the Federal Reserve, the European Central Bank, and especially the Bank of Japan do between now and year’s end?
2. Bitcoin’s Institutional Integration
As institutional adoption has grown, so has Bitcoin’s correlation with traditional markets:
Bitcoin is no longer the “independent rebel asset” it once was. It now behaves like a high-beta macro asset, meaning it amplifies the movements of risk markets.
Crypto is part math, part human emotion. And right now the market is balancing:
Optimism about long-term adoption.
Fear from recent macro-driven crashes.
Excitement about innovations like L2s, real-world assets, and AI-driven blockchains.
Caution about regulation and geopolitics.
Behavioral cycles tend to follow patterns: start with panic, then move to stabilization, then boredom and confidence, then FOMO and euphoria and finally panic again.
Where Bitcoin sits in this cycle at year’s end will heavily influence price.
Bitcoin Price Prediction for Dec. 31: Four Possible Scenarios
ChatGPT’s prediction is based on these four macro-financial scenarios. One of them is much more likely than the others.
The Bank of Japan pauses or reverses hawkish signals.
Inflation continues to cool.
Global bond yields fall.
Risk appetite returns.
Under these conditions, global liquidity expands. Bitcoin, being the highest-beta asset linked to liquidity, moves fastest and farthest.
In this scenario, year-end FOMO could push Bitcoin to new highs.
Why this scenario matters: markets are forward-looking. If traders believe easier money is coming in early 2026, Bitcoin could rally hard even before cuts actually happen.
Scenario 2: Central Banks Hold Steady and Bitcoin Stabilizes
This creates a sideways yet slightly bullish environment.
Bitcoin grinds upward slowly, driven by fundamentals and steady accumulation, though major breakouts are unlikely.
Why this scenario is most likely: central banks prefer stability. With inflation cooling but not eliminated, they’re incentivized to avoid major moves.
Scenario 3: Central Banks Tighten and Bitcoin Drops Further
Bitcoin Price – So What Does ChatGPT Predict for Dec. 31?
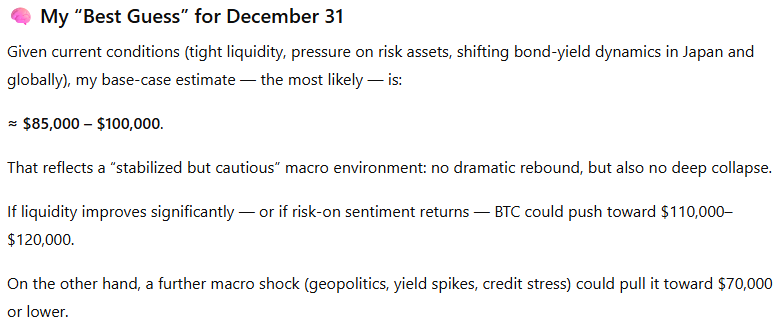
Given all available data, the macro environment, and the probability-weighted scenarios, ChatGPT’s forecast a Bitcoin price of $88,000-$98,000 by Dec. 31, with extreme outliers above $120,000 or below $70,000 depending on macro shocks.
This prediction might surprise people expecting a dramatic bull run or an apocalyptic crash. But the most likely outcome is that Bitcoin ends the year:
Strong but not euphoric.
Recovering but not exploding.
Stable despite macro volatility.
This is consistent with a maturing asset increasingly tied to institutional money.
ChatGPT response. | Credit: ChatGPT
Why Bitcoin No Longer Moves Independently: The End of Crypto Isolation
The biggest takeaway from this analysis isn’t the prediction itself—it’s the shift in Bitcoin’s identity.
Understanding this helps investors avoid emotional reactions and simplistic narratives.
Bitcoin does not respond to halvings alone. Bitcoin does not move independently of global finance. And Bitcoin does not rise strictly because of adoption metrics. It moves with the cost of money.
What Bitcoin’s Year-End Price Really Depends On
Predicting Bitcoin’s December 31st price is less about guessing and more about understanding the forces that move markets.
While nobody can predict the future with certainty, the scenario-based method provides a realistic framework:
Watch the Bank of Japan.
Track global bond yields.
Monitor ETF inflows.
Pay attention to liquidity conditions.
Expect volatility, not clarity.
Bitcoin lives at the intersection of macroeconomics and digital innovation. And its future, year-end or otherwise, belongs to those who understand both.
Can anyone accurately predict Bitcoin’s exact price on Dec. 31?
No. Bitcoin’s short-term price is influenced by hundreds of unpredictable variables, including macroeconomic conditions, central bank decisions, institutional flows, geopolitical events, and market psychology. Because of this complexity, no model, analyst, or AI can deliver an exact number with certainty, only probability-based scenarios.
Why does ChatGPT avoid giving a single Bitcoin price prediction?
ChatGPT avoids single-number guesses because they create a false sense of certainty. Instead, it uses scenario-based forecasting, analyzing factors like liquidity, interest rates, and investor behavior. This approach provides a realistic price range rather than an arbitrary number.
What is the biggest factor influencing Bitcoin’s price heading into the end of 2025?
Global liquidity. When central banks keep money cheap (low rates, small yields, bond buying), Bitcoin tends to rise sharply. When liquidity tightens (high rates, rising yields, monetary tightening), Bitcoin usually drops first. Liquidity has historically been the #1 driver of Bitcoin’s large moves.
Why is the Bank of Japan suddenly important to Bitcoin’s price?
Because Japan’s monetary system fuels a major global carry trade. When Japanese yields rise or the BoJ signals hawkishness, this carry trade unwinds, draining liquidity from global markets. Bitcoin, being a high-beta risk asset, reacts quickly to these liquidity shocks.
Did Bitcoin really crash to $24,000 on Christmas Day 2025?
No. Bitcoin briefly traded near $24,000 on Binance’s USD1-BTC pair, but prices across major exchanges and aggregated market indices remained near $87,000–$88,000. The event was a pair-specific flash anomaly, not a market-wide collapse.
Disclaimer:
The information provided in this article is for informational purposes only. It is not intended to be, nor should it be construed as, financial advice. We do not make any warranties regarding the completeness, reliability, or accuracy of this information. All investments involve risk, and past performance does not guarantee future results. We recommend consulting a financial advisor before making any investment decisions.
Giuseppe Ciccomascolo began his career as an investigative journalist in Italy, where he contributed to both local and national newspapers, focusing on various financial sectors.
Upon relocating to London, he worked as an analyst for Fitch's CapitalStructure and later as a Senior Reporter for Alliance News. In 2017, Giuseppe transitioned to covering cryptocurrency-related news, producing documentaries and articles on Bitcoin and other emerging digital currencies. He also played a pivotal role in establishing the academy for a cryptocurrency exchange website. Crypto remained his primary area of interest throughout his tenure as a writer for ThirdFloor.


 Easy
Easy