We sometimes use affiliate links in our content, when clicking on those we might receive a commission at no extra cost to you. By using this website you agree to our terms and conditions and privacy policy.
Analyst Nick believes that this has caused a sell-off in risk assets and a rally in safe havens.
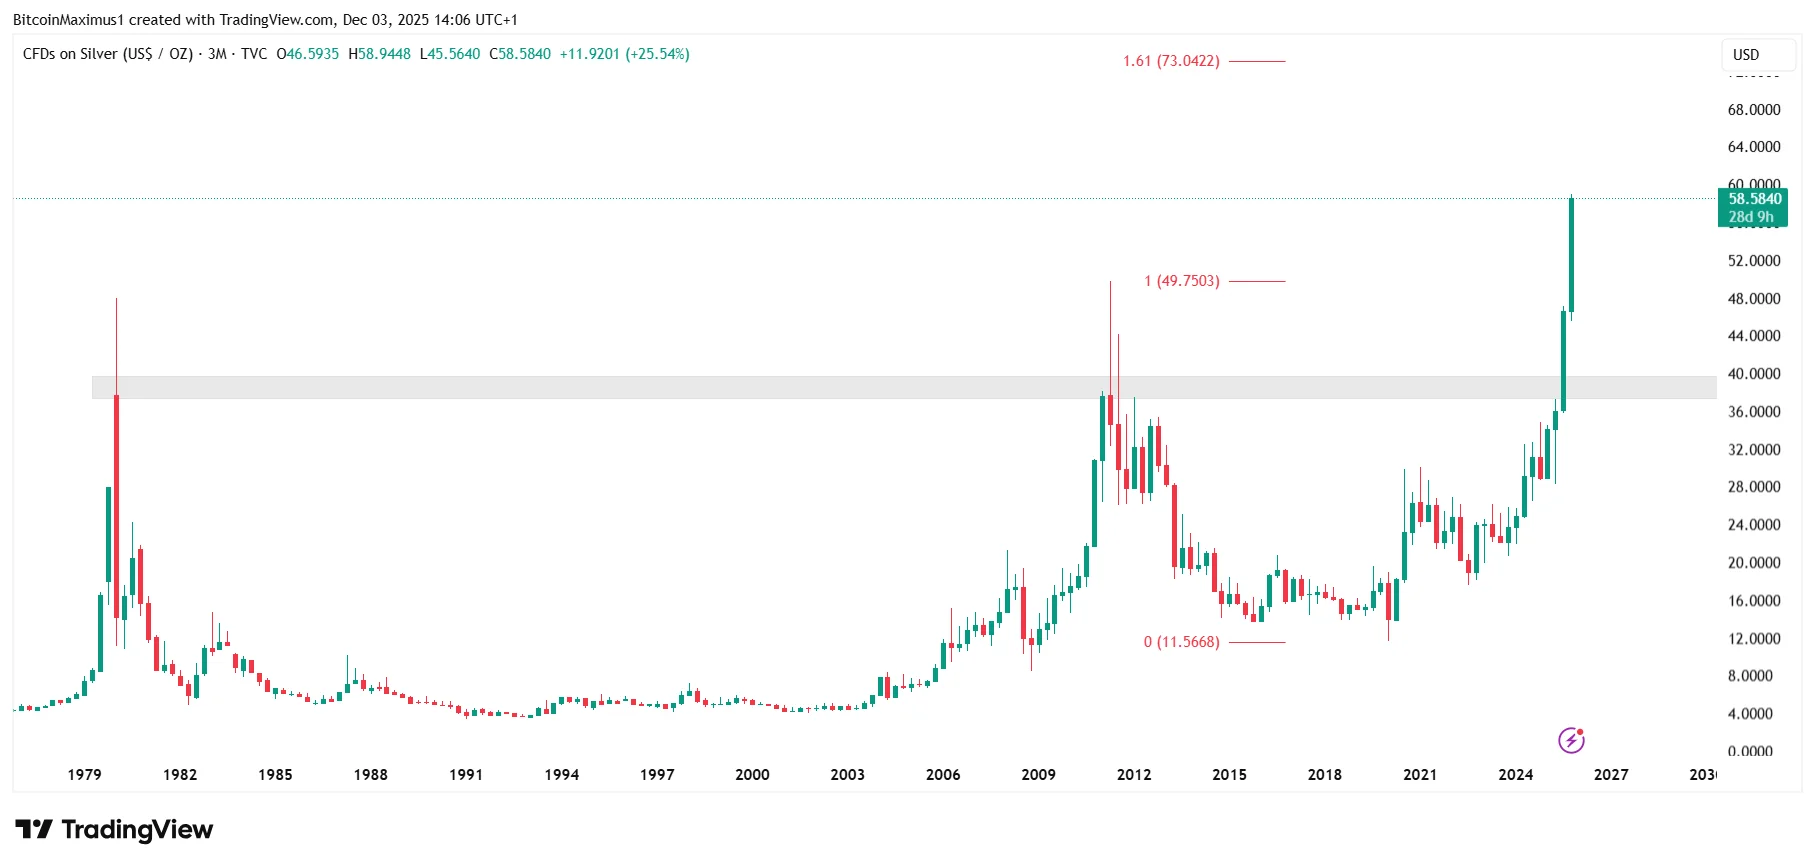
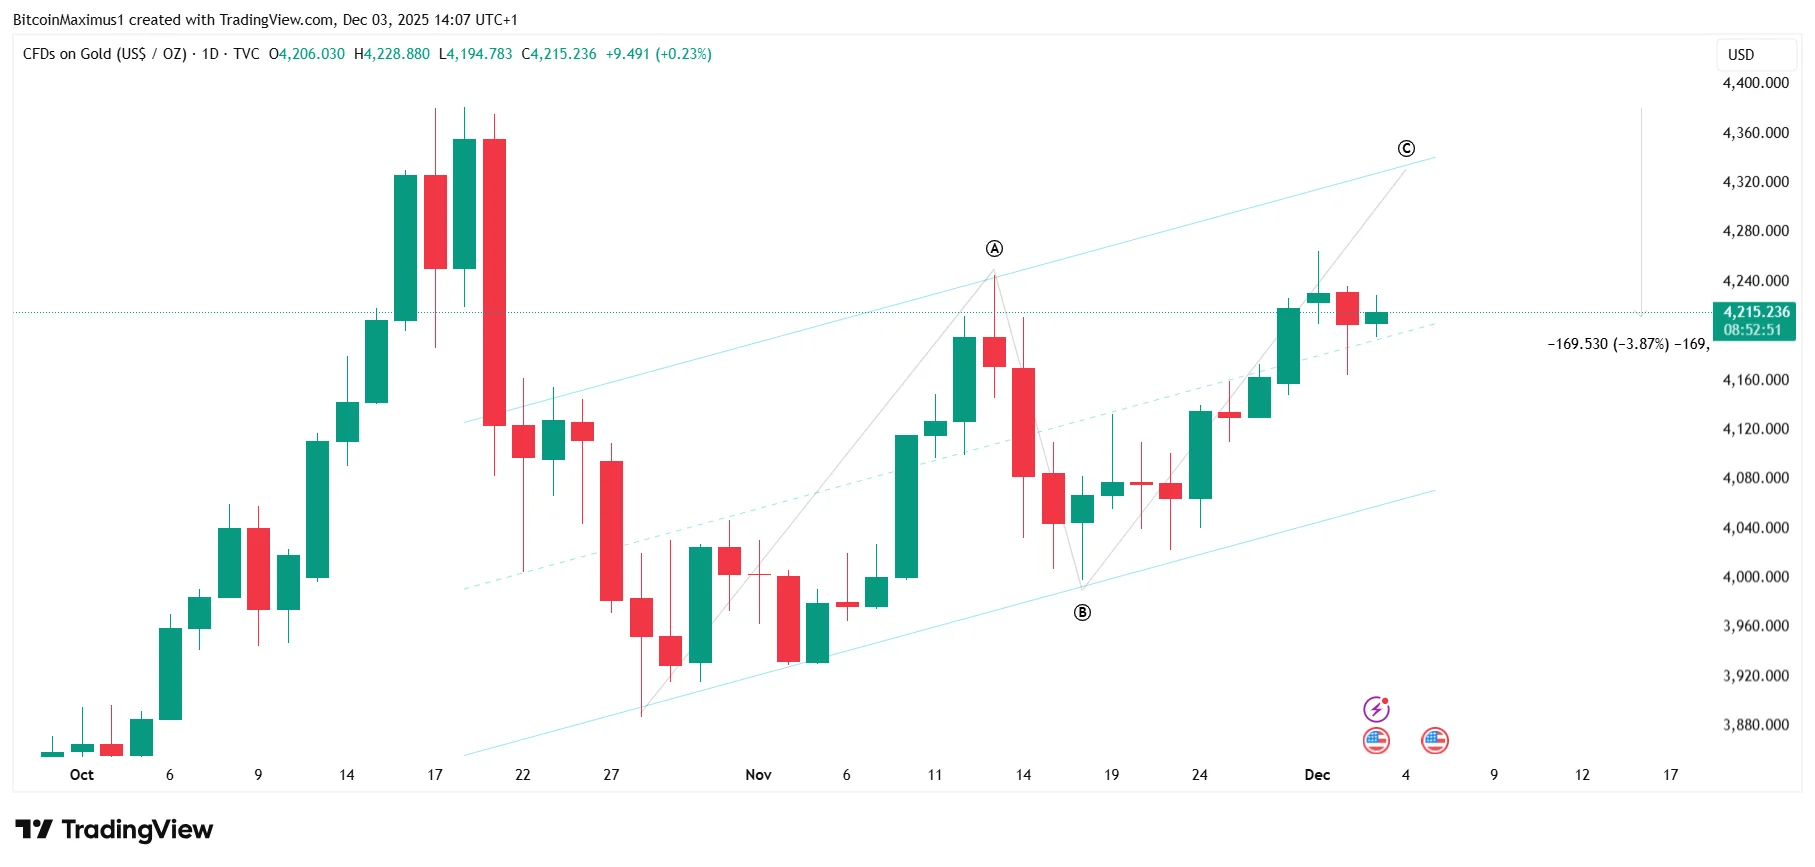
An increase in Japanese base rates & strengthening of Yen leads to an unwind of the carry trade (borrowing in Yen, buying risk assets). Hence the reason for the selloff in risk assets (Bitcoin, stock futures etc.) & the rally in safe havens (Gold) he stated.
The violent unwind of the Yen carry trade could have massive repercussions for the bond market, especially when combined with the end of quantitative tightening.
Japan is one of the largest buyers of U.S. debt, so its stepping back could be catastrophic.
THE CHART THAT SHOULD TERRIFY EVERY PORTFOLIO MANAGER ON EARTH
Japan’s 10 Year Government Bond Yield just hit 1.84%.
Disclaimer:
The information provided in this article is for informational purposes only. It is not intended to be, nor should it be construed as, financial advice. We do not make any warranties regarding the completeness, reliability, or accuracy of this information. All investments involve risk, and past performance does not guarantee future results. We recommend consulting a financial advisor before making any investment decisions.
Valdrin Tahiri is a cryptocurrency analyst and reporter at CCN, specializing in technical analysis with a focus on Elliott Wave theory, on-chain metrics, and fundamental research. He brings over seven years of experience in the crypto space as both a trader and writer.
He discovered cryptocurrencies in 2017 while earning his MSc in Financial Markets at the Barcelona School of Economics, which sparked a deep interest in blockchain and market dynamics. Since then, he’s contributed to top crypto outlets like BeInCrypto and CoinGape.
Valdrin also served as Community Manager of BeInCrypto’s Telegram group for three years, helping grow it into one of the largest crypto communities worldwide. His expertise in market structure and price patterns allows him to break down complex trends into clear, actionable insights.
He’s published thousands of articles covering altcoins, Bitcoin cycles, and macro trends.