ChatGPT’s 2026 Crypto Price Forecast: Bitcoin, ETH, SOL, XRP & BNB Bear, Base and Bull Scenarios
Share
Key Takeaways
Bitcoin has recently shown elevated volatility, with wide intraday ranges and rising volatility index readings.
The $80,000 level is both a psychological marker and a technical threshold below several established support zones.
A drop under $80,000 would likely require multiple converging factors, including macroeconomic shifts, technical breakdowns, leverage unwinds, or notable changes in holder behavior.
Structural elements, such as institutional participation, long-term holder accumulation, and production-cost dynamics, continue to offer underlying support for Bitcoin’s market stability.
As the world’s largest cryptocurrency by market value, Bitcoin’s movements often reflect broader market conditions, including liquidity trends, macroeconomic pressures, and shifts in trader and holder behavior.
CCN asked ChatGPT to examine this specific scenario, reflecting wider interest in how Bitcoin’s current environment fits into the broader structure of market risk and support levels.
Bitcoin Price Volatility Increases as Market Tests Key Support Levels
Bitcoin has been trading within a wide range after reaching new highs earlier in the year. For example, the asset recently traded near $89,234, with an intraday range fluctuating between approximately $88,549 and $93,347.
Around the same period, market commentary noted that Bitcoin had fallen below $96,000 and was trading in the mid-$90,000 range, showing continued pressure across several short-term levels.
This environment reflects a market still adjusting to earlier rapid gains, including peaks above $120,000, as well as shifts in expectations surrounding global monetary policy and ongoing changes in derivatives positioning.
While Bitcoin has remained above major long-term support levels, such as the $83,000–$84,000 region identified by several analysts, the market continues to test intermediate zones in the $90,000–$95,000 range as traders reassess overall risk.
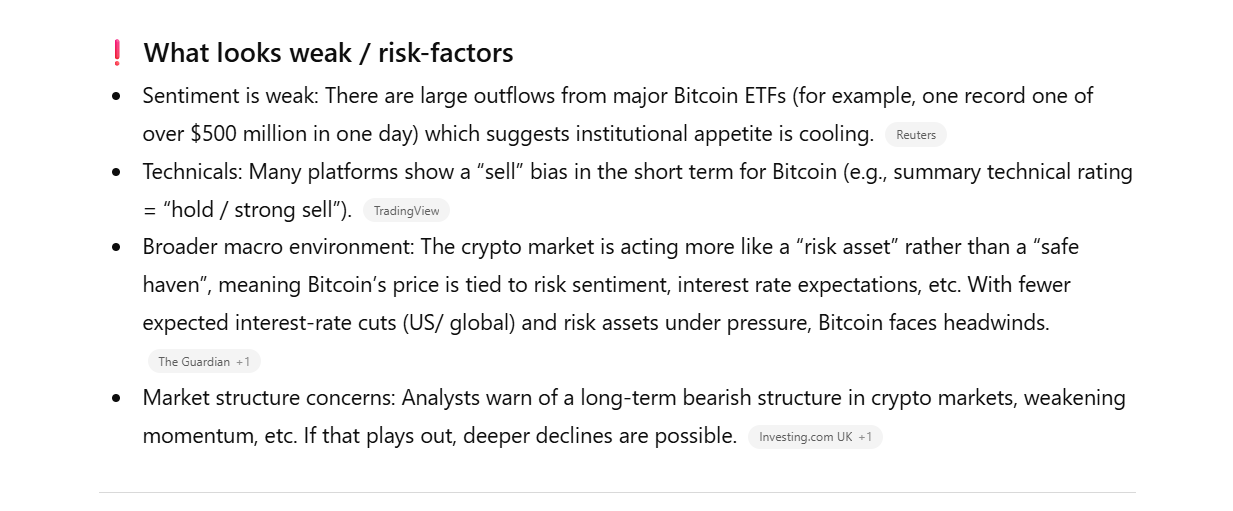
Bitcoin price risk factors. | Source: ChatGPT
What a Drop Below $80,000 Would Mean for Bitcoin’s Market Structure
The $80,000 price mark has become an important psychological and technical reference point. It is below several widely tracked support zones, including those associated with significant previous consolidation ranges.
A move toward or under this level would indicate that Bitcoin had broken through multiple layers of support, suggesting a meaningful shift in market structure.
From a technical standpoint, such a move would reflect sustained downward pressure rather than routine price noise. It would also imply that selling activity had outweighed demand across several consecutive chart levels.
Key Factors That Could Push Bitcoin Toward the $80,000 Level
A decline below $80,000 would likely require a combination of identifiable factors. The following conditions are among those most often associated with periods of price weakness in Bitcoin:
1. Macroeconomic Influence
Macroeconomic conditions play a key role in risk-asset behavior. When expectations shift toward tighter monetary policies or slower economic growth, risk-sensitive markets often see declining demand.
Bitcoin has historically shown sensitivity to broader financial conditions, particularly when rate expectations change or when liquidity levels in traditional markets contract.
2. Technical Breakdown of Support Levels
Bitcoin’s movement often aligns with chart patterns and support zones observed by traders. If the asset falls through major support levels around the mid-$90,000 or low-$90,000 range, additional downward pressure can follow.
Technical breakdowns often trigger automated selling, stop-loss activations, and changes in positioning by short-term market participants.
3. Changes in Holder Behavior
Large holders, long-term investors and entities with significant on-chain balances influence market structure when they shift their activity.
If long-held coins begin moving to exchanges or if older wallets reduce holdings during volatile periods, it can increase short-term supply in the market. Such behavior can coincide with broader market corrections.
4. Leverage and Liquidations
Bitcoin markets include substantial leveraged trading through derivatives and futures. When price declines reach certain thresholds, forced liquidations can occur, accelerating downward movement.
This mechanic has contributed to several past corrections and remains an important element of Bitcoin’s volatility profile.
Factors That Can Support Bitcoin Above $80,000
While downward pressures exist, several structural elements also help support Bitcoin’s price stability:
1. Institutional Participation
Over recent years, institutional involvement has expanded through investment products, custodial services, and corporate allocations.
This has added depth to the market and has historically reduced the probability of extreme declines during non-crisis periods.
2. Long-Term Holder Accumulation
On-chain analysis frequently shows long-term holders accumulating during pullbacks rather than selling.
This behavior typically reduces available supply and can provide support during periods of heightened volatility.
3. Production and Mining Costs
While mining cost is not a guaranteed support level, it has historically played a role in market stability. Production costs reflect energy prices, hardware efficiency, and network difficulty.
When market prices approach these levels, miners have historically adjusted operations, influencing supply dynamics.
4. Broader Market Maturity
Today’s Bitcoin market includes regulated exchanges, structured financial products, and significant participation from professional trading firms.
What Bitcoin Price Falling Below $80,000 Would Indicate
If Bitcoin were to move below $80,000, it would indicate that multiple technical levels had failed and that selling momentum had exceeded buyer interest across key price zones.
It would also reflect shifting trader sentiment, structural adjustments in leveraged markets, or broader macroeconomic stress.
A move to this level would not imply long-term directional changes on its own. Instead, it would reflect short-to-medium-term conditions and the balance between supply and demand during a particular phase of the market cycle.
Limitations and Risks of Using ChatGPT for Bitcoin Price Analysis
ChatGPT can help interpret publicly observable market conditions, but it has important limitations when applied to Bitcoin price analysis. The model does not predict future price movements and cannot access real-time trading data, on-chain activity, or confidential market signals.
Its responses rely on patterns in historical information, which means it may overlook sudden market shocks, liquidity events, or rapid sentiment changes.
ChatGPT also cannot replace professional financial judgment or technical expertise. Because Bitcoin is highly volatile and influenced by complex global factors, any analysis generated by an AI model should be interpreted cautiously and viewed as informational only.
Is a Bitcoin Price Crash Below $80,000 Likely?
The question of whether Bitcoin could fall below $80,000 depends on a combination of market structure, macroeconomic conditions, technical indicators, and investor behavior.
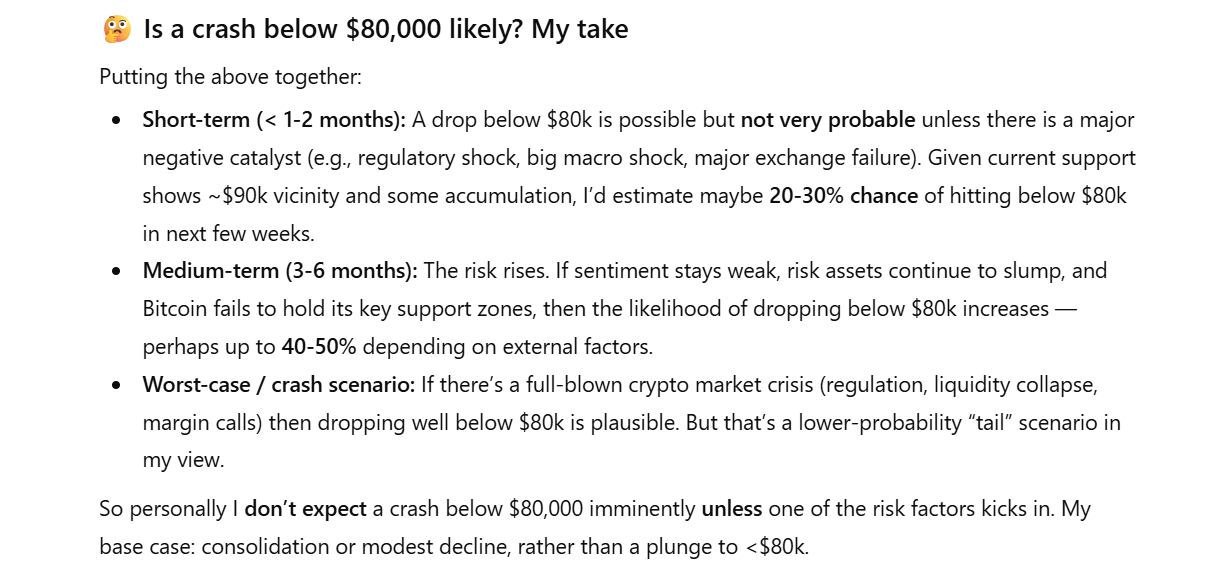
Is a crash below $80,000 likely? ChatGPT’s take
While this level sits below important support zones, understanding the mechanics behind price movements is essential to interpreting any potential decline.
Bitcoin’s market remains influenced by global financial conditions, liquidity cycles, on-chain activity, and derivatives dynamics, all of which play a role in shaping its price trajectory.
Remember that this article is intended for informational purposes only and reflects current publicly observable market conditions without speculation or predictions.
A decline below $80,000 would likely result from several overlapping factors, such as tighter global monetary policy, breakdown of major support levels, increased sell-offs by large holders, or leverage-driven liquidations. No single indicator determines this outcome; rather, it is the combination of market pressures that matters.
Is $80,000 considered a major support level for Bitcoin?
The $80,000 mark sits below multiple widely observed support zones, making it more of a psychological and structural reference point than a primary support level. Breaking below it would suggest that several important technical areas had already weakened.
Does falling under $80,000 mean Bitcoin is entering a long-term downtrend?
Not necessarily. A move under $80,000 would reflect short-term or mid-term pressures, such as liquidity changes or market sentiment shifts. Long-term trends depend on broader macroeconomic conditions, adoption patterns, and supply-demand dynamics.
Can market structure prevent Bitcoin from declining further?
Several structural factors can help stabilize price, including institutional participation, long-term holder activity, and mining-related production costs. These elements do not guarantee price outcomes, but they have historically helped limit extreme downside during non-crisis periods.
Disclaimer:
The information provided in this article is for informational purposes only. It is not intended to be, nor should it be construed as, financial advice. We do not make any warranties regarding the completeness, reliability, or accuracy of this information. All investments involve risk, and past performance does not guarantee future results. We recommend consulting a financial advisor before making any investment decisions.
Dr. Guneet Kaur is a senior editor at CCN.com and a Science Fellow at Exponential Science. She is a fintech and blockchain expert with extensive experience in digital finance education, blockchain ecosystems, and cryptocurrency markets. She has worked with global media such as Cointelegraph, as well as education and blockchain platforms, to design and lead strategic content and learning initiatives. As an educator and assessor for top-tier executive programs, she bridges real-world fintech trends with academic insight.
Dr. Kaur is also a published researcher and peer reviewer across fintech and data science journals, including Financial Innovation Journal and International Journal of Big Data Intelligence and Applications. Her work spans data-driven analysis, Web3 innovation, and technical content development. With a strong foundation in both industry and academia, she translates complex financial technologies into practical applications, empowering learners, professionals, and institutions across the rapidly evolving digital finance landscape.


 Easy
Easy