Home / Education / Crypto / Trading / Bitcoin Price Is at a Volatility Floor Seen Only 1% of the Time — Why You Shouldn’t Ignore This “Coiled Spring” Warning
Bitcoin Price Stuck Near $66K While Oil Surges Toward $80 on Strait of Hormuz War Fears — How Markets React to Iran–US–Israel Tensions
Share
Key Takeaways
Bitcoin’s 30-day realized volatility has fallen to the 1st percentile of its entire history, a condition that has preceded every relevant price move in the past.
This level of compression represents a “coiled spring” setup, where suppressed price movement stores energy that typically releases in sharp volatility expansion.
The volatility risk premium is extensive, with options markets pricing far more movement than is currently occurring.
Bitcoin’s positive correlation with the U.S. dollar, a rare macro signal, has historically appeared ahead of significant repricing events.
Bitcoin is hovering near psychologically significant price levels, and most headlines are fixated on round numbers, such as $100,000. But beneath the surface, a far more critical signal is quietly flashing, one that historically precedes Bitcoin’s largest and fastest moves.
Bitcoin’s 30-day realized volatility has fallen to the 1st percentile of its entire history. That means volatility has been lower than today only 1% of the time since Bitcoin began trading.
This is not just “low volatility.” It is structural compression, a condition that rarely persists and rarely resolves quietly.
In financial markets, volatility behaves like pressure. When it is suppressed for too long, it doesn’t disappear. It builds. And when it finally releases, the move tends to be sharp, directional, and disruptive.
What Does Bitcoin’s 1st-Percentile Volatility Mean for Price?
Realized volatility measures how much Bitcoin’s price is actually moving over a given period. At the 1st percentile, price movement has slowed to an extreme rarely observed in Bitcoin’s lifecycle.
Historically, similar conditions appeared only before:
The 2013 parabolic expansion.
The 2017 breakout.
The post-COVID surge in 2020.
The violent repricing after the late-2022 capitulation.
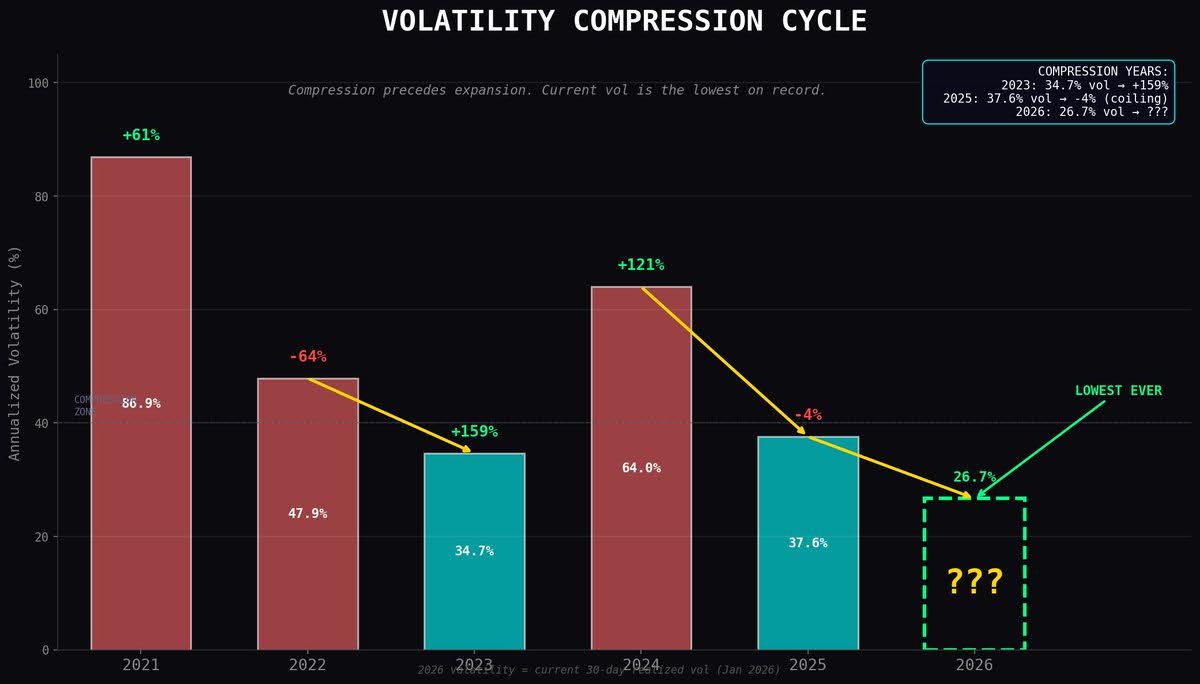
Bitcoin volatility compression cycle. | Credit: david_eng_mba X profile
In each case, volatility didn’t stay low. It mean-reverted upward, often explosively.
Volatility is one of the most consistent mean-reverting variables in finance.
Long periods of calm tend to be followed by turbulence, not because markets “want excitement,” but because suppressed movement creates imbalances that eventually force repricing.
Why Bitcoin Volatility Always Mean-Reverts After Extreme Compression
One of the strongest signals reinforcing this setup is the volatility risk premium (VRP), the gap between what the options market expects and what the market is currently delivering.
Right now:
Implied volatility: 43.5%
Realized volatility: 25.3%
Volatility risk premium: +18.2%
In plain terms, traders are paying for options that assume nearly double the price movement Bitcoin is currently showing.
This gap does not persist indefinitely.
When implied volatility stays far above realized volatility, history shows one of two things happens:
But the underlying demand and positioning do not vanish. They are simply held in tension.
Like a compressed spring:
The tighter the compression.
The longer it lasts.
The more forceful the eventual release.
Importantly, a coiled spring does not tell you direction with certainty, but it does warn that inaction is temporary.
How Options Gamma Is Suppressing Bitcoin Price — And Why That Ends Soon
One reason Bitcoin’s price appears “stuck” is dealer gamma.
Options dealers hedge exposure dynamically. When large amounts of gamma are outstanding near a specific price level, dealers are forced to buy dips and sell rallies. This behavior dampens price movement and confines prices to narrow ranges.
Currently, that dampening force is quite powerful.
Large, long-term holders, such as whales, miners, and institutions, often want to earn yield without selling their Bitcoin. To achieve this, they sell covered call options, usually choosing obvious round-number targets, such as $100,000.
When these calls are sold, market makers take the other side of the trade. That leaves dealers long call exposure, which forces them to hedge dynamically.
As Bitcoin’s price rises toward the $100,000 strike, dealers must sell spot Bitcoin to remain delta-neutral. This selling pressure increases as the price approaches the strike, creating a self-reinforcing ceiling.
Marginal buying cost per $1,000 increment. | Credit: X
The data support this structure. Call-side gamma is significantly higher than put-side gamma, funding rates remain low, indicating limited retail leverage, and liquidity is heavily concentrated at the $100,000 strike. Even ETF outflows have failed to push the price lower, showing demand remains intact.
Cumulative Volume Delta analysis suggests the resistance curve near $100,000 is exponential. Each incremental move higher requires a disproportionately greater amount of capital.
In short, Bitcoin isn’t capped by sentiment.
Algorithmic hedging flows cap it. Until the prominent option positions expire, most notably around Jan. 30, price action is likely to remain range-bound rather than break out decisively.
Bitcoin and the Dollar Correlation Shift: A Rare Macro Warning Signal
Another underappreciated signal is the sudden shift in Bitcoin’s correlation with the U.S. dollar.
Over the past week, the 7-day BTC/DXY correlation jumped from +0.04 to +0.44.
Bitcoin typically moves opposite the dollar. When both rise together, it suggests something unusual: capital is fleeing risk broadly and moving into assets perceived as “hard” or scarce at the same time.
When Bitcoin and the dollar move in sync, it often reflects a structural repositioning, rather than short-term speculation.
Why Zero Retail Leverage Changes the Next Bitcoin Volatility Breakout
One reason past volatility spikes were so violent is that they coincided with excessive retail leverage. Liquidations accelerated moves once the price began shifting.
That condition does not exist today.
Funding rates are near zero. Retail leverage is largely absent. There is no crowded long or short positioning waiting to be forcibly unwound.
This matters because it changes the character of a potential move:
The CME futures basis remains around 5.45%, indicating steady demand for exposure through regulated venues. This suggests accumulation, not distribution.
At the same time, long-term valuation models, such as the Bitcoin power-law framework, indicate that the price is roughly 22% below trend.
Low volatility, combined with institutional accumulation and undervaluation, has historically preceded upward repricing, rather than prolonged stagnation.
Why Bitcoin’s 2026 Volatility Setup Is More Extreme Than 2025
What makes the current setup especially notable is timing.
2025 was already a year of compression. Yet volatility in early 2026 is even lower than during last year’s consolidation.
Bitcoin volatility in 2025. | Credit: bitbo.io
That means:
The spring didn’t release in 2025.
Energy continued to be stored.
Compression intensified.
Markets rarely tolerate extended suppression without consequence. When volatility finally returns after prolonged dormancy, it tends to overshoot.
What Low Bitcoin Volatility Does Not Mean for Traders and Investors
Bitcoin is sitting at a volatility floor seen only 1% of the time in its history. The volatility risk premium is stretched. Dealer gamma suppression is being unwound. Retail leverage is absent. Institutions are accumulating. Macro correlations are shifting.
This is what structural compression looks like.
Volatility does not disappear. It transfers, accumulates, and eventually releases. When it does, the move is rarely subtle.
Bitcoin’s spring has been tightening for months. It does not stay coiled forever.
What does it mean that Bitcoin’s volatility is at the 1st percentile?
It means Bitcoin’s price movement over the last 30 days is lower than 99% of all historical periods. This level of calm is extremely rare and has historically occurred before major price moves.
Why does low volatility matter for Bitcoin?
Volatility tends to mean-revert. When it stays unusually low for a long time, it often builds pressure that eventually results in a sharp move, up or down, rather than continued sideways trading.
What is the “coiled spring” analogy?
It describes a market under extreme compression. Just like a tightly compressed spring stores energy, Bitcoin’s prolonged low volatility stores pressure that can release suddenly once conditions change.
What is the volatility risk premium, and why is it important?
The volatility risk premium is the gap between implied volatility (what options markets expect) and realized volatility (what is actually happening). A large gap suggests the market is pricing in much bigger future moves than current price action reflects.
Disclaimer:
The information provided in this article is for informational purposes only. It is not intended to be, nor should it be construed as, financial advice. We do not make any warranties regarding the completeness, reliability, or accuracy of this information. All investments involve risk, and past performance does not guarantee future results. We recommend consulting a financial advisor before making any investment decisions.
Giuseppe Ciccomascolo began his career as an investigative journalist in Italy, where he contributed to both local and national newspapers, focusing on various financial sectors.
Upon relocating to London, he worked as an analyst for Fitch's CapitalStructure and later as a Senior Reporter for Alliance News. In 2017, Giuseppe transitioned to covering cryptocurrency-related news, producing documentaries and articles on Bitcoin and other emerging digital currencies. He also played a pivotal role in establishing the academy for a cryptocurrency exchange website. Crypto remained his primary area of interest throughout his tenure as a writer for ThirdFloor.


 Easy
Easy