With technicals heating up, Conflux may just be warming up for a bigger move.
Share
Key Takeaways
Conflux price surged 255% in 30 days, hitting a yearly high of $0.27, and could rise toward $0.41
CFX could reach $0.67 in 2025, but projections show a possible dip in 2026 before long-term growth.
While macro trends and tech upgrades favor bullishness, investors are advised to do their research.
Conflux (CFX) has already delivered triple-digit returns over the past 30 days. But for many, that is not the destination; it is the starting line.
As attention pivots to layer-1s positioned in strategic geopolitical zones, Conflux’s unique China-facing model gives it a narrative edge others lack.
As such, this Conflux price prediction reveals that the altcoin is set for an explosive run this year and beyond. Here is why.
Conflux Price Prediction
Let’s look at the CFX price predictions made by CCN on Dec. 9. We will use the wave count to create our prediction and then add and remove 20% to create the minimum and maximum targets.
Minimum Conflux Price Prediction
Average Conflux Price Prediction
Maximum Conflux Price Prediction
2025
$0.10
$0.33
$0.67
2026
$0.021
$0.075
$0.22
2030
$0.85
$1.16
$1.89
CFX Price Prediction 2025
The Conflux price might rise as high as $0.67 before the end of 2025. This is due to the recent mainnet upgrade and the rising demand for the cryptocurrency.
The Conflux price prediction could be $0.10 at a minimum. On average, CFX could trade at $0.33, especially if the altcoin season gets back on track.
Try Our Recommended Crypto Exchanges
Sponsored
Disclosure
We sometimes use affiliate links in our content, when clicking on those we might receive a commission at no extra cost to you. By using this website you agree to our terms and conditions and privacy policy.
In 2026, CFX’s market value could decline as holders likely take profits. As a result, the CFX price could be between $0.021 and $0.22.
CFX Price Prediction 2030
By 2030, cryptocurrency adoption is likely to have soared to unimaginable levels. As such, the altcoin’s market value might rise to a new all-time high of 1.70.
The minimum CFX price could be $0.85, while the average price could be around $1.16.
CFX Price Analysis
On the weekly chart, CFX’s price has broken above the upper trendline of a descending triangle. Amid that, the Money Flow Index (MFI) has risen above the neutral line, indicating rising buying pressure around the altcoin.
As seen below, the Bull Bear Power (BBP) is in the positive region, indicating buyers are in control. Should this trend remain the same, the CFX price might break the resistance at $0.33 and soar to $0.67.
On the other hand, this prediction might not happen if demand for altcoins decreases. In that scenario, the CFX price might drop toward $0.10.
Short-Term CFX Price Prediction
In the short term, the Conflux price is likely to continue trading higher. As shown on the 4-hour chart, CFX has broken out of a bullish pennant.
Like the weekly chart, the BBP is also positive, indicating rising buying pressure. Should this trend continue, the CFX price might hit $0.41 in the short term.
The Total Value Locked (TVL) to market cap ratio (TVL ratio) measures the valuation of a decentralized finance (DeFi) project by comparing its market capitalization to the total value of assets locked in its smart contracts. This ratio shows the project’s utilization and links the platform’s health to locked asset value.
A ratio above 1.0 indicates overvaluation because the market cap exceeds the value of assets used in the platform. A ratio below 1.0 indicates undervaluation because the market cap is lower than the value of locked assets.
On Dec. 9, 2024, the Conflux TVL ratio was 77.04, indicating that the altcoin is not exactly undervalued.
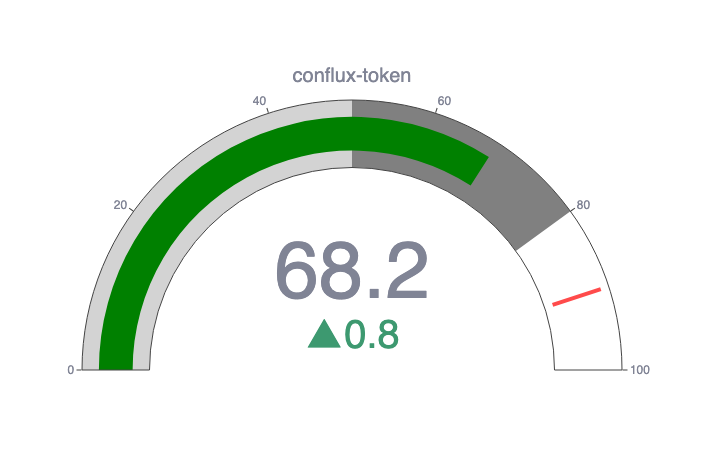
CCN Strength Index
The CCN Strength Index combines an array of advanced market signals to measure the strength of individual cryptocurrencies over the last 30 days.
Every day, it assigns a strength score, ranging from 0 to 100, to the top 500 assets by market capitalization on CoinMarketCap, focusing on both trend direction and the intensity of price movements.
0 to 24: Assets exhibit significant weakness, showing signs of sustained downtrend behavior.
25 to 35: The price tends to move within stable bounds with minimal volatility.
36 to 49: Assets begin a stable uptrend but without strong surges.
50 to 59: Consistent growth with moderate price advances, building momentum.
60+: Sharp price movements and high demand indicate stronger volatility and trend shifts.
The index dynamically adapts to rapid changes. For example, an asset experiencing a 100% increase within a short timeframe would see a sharp jump in its score to reflect the intensity of the rise.
However, should that asset stabilize at this new price level, the score will gradually taper down and align with the dampened momentum as the movement normalizes. The same principle applies to rapid declines: a sudden drop will spike the score downward, but as volatility decreases, the score will slowly adjust back up.
On July 29, 2025, Conflux scored 68.2 on the CCN Index, suggesting momentum strong enough to cause a potential trend shift.
0xf977814e90da44bfa03b6295a0616a897441acec. This wallet held 301,414,679 CFX, or 28.06% of the supply.
0x5a52e96bacdabb82fd05763e25335261b270efcb. This wallet held 229,617,081 CFX, or 21.38% of the supply.
0xc9c283d889680c14987e8fa818615c00d73cea06. This wallet held 42,500,000 CFX, or 3.96% of the supply.
0xa371055806ca53402cd783a73ecb6ba9dafa3879. This wallet held 38,087,110 CFX, or 3.55% of the supply.
0xc882b111a75c0c657fc507c04fbfcd2cc984f071. This wallet held 29,359,255 CFX, or 2.73% of the supply.
Conflux Supply and Distribution
Supply and distribution
Figures
Total supply
5,689,186,135
Circulating supply (as of July 29, 2025)
5,116,255,795 (93.1% of total supply)
Holder distribution
The top 10 holders own 68.36% of the maximum supply as of July 29, 2025
From the Conflux Whitepaper
In its technical documentation or whitepaper, Conflux says blockchains are based on economics as much as they are based on technology.
It says: “Conflux offers several innovations relative to well-understood blockchain networks such as Bitcoin and Ethereum, both in terms of technology design and the economics that underpin the technology. Most notably, a major difference in Conflux when compared to the status quo is that the processing of blocks occurs in parallel rather than serially, and users who commit code or information to the blockchain face ongoing costs and/or benefits for the duration they occupy chain space.”
Conflux (CFX) Explained
The Conflux blockchain is designed to be quick and save people money.
Chinese crypto entrepreneurs Fan Long, YuanJie Zhang, and Ming Wu founded Conflux in 2018. The CFX crypto started trading on the open market in November 2020. It is fully compliant with China’s notoriously strict crypto regulations.
Shanghai city authorities chose the system to help create a central bank digital currency (CBDC) based on the Chinese Yuan.
The CFX coin supports the Conflux network.
How Conflux Works
The Conflux blockchain uses a tree-graph system, with blocks split into different branches linked to a parent block. This, at least in theory, allows it to be faster and less vulnerable to slowing down than traditionally structured chains.
Conflux secures itself using a hybrid of Proof-of-Work (PoW) and Proof-of-Stake. This means that people can solve increasingly complex mathematical equations to add blocks to the blockchain or be selected based on how much CFX they hold.
The PoS element of Conflux allows people to build decentralized applications (DApps) on the blockchain.
CFX rewards people who add blocks to the blockchain, as well as paying the system’s fees. Meanwhile, holders can vote on changes to the network. People can also buy, sell, and trade the coin on exchanges.
Is Conflux a Good Investment?
It is hard to say. While the blockchain does have the advantage of operating under China’s notoriously strict regime, it has not been immune to overall market movements.
Furthermore, crypto has been struggling recently, and we don’t know what, if anything, can be done to get it moving upward again.
As ever with crypto, you will need to make sure you do your own research before deciding whether or not to invest in CFX.
Will Conflux go up or down?
No one can really tell right now. While the CFX price predictions are largely positive, price predictions have a well-earned reputation for being wrong. Keep in mind, too, that prices can and do go down and up.
Should I invest in Conflux?
Before you decide whether or not to invest in Conflux, you will have to do your own research, not only on CFX but on other similar coins and tokens such as COTI. Either way, you should ensure you never invest more money than you can afford to lose.
FAQs
How many Conflux are there?
On July 29, 2025, there were 5.11 billion CFX in circulation out of a total supply of over 5.68 billion.
Will Conflux reach $1?
If it does, Conflux won’t reach $1 until at least the 2030s, according to our price analysis.
It is worth pointing out that the highest CFX has ever traded at is $1.70, which it reached in late March 2021.
What is Conflux used for?
CFX rewards people who add blocks to the CFX blockchain. Holders can vote on changes to the platform, and CFX also pays the system’s fees. People can also buy, sell, and trade it on exchanges.
Victor Olanrewaju is a crypto analyst and reporter at CCN with deep roots in on-chain research and technical analysis. His crypto journey began in 2017, but it was the 2020 Uniswap airdrop that sparked a full-time pivot into the space.
With a foundation in copywriting, Victor honed his craft creating high-converting content for leading crypto brokers — most notably an XRP price prediction that ranked #1 on Google during the 2021 bull run.
He later joined AMBCrypto in 2022, where he combined storytelling with technical and on-chain analysis to cover key market narratives.
In 2024, he expanded his expertise at BeInCrypto, collaborating with analysts and using tools like Glassnode, Santiment, and IntoTheBlock to break down Bitcoin and altcoin trends.
At CCN, Victor covers the top cryptocurrencies, memecoins, macro shifts, blending real-time insights with deep-dive metrics.
He holds a Bachelor’s degree in Physics from the University of Ibadan, equipping him to simplify complex data for a wide audience. Follow his work or connect on LinkedIn or X.