From the MACD crossover to a golden cross, technical indicators show TRON might rally in both the short and long term.
Share
Key Takeaways
Despite recent corrections, TRX is among the top 10 altcoins with a strong YoY gain of over 100%.
Analysis forecasts that TRON could fall for the rest of 2025, but potentially reach $1.50 by 2030.
TRON’s market cap to TVL ratio is 0.2, indicating that the coin may be considerably overvalued..
As a top blockchain, Tron has held its ground as the dominant stablecoin network. This also seems to be reflected in the price of the native cryptocurrency, TRX.
TRX’s price has increased by 100% within the past year, making it one of the best-performing top 100 cryptos.
As a result, several analysts expect Tron’s price to hit a higher value before this year ends.
So, in this piece, CCN discloses the Tron price prediction for 2025, 2026, and 2030.
TRON Price Prediction
In this section, we reveal the specific price targets that TRX’s price could reach using the project’s fundamentals and technical outlook. However, due to the volatility of the crypto market, these forecasts could be subject to change.
The wave count method will give the average price predictions, while the maximum and minimum targets depend on the price movement during the year.
Minimum TRON Price Prediction
Average TRON Price Prediction
Maximum TRON Price Prediction
2025
$0.07
$0.17
$0.24
2026
$0.06
$0.10
$0.14
2030
$1
$1.39
$2
The most likely wave count shows that TRX broke out from a long-term symmetrical triangle in 2024 and reached its all-time high.
If the count is accurate, the TRX price has completed a five-wave upward movement and has started a lengthy correction.
Get These Top Crypto Casino Offers Now!
Sponsored
Disclosure
We sometimes use affiliate links in our content, when clicking on those we might receive a commission at no extra cost to you. By using this website you agree to our terms and conditions and privacy policy.
During these projected upward and downward movements, the wave count method gives targets of $0.32 and $0.26 for the end of 2025 and 2026, respectively.
The rate of increase for the past seven years will then help determine the TRX price at the end of 2030.
TRX has increased by 600% since October 2018, and projecting this rate of increase forward leads to a high of $1.39.
TRON Price Prediction for 2025
The wave count method predicts a TRX price between $0.07 and $0.24 by the end of 2025.
TRON Price Prediction for 2026
The wave count method gives a TRX price prediction between $0.06 and $0.14 for the end of 2026.
TRON Price Prediction for 2030
The daily rate of increase predicts a TRX price between $1 and $2 by the end of 2030.
TRON Price Analysis
The weekly time frame analysis reveals that the TRX price has increased with a parabolic ascending support trend line since the beginning of 2023.
During its ascent, the TRX price hit a new all-time high of $0.45 in December, after using the parabola as a spring for a bounce.
Nevertheless, the upward movement could not be sustained, and the TRX price created a long upper wick, never revisiting its highs.
Despite the lack of a follow-up, the TRX price bounced at the parabola several times (green icons), maintaining its bullish structure.
This changed last week, when the biggest crypto liquidation event on record finally caused the TRX price to crash below the parabola after 1,050 days.
Breakdowns from such long-term structures typically lead to a significant shift in trend.
This has not happened yet for TRX, possibly because the price has increased above the $0.320 horizontal support area. Once that goes, the TRX price could quickly plunge to new lows.
Momentum indicators do not suggest a bullish trend reversal. The Relative Strength Index (RSI) and Moving Average Convergence/Divergence (MACD) have generated bearish divergences (indicated by the orange lines).
The MACD has also made a bearish cross (black circle), the final confirmation that the TRX price prediction is bearish.
There is a lack of support below the current price, so TRX could quickly plunge to $0.22 if the $0.32 area gives.
Short-term TRON Price Prediction
The TRX price prediction for the next 24 hours is bearish. A breakdown from the $0.32 area could trigger a massive downward movement.
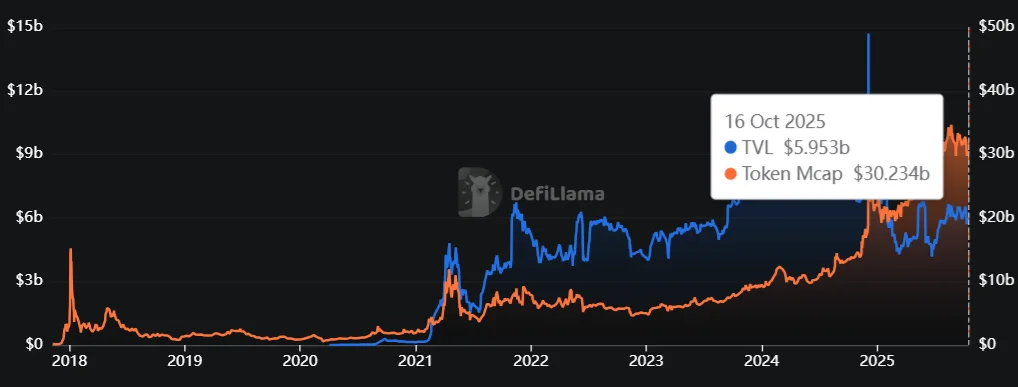
TRON Market Cap to TVL Ratio
The Total Value Locked (TVL) to market cap ratio (TVL ratio) measures the valuation of a decentralized finance (DeFi) project by comparing its market capitalization to the total value of assets locked in its smart contracts.
This ratio shows the project’s utilization and links the platform’s health to locked asset value.
A ratio above 1.0 indicates overvaluation because the market cap exceeds the value of assets used in the platform. A ratio below 1.0 indicates undervaluation because the market cap is lower than the value of locked assets.
At the time of writing, the Tron market cap to TVL ratio stands at 0.2, showing overvaluation.
CCN Strength Index
The CCN Strength Index combines an array of advanced market signals to measure the strength of individual cryptocurrencies over the last 30 days.
Every day, it assigns a strength score, ranging from 0 to 100, to the top 500 assets by market capitalization on CoinMarketCap, focusing on both trend direction and the intensity of price movements.
0 to 24: Assets exhibit significant weakness, showing signs of sustained downtrend behavior.
25 to 35: The price tends to move within stable bounds with minimal volatility.
36 to 49: Assets begin a stable uptrend without strong surges.
50 to 59: Consistent growth with moderate price advances, building momentum.
60+: Sharp price movements and high demand indicate more substantial volatility and trend shifts.
The index dynamically adapts to rapid changes. For example, an asset experiencing a 100% increase within a short timeframe would see a sharp jump in its score to reflect the intensity of the rise.
However, should that asset stabilize at this new price level, the score will gradually taper down and align with the dampened momentum as the movement normalizes. The same principle applies to rapid declines: a sudden drop will spike the score downward, but the score will slowly adjust as volatility decreases.
As of Oct. 16, 2025, Tron scored 34 on the CCN Index, suggesting weak momentum.
TRX CCN Index | Credit: CCN
Best Days and Months to Buy TRON
We looked at the TRX price history and found the times when the price was at its lowest across certain days, months, quarters, and even weeks in the year, indicating the best times to buy TRX.
Time to Buy TRX
Best Days, Weeks, Months, and Quarters
Best Day
Friday
Best Week
51
Best Month
December
Best Quarter
Fourth
TRX Price Performance Comparison
TRON is a blockchain that deals with smart contracts. Let’s compare it with other projects in the same category with similar market capitalizations.
TNMcQVGPzqH9ZfMCSY4PNrukevtDgp24dK. This wallet held 8,997,562,062 TRX or 8.83% of the supply.
TE2RzoSV3wFK99w6J9UnnZ4vLfXYoxvRwP. This wallet held 6,986,205,783 or 6.86%% % of the supply.
THUE6WTLaEGytFyuGJQUcKc3r245UKypoi. This wallet held 3,072,579,018 TRX or 1.73% of the supply.
TRzQrtxrEJbSbQNwAsgAHkBMxTX47yNmjo. This wallet held 1,700,079,996 TRX or 1.67% of the supply.
TJNtFduS4oebw3jgGKCYmgSpTdyPieb6Ha. This wallet held 1,551,521,474 TRX or 1.52% of the supply.
TRON Supply and Distribution
Supply and distribution figures
Total supply
94,665,261,939
Circulating supply as of Oct. 16, 2025
94,665,029,463 (99.99% of total supply)
Holder distribution as of Oct. 16
The top 10 holders own nearly 25% of the total supply
From the TRON Whitepaper
Tron’suser documentation says, “TRON is an open-source public blockchain platform that supports smart contracts. It is compatible with Ethereum, meaning you can migrate smart contracts on Ethereum to TRON directly or with minor modifications. TRON relies on a unique consensus mechanism to realize the high TPS of the TRON network, which is far beyond Ethereum, bringing developers a good experience of faster transactions.”
It says TRON uses a Proof-of-Work consensus mechanism. This means people must solve increasingly complex mathematical equations to verify transactions and add blocks to the blockchain. People also need to pay for the energy they consume on the network.
TRON (TRX) Explained
TRON first gained proper attention outside the cryptocurrency world in 2018 when it announced it would purchase the BitTorrent file-sharing site. The Tron Foundation wound down in the summer of 2021, and a decentralized autonomous organization (DAO) to help run the system was launched later that year.
The blockchain network hosts DApps (digital applications), which allow creators to avoid working with major technology companies such as Amazon and Google.
The TRON coin, known by its ticker handle TRX, supports the TRON blockchain.
How Tron Works
TRON has three separate layers: one for applications, one for storage, and a core layer. The core layer includes modules for account management, smart contracts, and computer programs that automatically execute when certain conditions are met.
TRON uses a Proof-of-Stake (PoS) consensus mechanism. Twenty-seven super representatives (SRs) place blocks on the blockchain and earn TRX crypto as a reward. TRX holders can freeze their accounts every six hours and vote on a new set of SRs.
TRON adds blocks every three seconds, and each block rewards an SR with 32 TRX. The platform’s coin pays hosting fees. People can also buy, sell, and trade it on exchanges. It is worth noting that it was first launched as a token on Ethereum before becoming a coin in its own right in 2018.
Is TRON a Good Investment?
TRON is a blockchain that consistently posts some of the highest transaction and user numbers, with its TRX coin currently hovering around the lower reaches of the top 10 cryptos by market cap.
However, it has dropped by more than 45% in the last six weeks.
Meanwhile, a legal cloud still hangs over TRON, although Paul Atkins‘ arrival as SEC chair could lift the pressure somewhat.
As ever with crypto, you must research before deciding whether or not to invest in TRON.
Will Tron Go Up or Down?
No one can tell right now. While the TRON crypto price predictions are mainly optimistic, at least in the long term, price predictions have a reputation for being wrong. Keep in mind that prices can and do go down and up.
Should I Invest in Tron?
Before deciding whether to invest in Tron, research TRX and other crypto coins, such as Solana (SOL) and Cardano (ADA).
Ultimately, you will need to decide for yourself. Still, you should also ensure you never invest more money than you can afford to lose.
On Oct. 16, 2025, 94.66 billion TRX were in circulation, representing 99.99% of the total supply.
Can Tron reach $1?
Our price predictions suggest that TRX could, potentially, break past the dollar in 2030.
What is Tron used for?
The TRX coin supports the Tron blockchain. People can also buy, sell, and trade TRX on exchanges.
Disclaimer
So that you know, the contents of this article are not financial or investing advice. The information provided in this article is the author’s opinion only and should not be considered as offering trading or investing recommendations. We do not make any warranties about this information’s completeness, reliability, or accuracy. The cryptocurrency market suffers from high volatility and occasional arbitrary movements. Any investor, trader, or regular crypto user should research multiple viewpoints and be familiar with all local regulations before committing to an investment.
Victor Olanrewaju is a crypto analyst and reporter at CCN with deep roots in on-chain research and technical analysis. His crypto journey began in 2017, but it was the 2020 Uniswap airdrop that sparked a full-time pivot into the space.
With a foundation in copywriting, Victor honed his craft creating high-converting content for leading crypto brokers — most notably an XRP price prediction that ranked #1 on Google during the 2021 bull run.
He later joined AMBCrypto in 2022, where he combined storytelling with technical and on-chain analysis to cover key market narratives.
In 2024, he expanded his expertise at BeInCrypto, collaborating with analysts and using tools like Glassnode, Santiment, and IntoTheBlock to break down Bitcoin and altcoin trends.
At CCN, Victor covers the top cryptocurrencies, memecoins, macro shifts, blending real-time insights with deep-dive metrics.
He holds a Bachelor’s degree in Physics from the University of Ibadan, equipping him to simplify complex data for a wide audience. Follow his work or connect on LinkedIn or X.
Valdrin Tahiri is a cryptocurrency analyst and reporter at CCN, specializing in technical analysis with a focus on Elliott Wave theory, on-chain metrics, and fundamental research. He brings over seven years of experience in the crypto space as both a trader and writer.
He discovered cryptocurrencies in 2017 while earning his MSc in Financial Markets at the Barcelona School of Economics, which sparked a deep interest in blockchain and market dynamics. Since then, he’s contributed to top crypto outlets like BeInCrypto and CoinGape.
Valdrin also served as Community Manager of BeInCrypto’s Telegram group for three years, helping grow it into one of the largest crypto communities worldwide. His expertise in market structure and price patterns allows him to break down complex trends into clear, actionable insights.
He’s published thousands of articles covering altcoins, Bitcoin cycles, and macro trends.