XLM price target higher zones | Credit: Hameem Sarwar
Share
Key Takeaways
Stellar has broken out of a downtrend, with strong momentum and higher lows.
Positive indicators and capital inflows support the setup, with potential upside.
A breakout could drive XLM toward $0.24, while a rejection could trigger a pullback.
Stellar (XLM) spent weeks being told no by the same descending resistance line. It kept testing. It kept getting rejected.
However, as of this writing, XLM’s price has changed its trend. At the time of writing, it trades at $0.18, up 15% over the past 30 days.
Interestingly, it does not seem the rally is over, as indicators suggest the altcoin could trade higher.
Stellar Scales Past Resistance
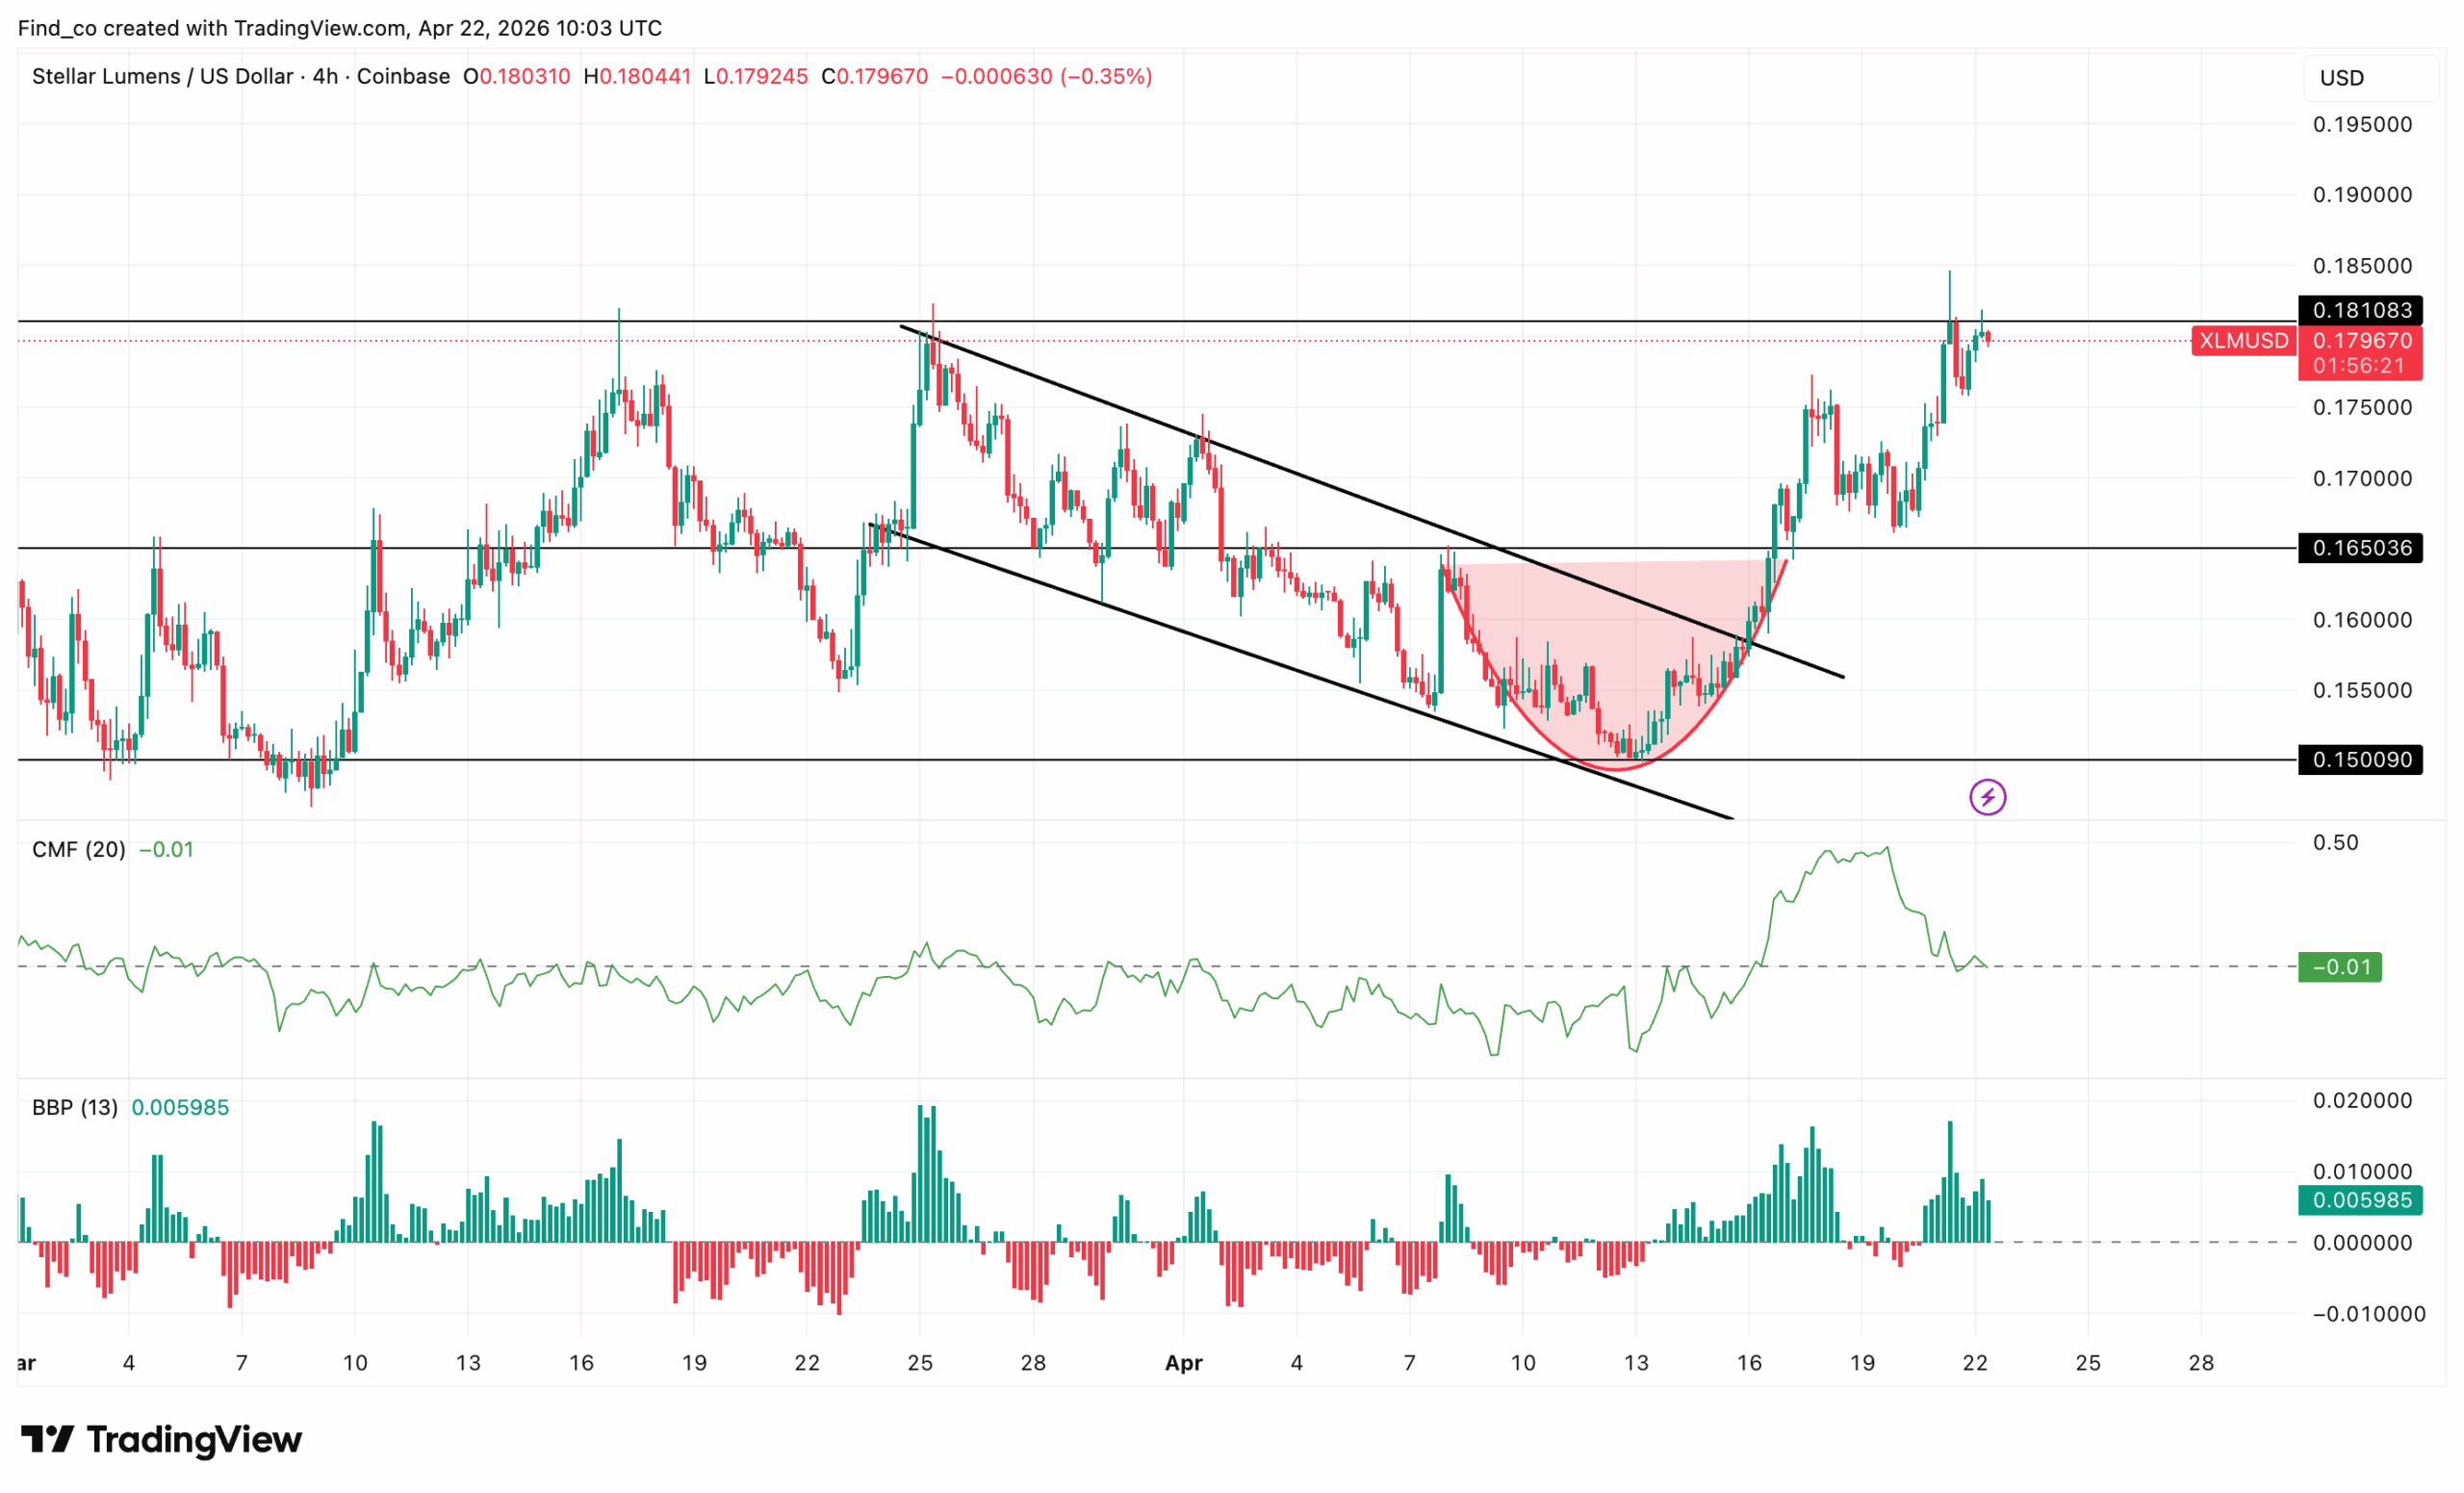
On the 4-hour chart, XLM is approaching the top of a horizontal consolidation structure between roughly $0.15 and $0.18. Such formations often precede large directional moves.
As shown below, XLM’s price is now pressing against resistance after printing a sequence of impulsive green candles. Notably, the altcoin has broken above the upper trendline of a descending channel.
Get These Top Crypto Casino Offers Now!
Sponsored
Disclosure
We sometimes use affiliate links in our content, when clicking on those we might receive a commission at no extra cost to you. By using this website you agree to our terms and conditions and privacy policy.
Previously, the coin had also formed a rounding bottom, and now, it has surged past the neckline near $0.16.
More importantly, the higher-low formation since mid-April strengthens the breakout case.
Meanwhile, the Chaikin Money Flow (CMF) remains above zero at 0.03. That matters because positive CMF readings suggest buying pressure continues to outweigh distribution.
Although the indicator has cooled from recent highs, it has not slipped into negative territory. Therefore, capital inflows still support the broader bullish setup.
In addition, the Bull Bear Power (BBP) remains positive. Green histogram bars show buyers retain control, even as momentum moderates.
If bulls flip $0.18 into support, the measured move from the range could push the price toward $0.22, representing nearly 20% upside from current levels.
Still, rejection at resistance could delay that move and send XLM’s price back toward $0.17 before another breakout attempt.
XLM Price Prediction: Is $0.24 Next?
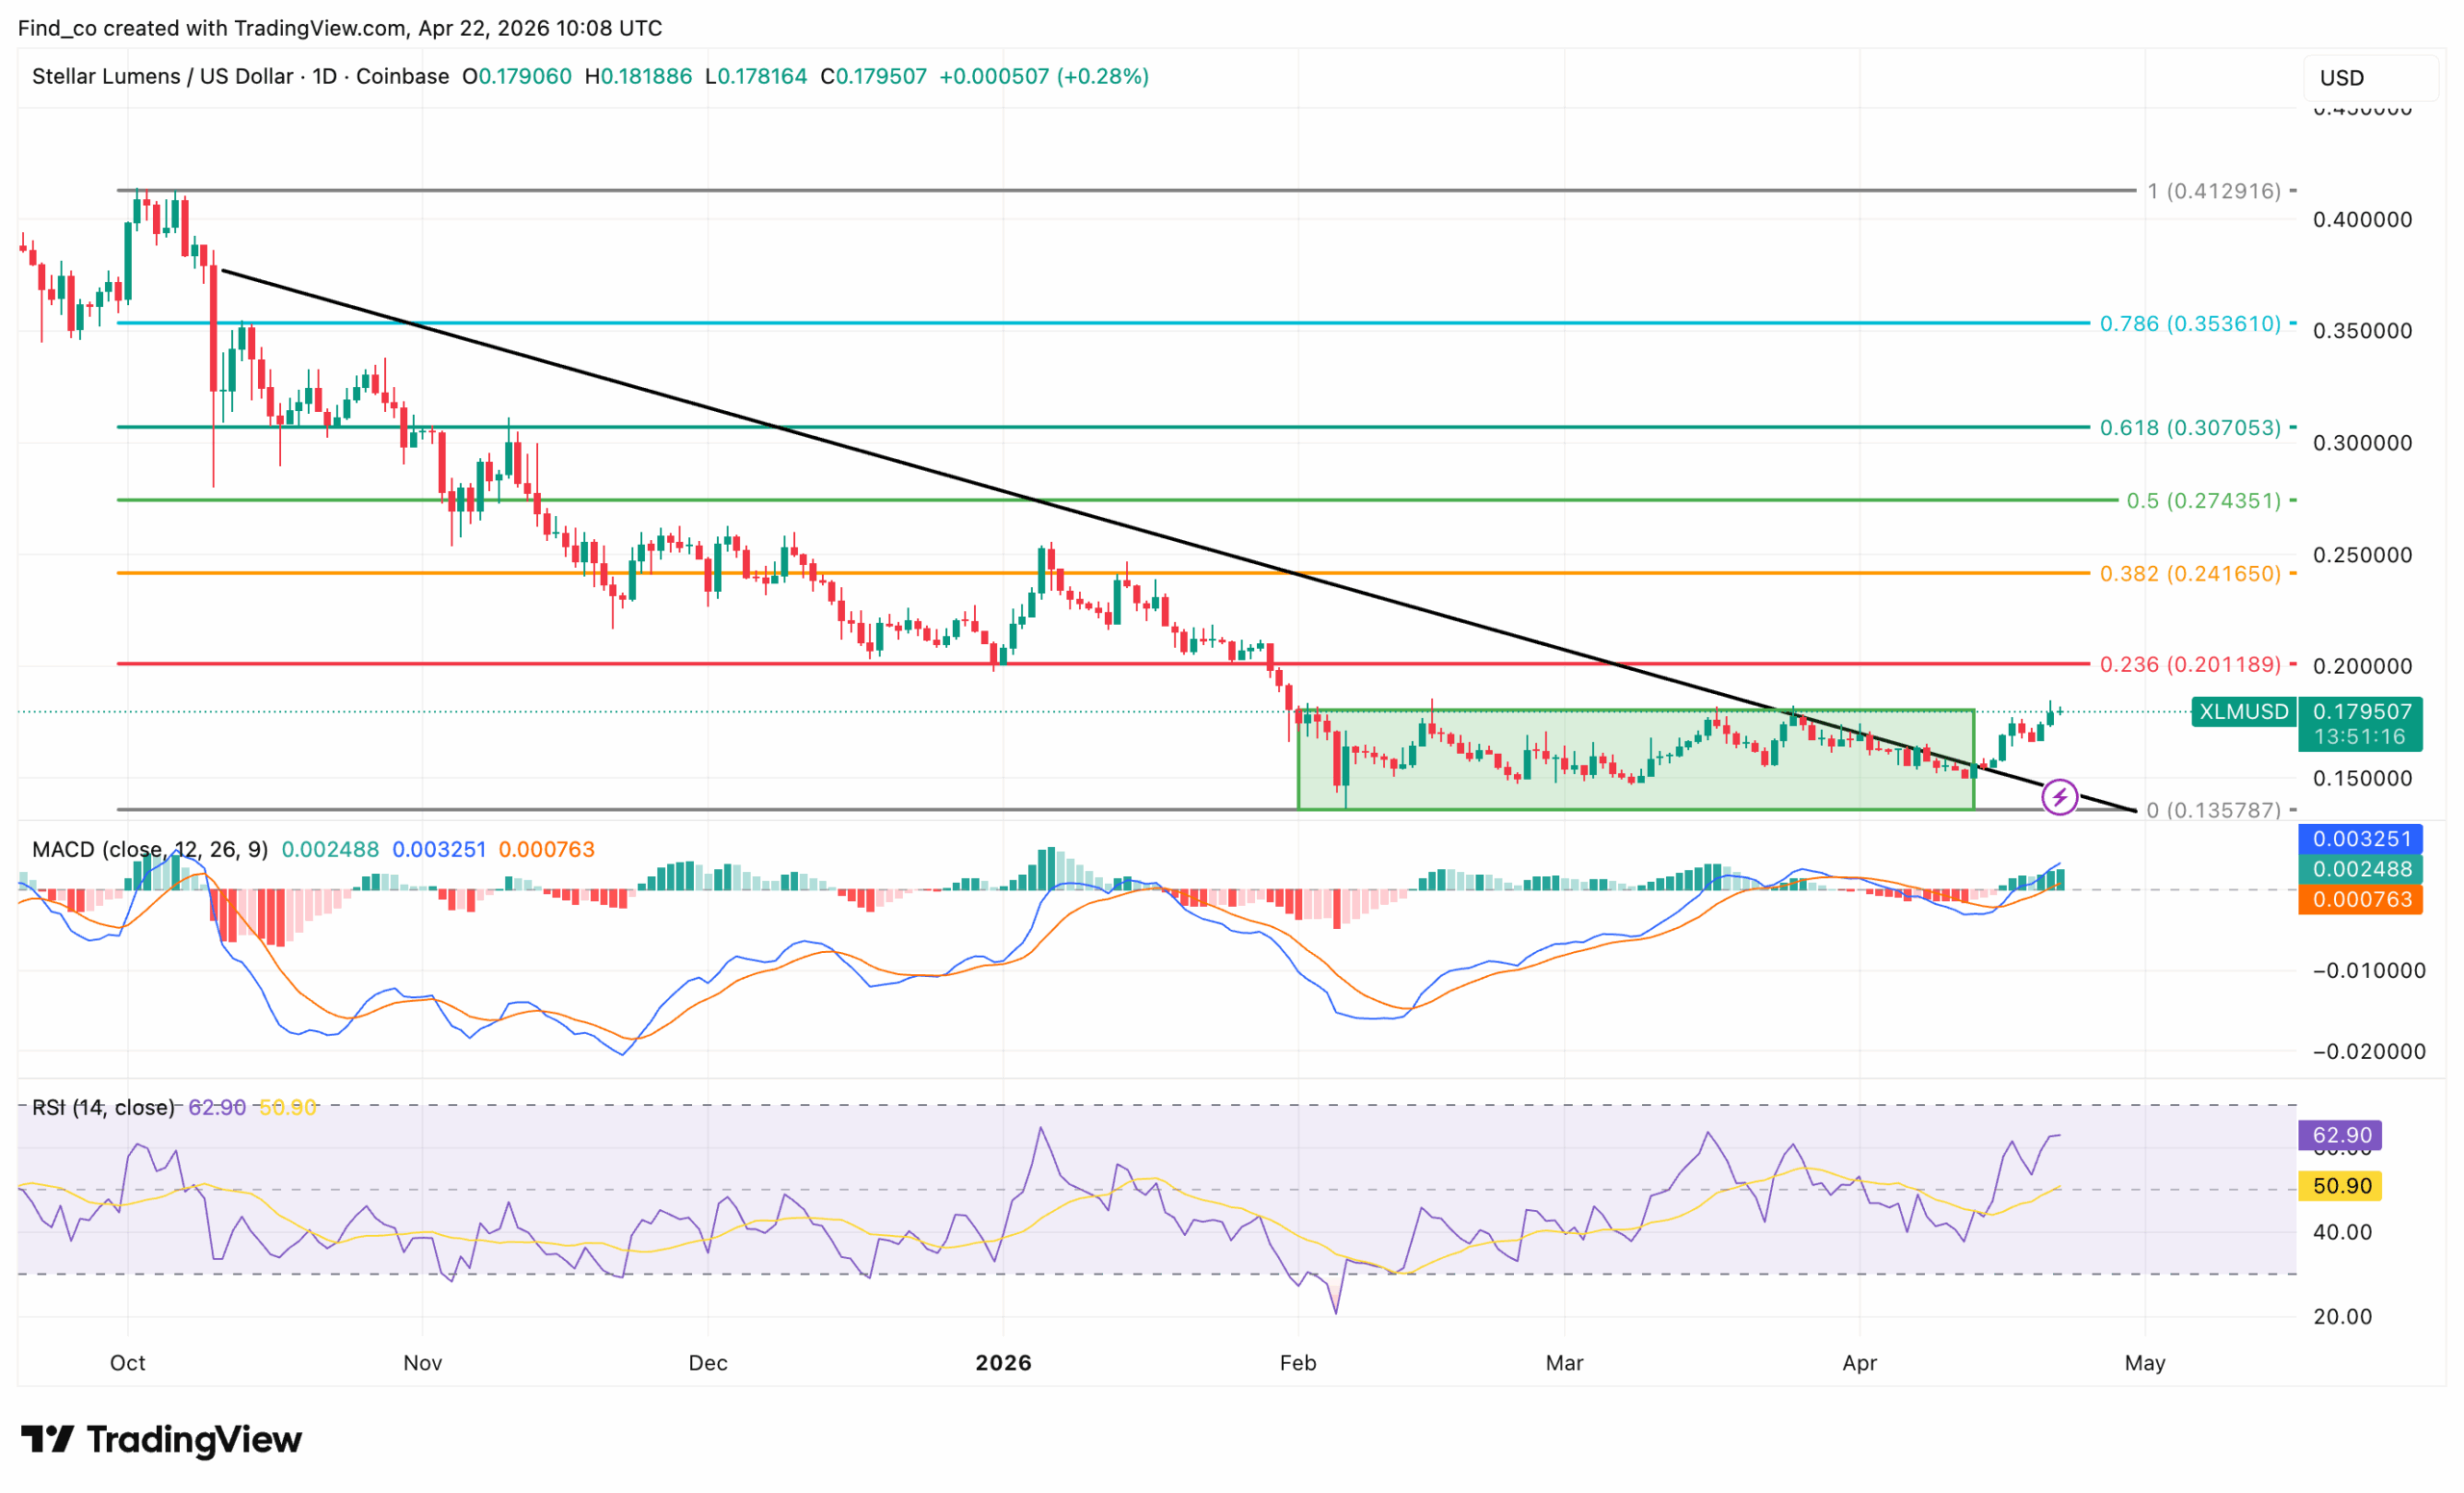
On the daily chart, XLM is showing early signs of recovery after an extended period of bearish pressure, with the price now rebounding toward the $0.18 level.
This shift comes after a prolonged downtrend marked by lower highs, though recent price action hints at weakening seller dominance.
Gradually, buyers are stepping in from the $0.14 base, establishing a short-term floor.
However, upside remains constrained. The $0.20-$0.24 zone, aligned with key Fibonacci levels, remains a strong resistance barrier.
As XLM’s price approaches this region, rejection risks increase. Meanwhile, momentum indicators are turning supportive.
The Moving Average Convergence Divergence (MACD) has flipped bullish with expanding histogram bars, suggesting strengthening momentum.
In addition, the Relative Strength Index (RSI) has pushed above 60, reflecting rising buying pressure.
Disclaimer:
The information provided in this article is for informational purposes only. It is not intended to be, nor should it be construed as, financial advice. We do not make any warranties regarding the completeness, reliability, or accuracy of this information. All investments involve risk, and past performance does not guarantee future results. We recommend consulting a financial advisor before making any investment decisions.
Victor Olanrewaju is a crypto analyst and reporter at CCN with deep roots in on-chain research and technical analysis. His crypto journey began in 2017, but it was the 2020 Uniswap airdrop that sparked a full-time pivot into the space.
With a foundation in copywriting, Victor honed his craft creating high-converting content for leading crypto brokers — most notably an XRP price prediction that ranked #1 on Google during the 2021 bull run.
He later joined AMBCrypto in 2022, where he combined storytelling with technical and on-chain analysis to cover key market narratives.
In 2024, he expanded his expertise at BeInCrypto, collaborating with analysts and using tools like Glassnode, Santiment, and IntoTheBlock to break down Bitcoin and altcoin trends.
At CCN, Victor covers the top cryptocurrencies, memecoins, macro shifts, blending real-time insights with deep-dive metrics.
He holds a Bachelor’s degree in Physics from the University of Ibadan, equipping him to simplify complex data for a wide audience. Follow his work or connect on LinkedIn or X.