XLM gets set to break past $0.20 | Credit: Hameem Sarwar
Share
Key Takeaways
The XLM/USD monthly chart shows that the coin is ready to follow a historical pattern.
On-chain data shows postive funding rate and negative sentiment, which seems bullish.
XLM has risen above the upper trendline of a symmetrical triangle on the daily chart.
Stellar (XLM) has been bleeding quietly for six months. Month after month, XLM’s price printed red.
Bulls watched the altcoin slide from a $0.52 July 2025 peak down through $0.40, then $0.30, and finally $0.21, before settling at $0.14, the support level it spent most of February.
For context, the Stellar coin kick-started 2026 with strong bullish support, jumping to $0.25 January.
Later on, it retreated to $0.14 in February as sentiment turned mostly bearish. However, that February flush may have been the final shakeout.
Month-to-Date (MTD), XLM’s price has outperformed Bitcoin (BTC) and Ethereum (ETH). By the look of things, the altcoin does not seem ready to give up these gains.
XLM Historical Price Analysis Hints At Rally
At the time of writing, the current Stellar coin price sits around $0.17.
Its circulating supply stands at 33 billion XLM, with a market cap of approximately $5.2 billion, placing it around number 19 in the global crypto rankings.
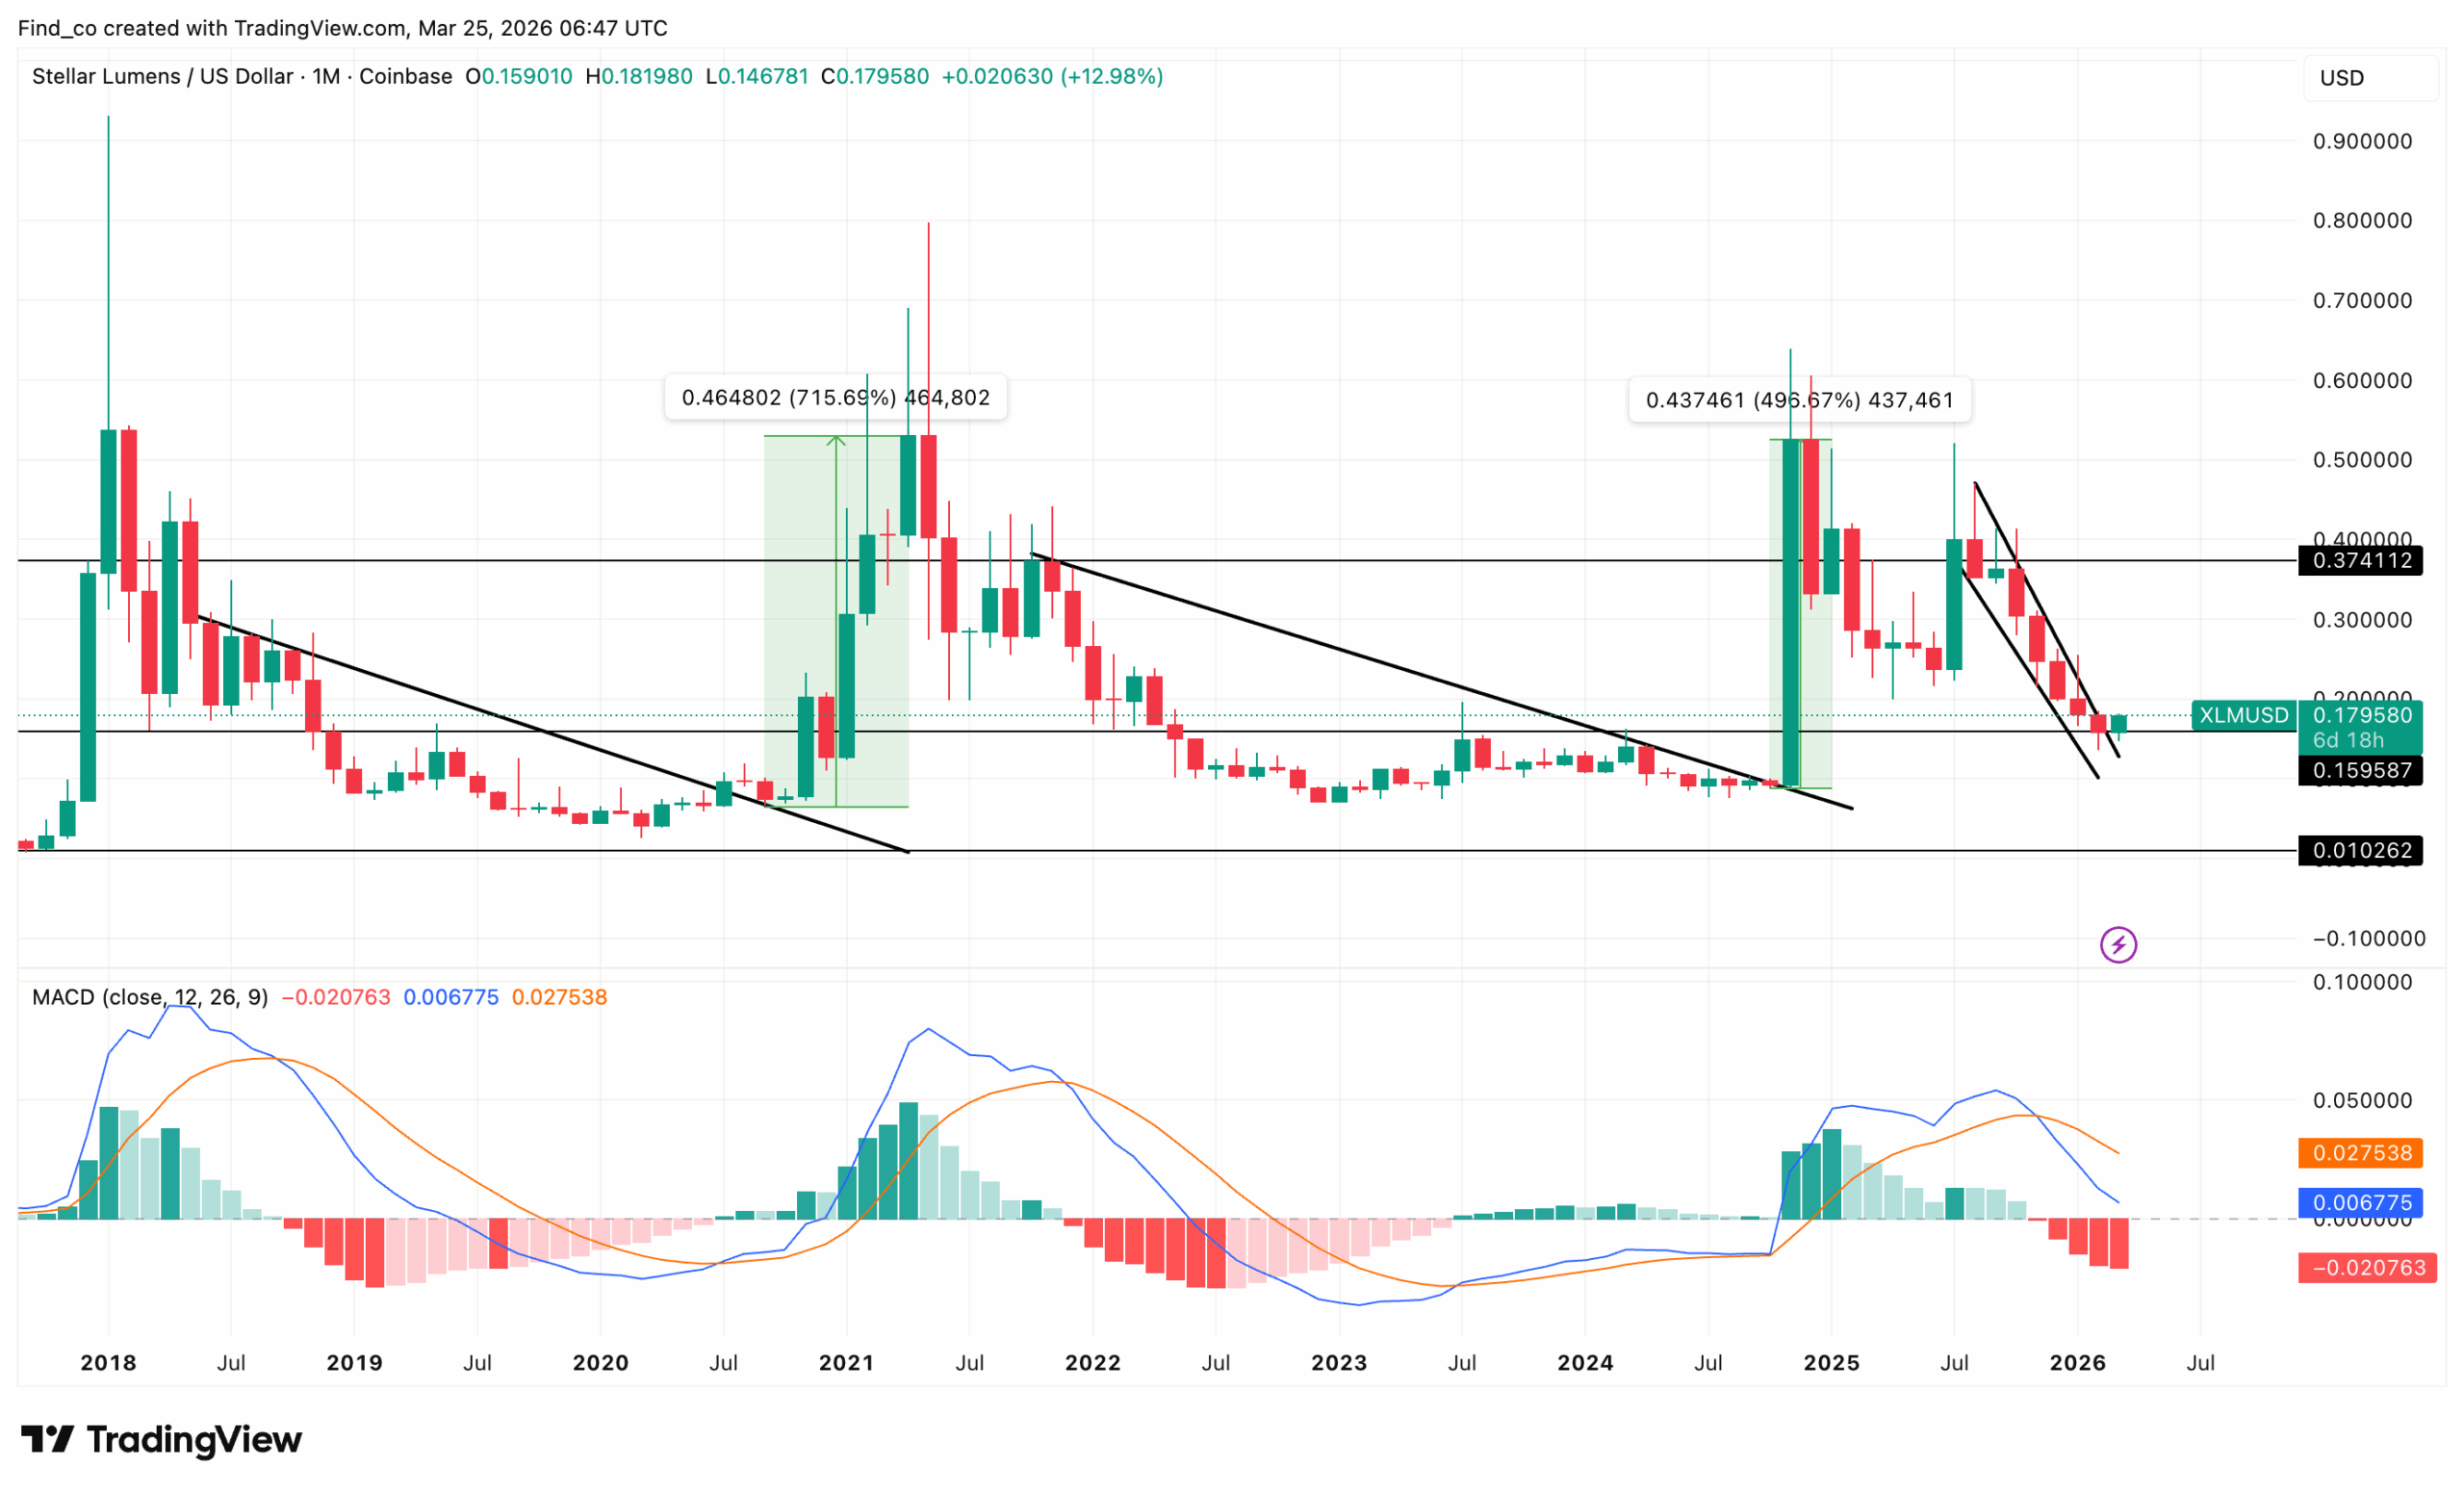
Looking at the monthly chart, the macro picture stretching back to 2018 is setting up one of the most historically consistent patterns.
Get These Top Crypto Casino Offers Now!
Sponsored
Disclosure
We sometimes use affiliate links in our content, when clicking on those we might receive a commission at no extra cost to you. By using this website you agree to our terms and conditions and privacy policy.
The chart highlights two previous explosive bull runs with remarkable symmetry. In 2021, XLM’s price surged 715.69% from its breakout base.
Then in 2024–2025, it rallied 496.67% from a comparable launching zone.
Stellar did not gain 17% on luck. Three powerful developments landed in a single week.
Both moves began from similar compressed, low-volatility bases. Crucially, both ignited just as the long-term descending trendline from the 2018 peak was being tested or broken.
Today, that same trendline now sits near $0.374 directly above the current Stellar coin price.
For context, XLM’s price has spent months compressing near the lows, forming a tighter descending channel before this month’s bounce.
Besides that, the MACD on the monthly timeframe reinforces the setup. The histogram is yet to turn positive from deeply negative territory.
However, this mirrors the exact MACD behaviour that preceded both prior mega-rallies. So, if history rhymes with the current trend, XLM’s price might slowly move up the ladder.
However, monthly charts demand patience as confirmation requires sustained closes above $0.37 before the full bull case is validated.
Macro Events Support the Bullish Thesis
From a fundamental perspective, other factors have also played a role in the XLM price rally.
For instance, On March 20, the SEC and CFTC jointly designated XLM as a digital commodity, removing the longstanding overhang of a potential securities classification that had kept institutions on the sidelines.
The same day, Amundi, Europe’s largest asset manager, launched a $100 million tokenized fund directly on the Stellar network.
Zebec simultaneously deployed real-time USDC payroll services on Stellar, further expanding its global payments utility.
Given that the Chicago Mercantile Exchange launched regulated XLM futures in February, everything seems in place for the Stellar coin to move past $0.20.
XLM Bulls Seem Ready for More
On the on-chain side, the derivatives market is sending a clear bullish signal.
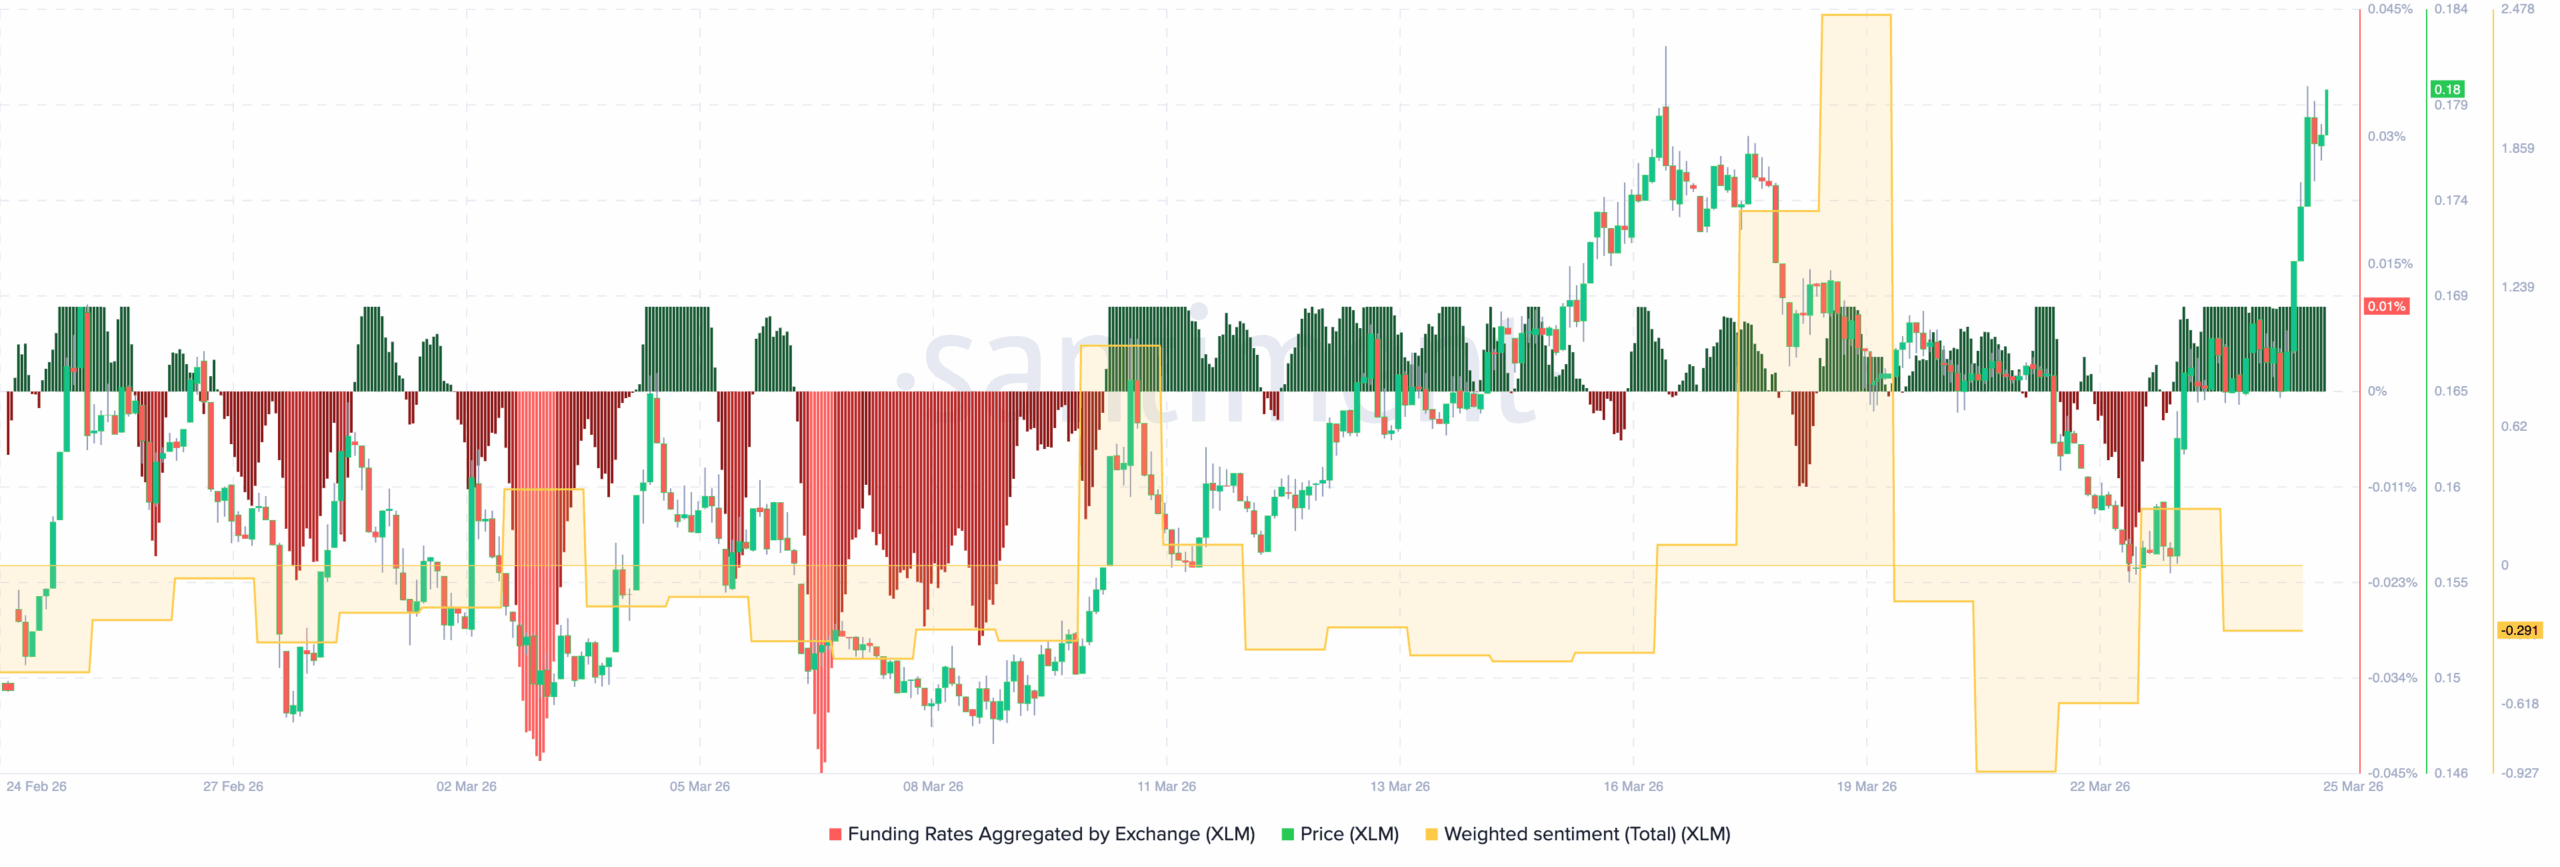
According to the sentiment below, the price and weighted sentiment combination tell a compelling story.
First, the funding rates. Deep red bars dominated February and early March, meaning short sellers were paying longs.
That changed around March 10. Funding has since flipped positive, now sitting at +0.01%. Positive funding confirms leveraged bulls are paying to hold positions, expressing genuine conviction that XLM’s price will trade higher.
Crucially, though, the rate isn’t extreme, meaning the long side isn’t dangerously overcrowded yet.
Next, the weighted sentiment. Despite XLM surging from $0.14 to $0.18 in just days, sentiment reads just -0.29.
Bull runs typically end when sentiment spikes excessively, and latecomers pile in simultaneously.
That hasn’t happened here. The market remains largely indifferent.
Thus, this is exactly the psychological condition that allows rallies to extend further than most expect.
XLM Funding Rate and Weighted Sentiment | Credit: Santiment
Both signals point in the same direction. Bulls are positioned with conviction, but the trade isn’t crowded.
If the trend persists, then XLM’s price has more room to run before sentiment becomes a warning sign.
XLM Price Forecast: Legitimate Recovery or Dead Cat Bounce?
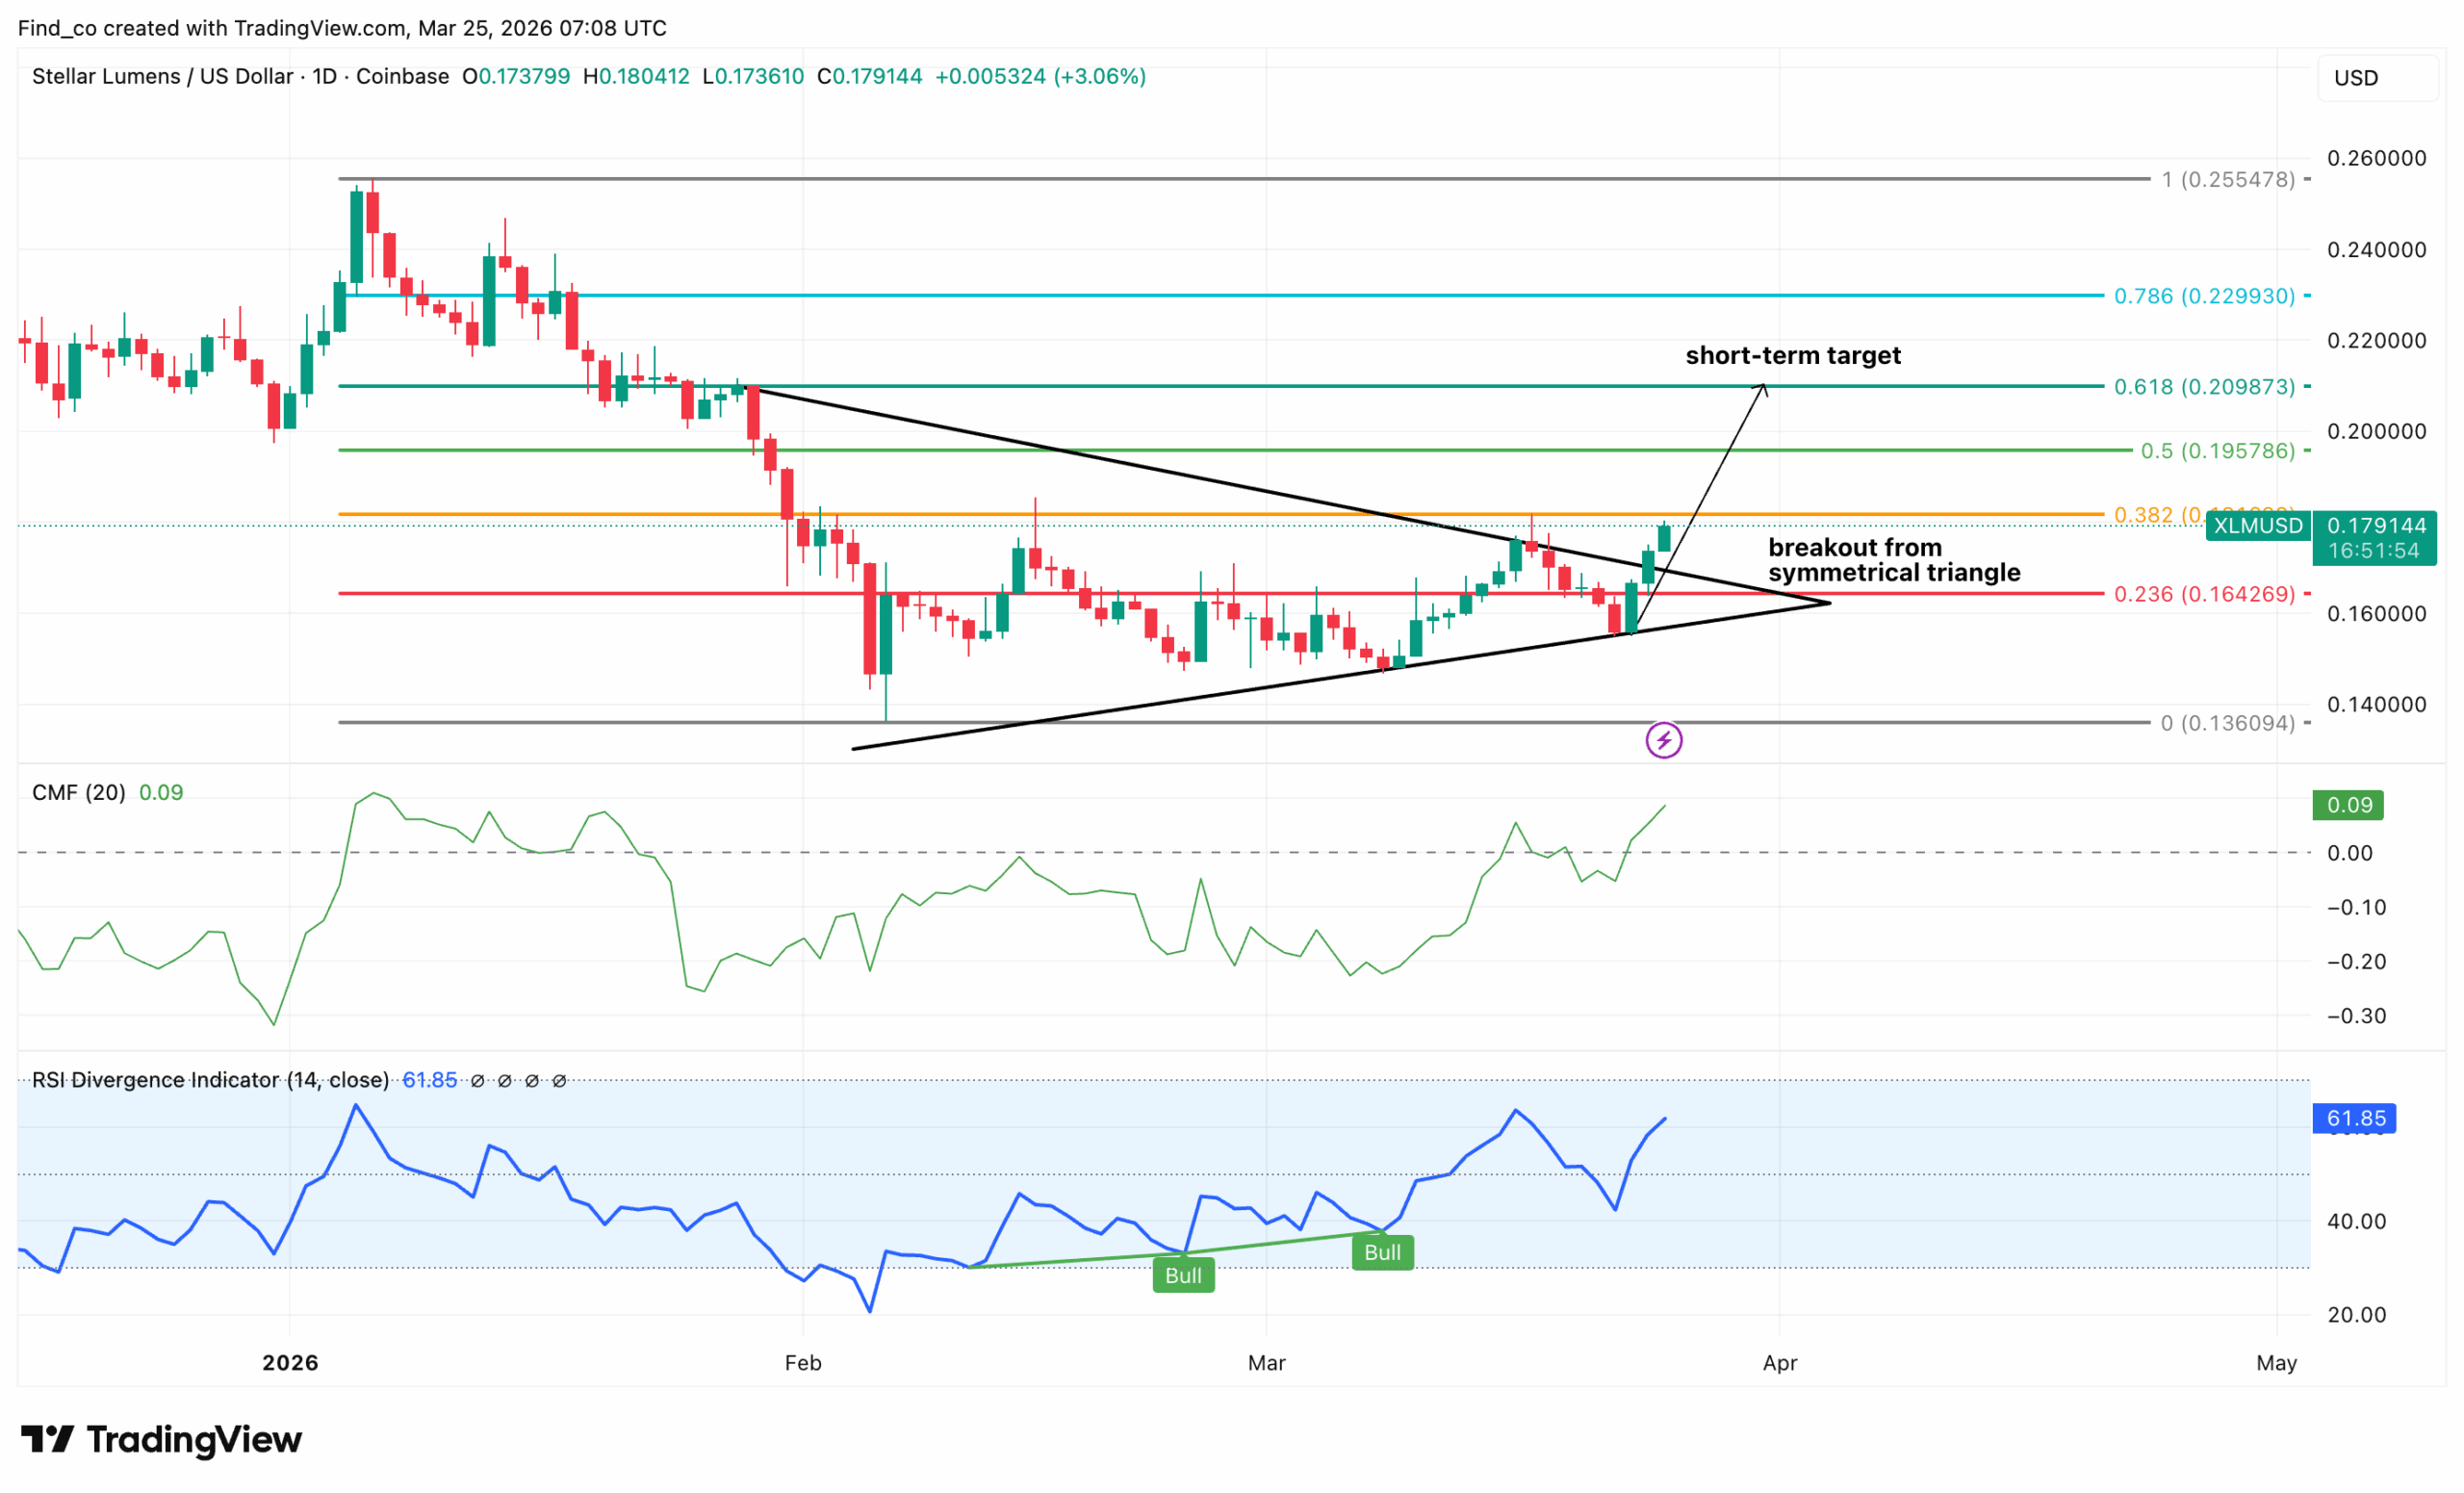
On the daily chart, the technical structure of the XLM/USD pair confirms this is far more than a routine bounce.
A symmetrical triangle formed throughout February and March, compressing the Stellar coin price between converging trendlines as bulls and bears fought to exhaustion.
That standoff has now been resolved in favor of the upward position. Notably, XLM’s price broke above the upper boundary, suggesting that the rally could extend beyond current levels.
Two RSI bullish divergence signals fired during the triangle’s formation, with each flagging that downside momentum was quietly fading even as price grinded sideways.
The RSI has since surged to 61.85, with room to rise before reaching overbought levels.
Meanwhile, the Chaikin Money Flow (CMF) reads +0.09 — the first sustained positive reading in months. This indicates that capital is flowing back into XLM, and the timing aligns perfectly with the breakout candle.
Should this trend persist, the short-term target could be near the 0.618 Fibonacci level at $0.21.
Beyond that, the 0.786 level at $0.23 represents the next meaningful resistance.
However, the immediate priority for bulls is holding $0.1643 (the 0.236 Fibonacci level) as support on any pullback.
Losing it would invalidate the breakout. In that scenario, XLM’s price might slide below the lower trendline of the symmetrical triangle and trade below $0.15.
CLARITY Act Has a Role to Play
This is where Stellar’s story gets genuinely high-stakes. The CLARITY Act is approaching a Senate decision point, and XLM stands directly in its path — for better or worse.
If the bill passes, the impact on XLM is significant and immediate. XLM benefits directly from the CLARITY Act because commodity classification ends the SEC enforcement overhang, and a grandfather clause would treat XLM as a commodity tied to spot ETFs listed before January 1, 2026.
In a CLARITY Act passage scenario, $0.30 becomes the next major target as institutional flows begin.
If the bill fails or stalls past May, the picture changes sharply. Galaxy Digital warns that if the bill does not pass the committee by the end of April, it will likely be delayed until after the 2026 midterm election.
XLM, without the ETF pathway and without confirmed commodity status being codified in law, risks sliding back toward the $0.15 support zone, erasing much of March’s hard-won gains
Disclaimer:
The information provided in this article is for informational purposes only. It is not intended to be, nor should it be construed as, financial advice. We do not make any warranties regarding the completeness, reliability, or accuracy of this information. All investments involve risk, and past performance does not guarantee future results. We recommend consulting a financial advisor before making any investment decisions.
Victor Olanrewaju is a crypto analyst and reporter at CCN with deep roots in on-chain research and technical analysis. His crypto journey began in 2017, but it was the 2020 Uniswap airdrop that sparked a full-time pivot into the space.
With a foundation in copywriting, Victor honed his craft creating high-converting content for leading crypto brokers — most notably an XRP price prediction that ranked #1 on Google during the 2021 bull run.
He later joined AMBCrypto in 2022, where he combined storytelling with technical and on-chain analysis to cover key market narratives.
In 2024, he expanded his expertise at BeInCrypto, collaborating with analysts and using tools like Glassnode, Santiment, and IntoTheBlock to break down Bitcoin and altcoin trends.
At CCN, Victor covers the top cryptocurrencies, memecoins, macro shifts, blending real-time insights with deep-dive metrics.
He holds a Bachelor’s degree in Physics from the University of Ibadan, equipping him to simplify complex data for a wide audience. Follow his work or connect on LinkedIn or X.