Here is why ETH could breach $2,700 soon | Credit: Hameem Sarwar
Share
Key Takeaways
Ethereum is showing bullish signals, such as rising activity, declining exchange reserves, and increased staking.
On-chain metrics suggest growing demand and accumulation, supporting a potential move toward $2,700.
However, if supply increases or support fails, ETH could face selling pressure and drop back toward $2,000.
Not every Ethereum (ETH) rally announces itself.
In fact, some of the biggest moves in ETH’s history began with subtle shifts in data that most retail investors overlooked entirely.
Right now, three key Ethereum metrics suggest another such moment may be approaching.
Sponsored
Disclosure
We sometimes use affiliate links in our content, when clicking on those we might receive a commission at no extra cost to you. By using this website you agree to our terms and conditions and privacy policy.
Today, that has changed, as the cryptocurrency’s value has breached the $2,200 resistance following a 17% price surge over the past 30 days.
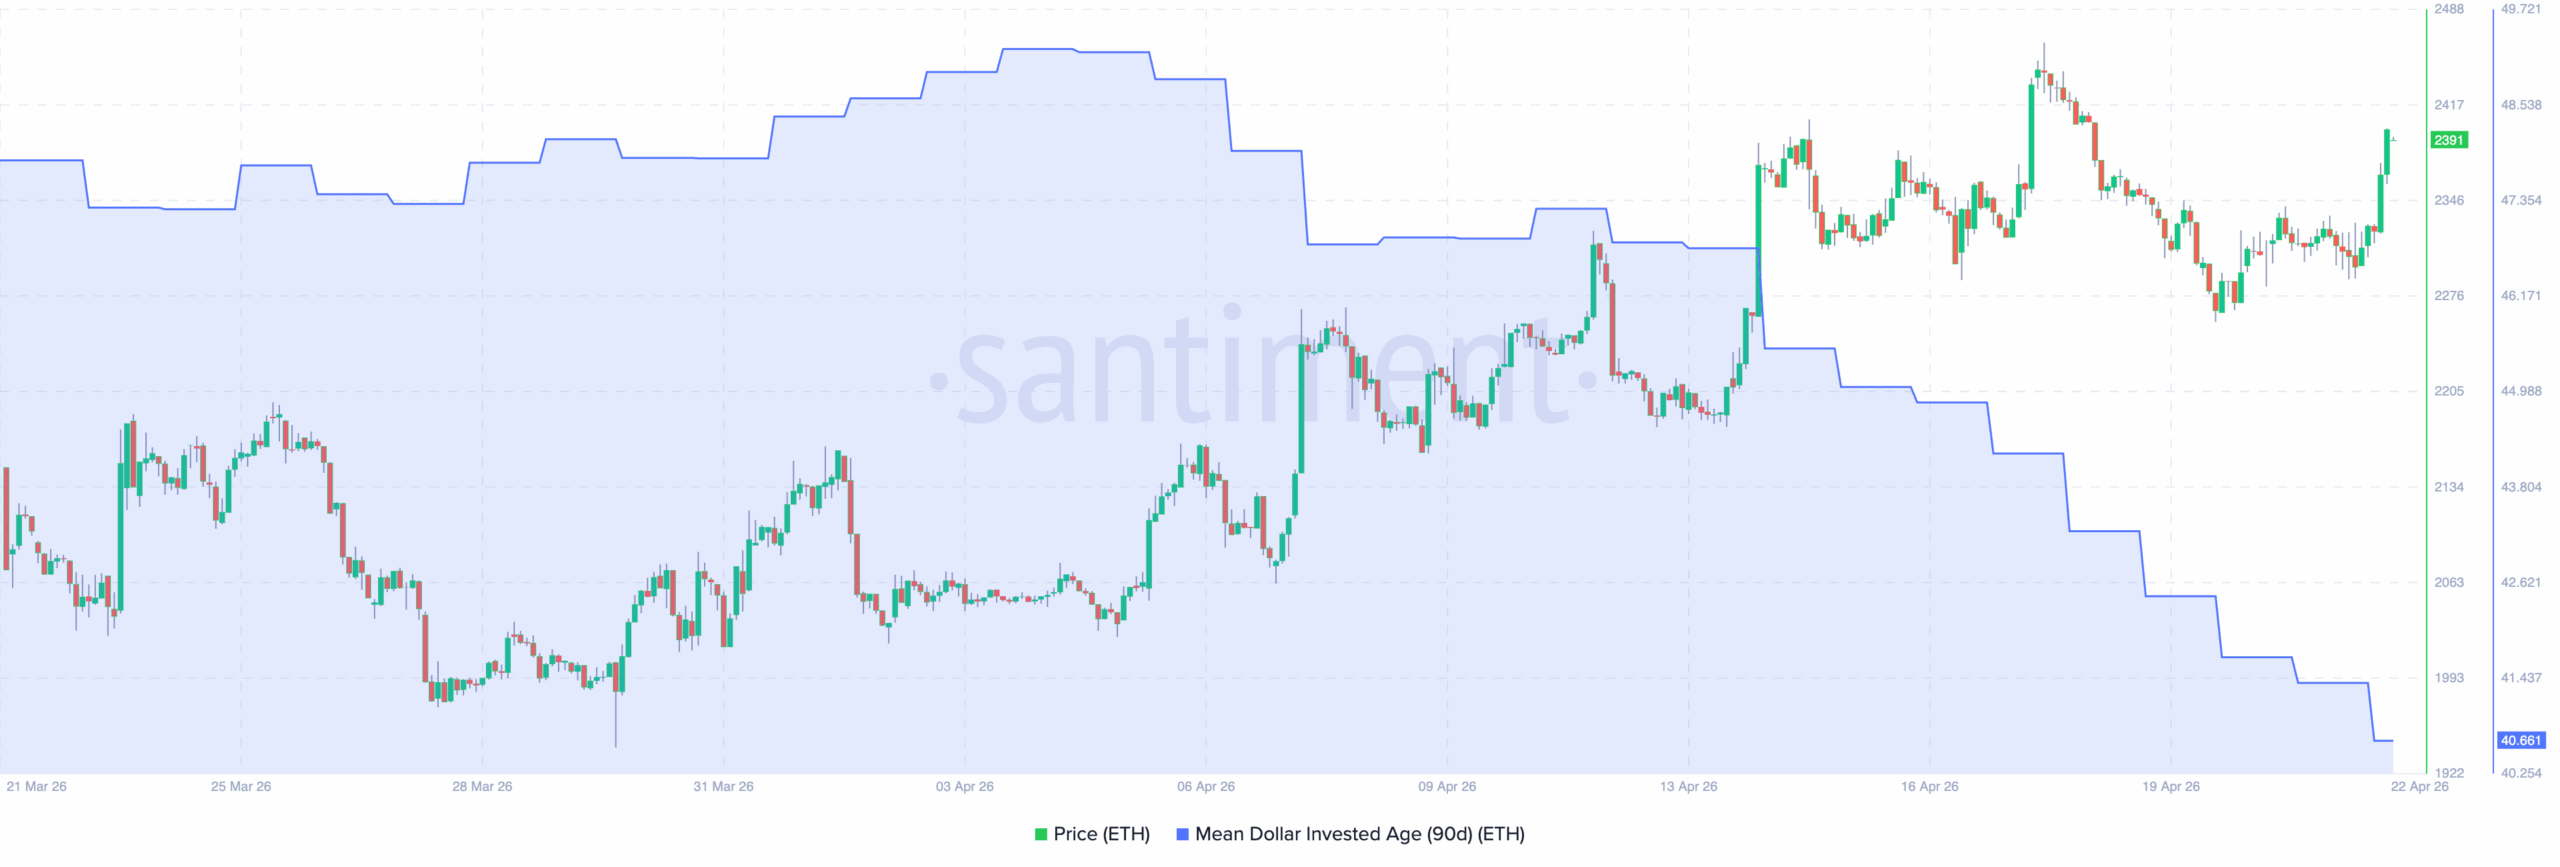
Interestingly, that move has also extended to on-chain signals. To start with, CCN examines the 90-day Mean Dollar Invested Age (MDIA).
As shown below, Ethereum’s price has been rising while the 90-day MDIA has been falling. This combination usually signals that older coins are starting to move again.
Factually, a declining MDIA means the average age of the coins held over time is getting younger.
In practice, it has been suggested that previously dormant capital was re-entering circulation.
Because prices have been rising at the same time, this hasn’t looked like pure weakness.
Instead, it has been showing that fresh activity and rotation were supporting the ETH rally.
However, the drop in MDIA also means more coins have become active, potentially increasing available supply.
If that activity keeps rising while demand slows, ETH could face distribution pressure even after the rally.
So far, price has been holding firm while MDIA has been trending lower.
If this rotation continues and buyers keep absorbing supply, Ethereum’s price could keep pushing higher toward $2,500.
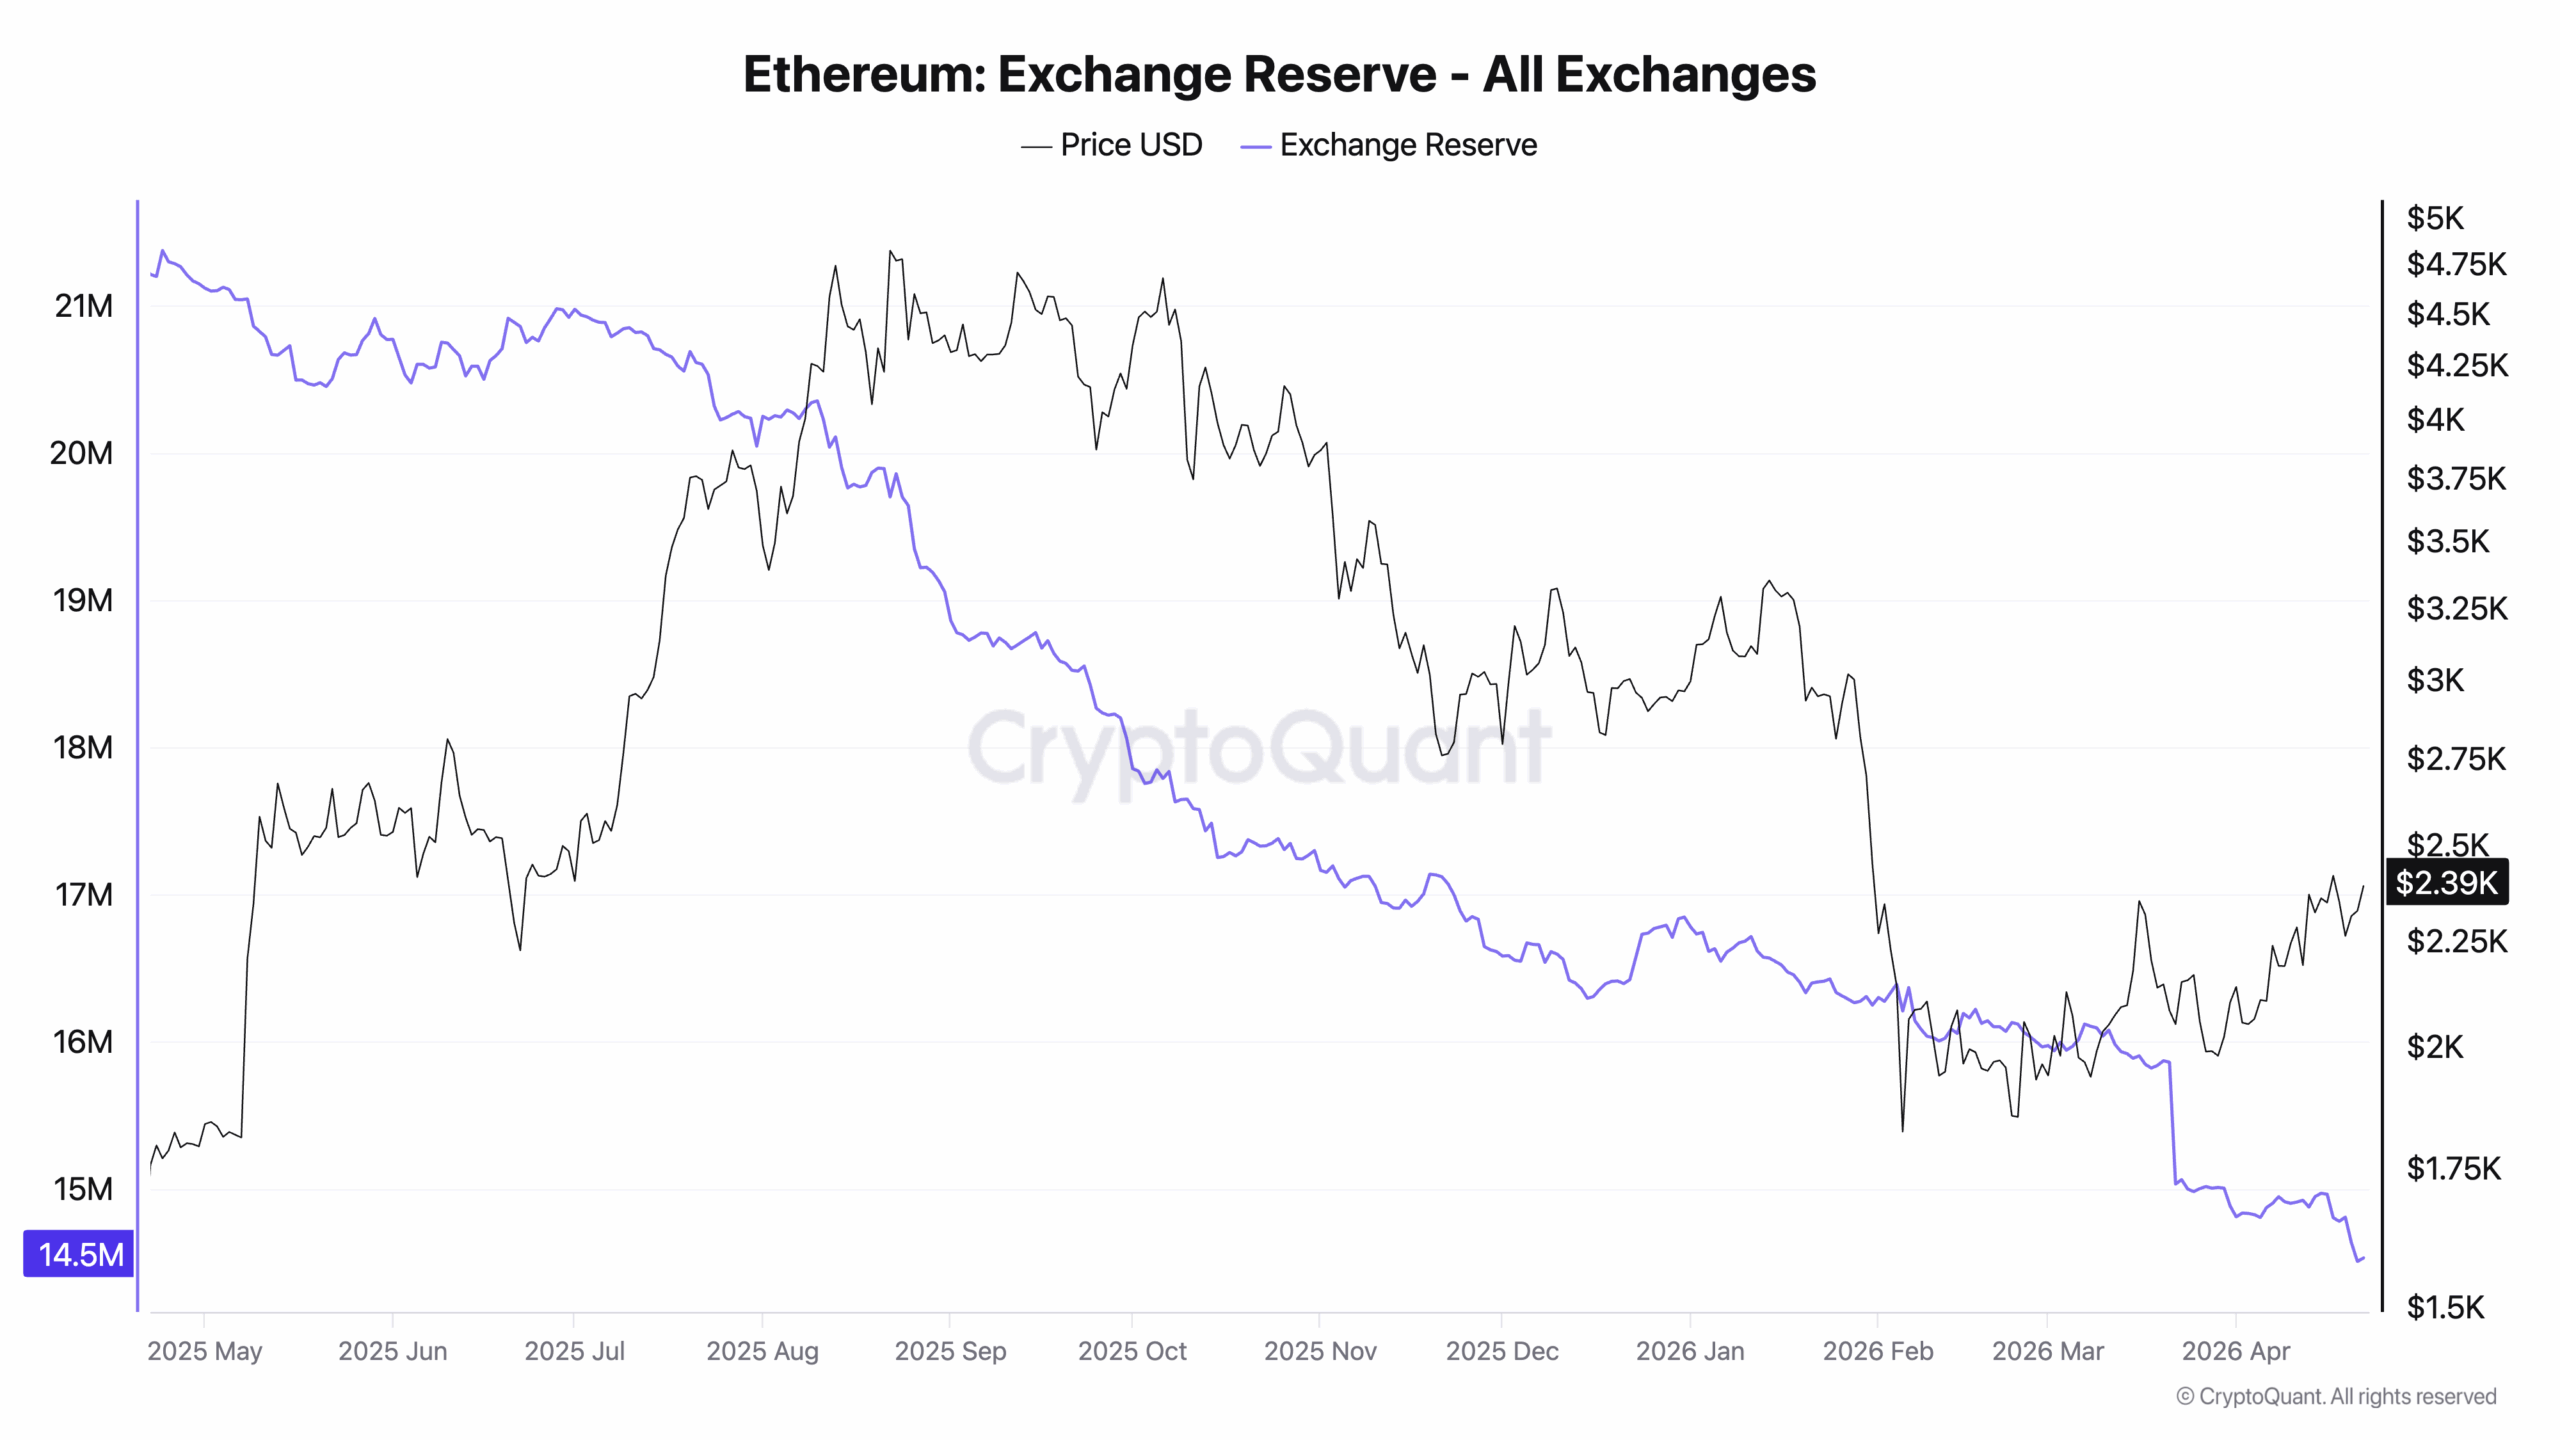
ETH Exchange Reserves Decline
To add to that, Ethereum exchange reserves have been steadily declining, and they are still trending lower even as the price has been recovering toward $2,400.
Factually, this means ETH has been moving off exchanges into private wallets or for staking, reducing immediate sell-side liquidity.
In that case, ETH could struggle and revisit $2,000 psychological support.
But for now, the declining reserve has been supporting the recovery, and the structure has been leaning bullish as long as that outflow trend persists.
More Staking, Higher Value
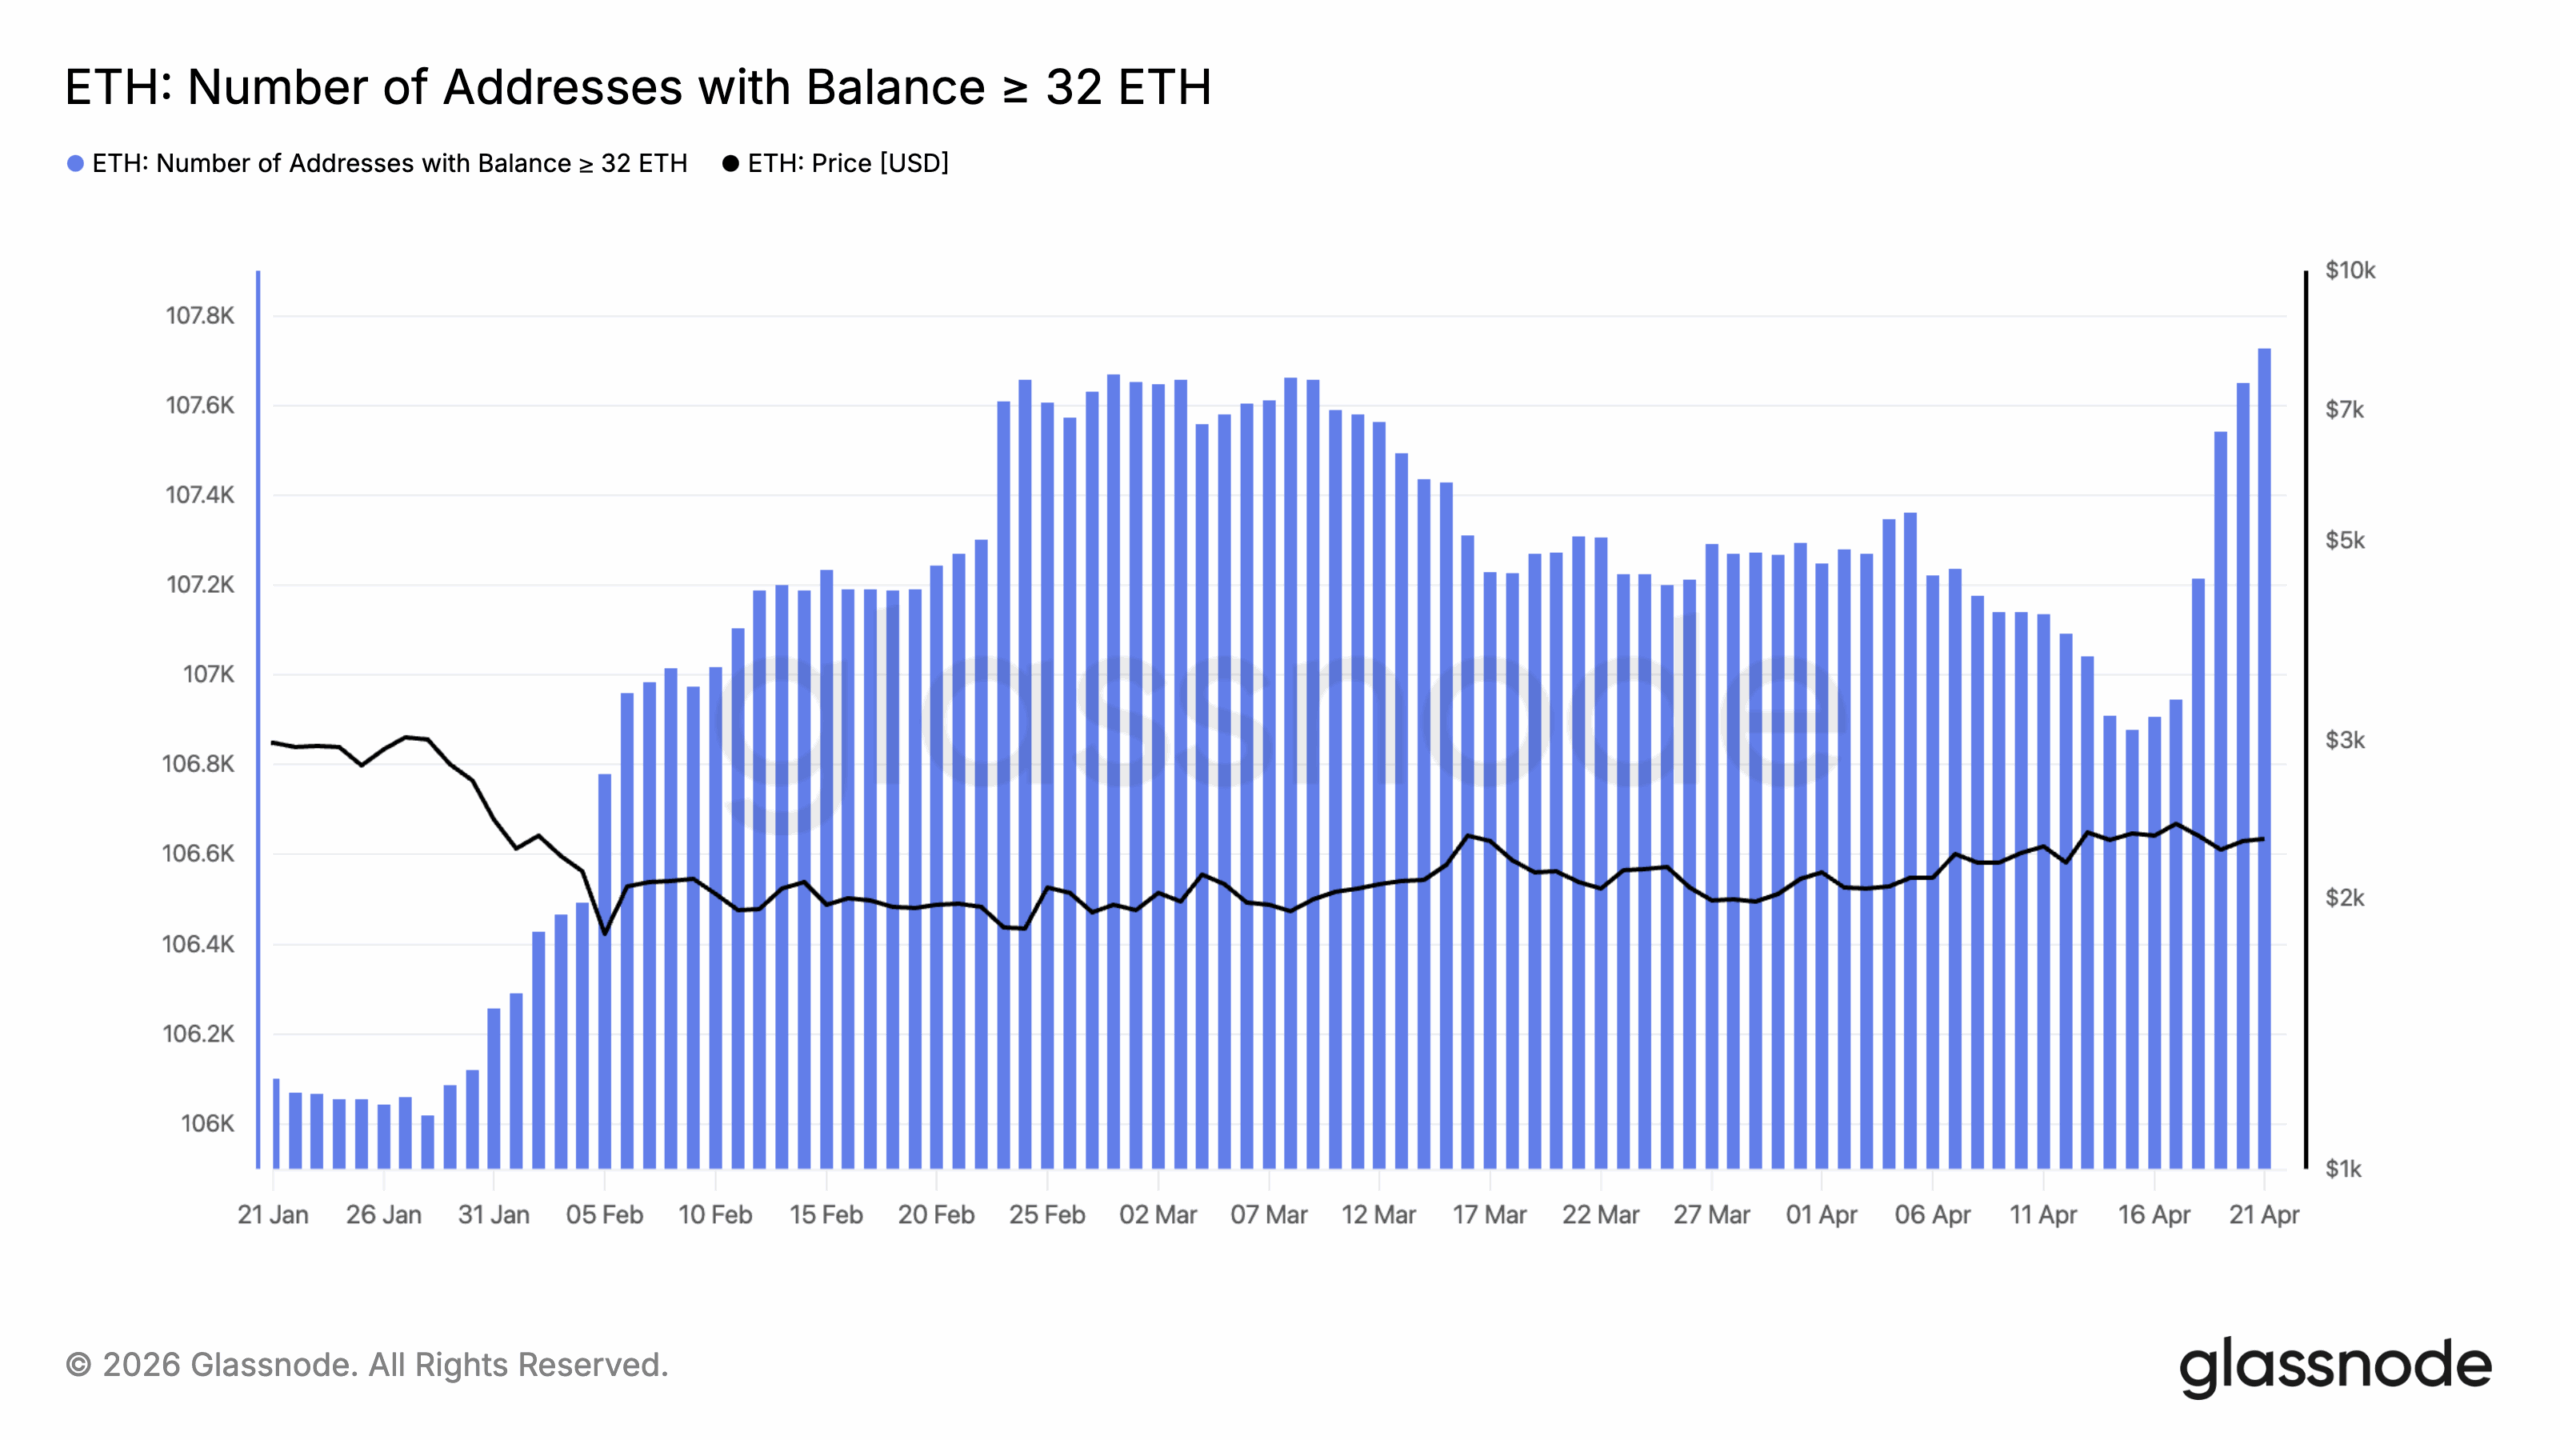
Beyond that, the number of addresses holding ≥32 ETH has been rising again after a brief period of stagnation and slight decline.
This rise suggests that larger holders or validators have been accumulating or consolidating into 32 ETH units (a key staking threshold).
That behavior has typically reflected long-term positioning rather than short-term speculation, meaning supply has been getting locked or held with lower intent to sell.
The recent spike in these addresses indicates fresh accumulation or redistribution into staking-sized wallets.
Number of Addresses with Balance ≥ 32 ETH | Credit: Glassnode
This has been supportive structurally, as it reduces circulating supply and signals confidence from larger participants. History also seems to support this trend.
So, if this trend continues, ETH could push higher and close in on the $3,000 region, as reduced liquid supply meets steady demand.
ETH Price Prediction: Breakout Imminent
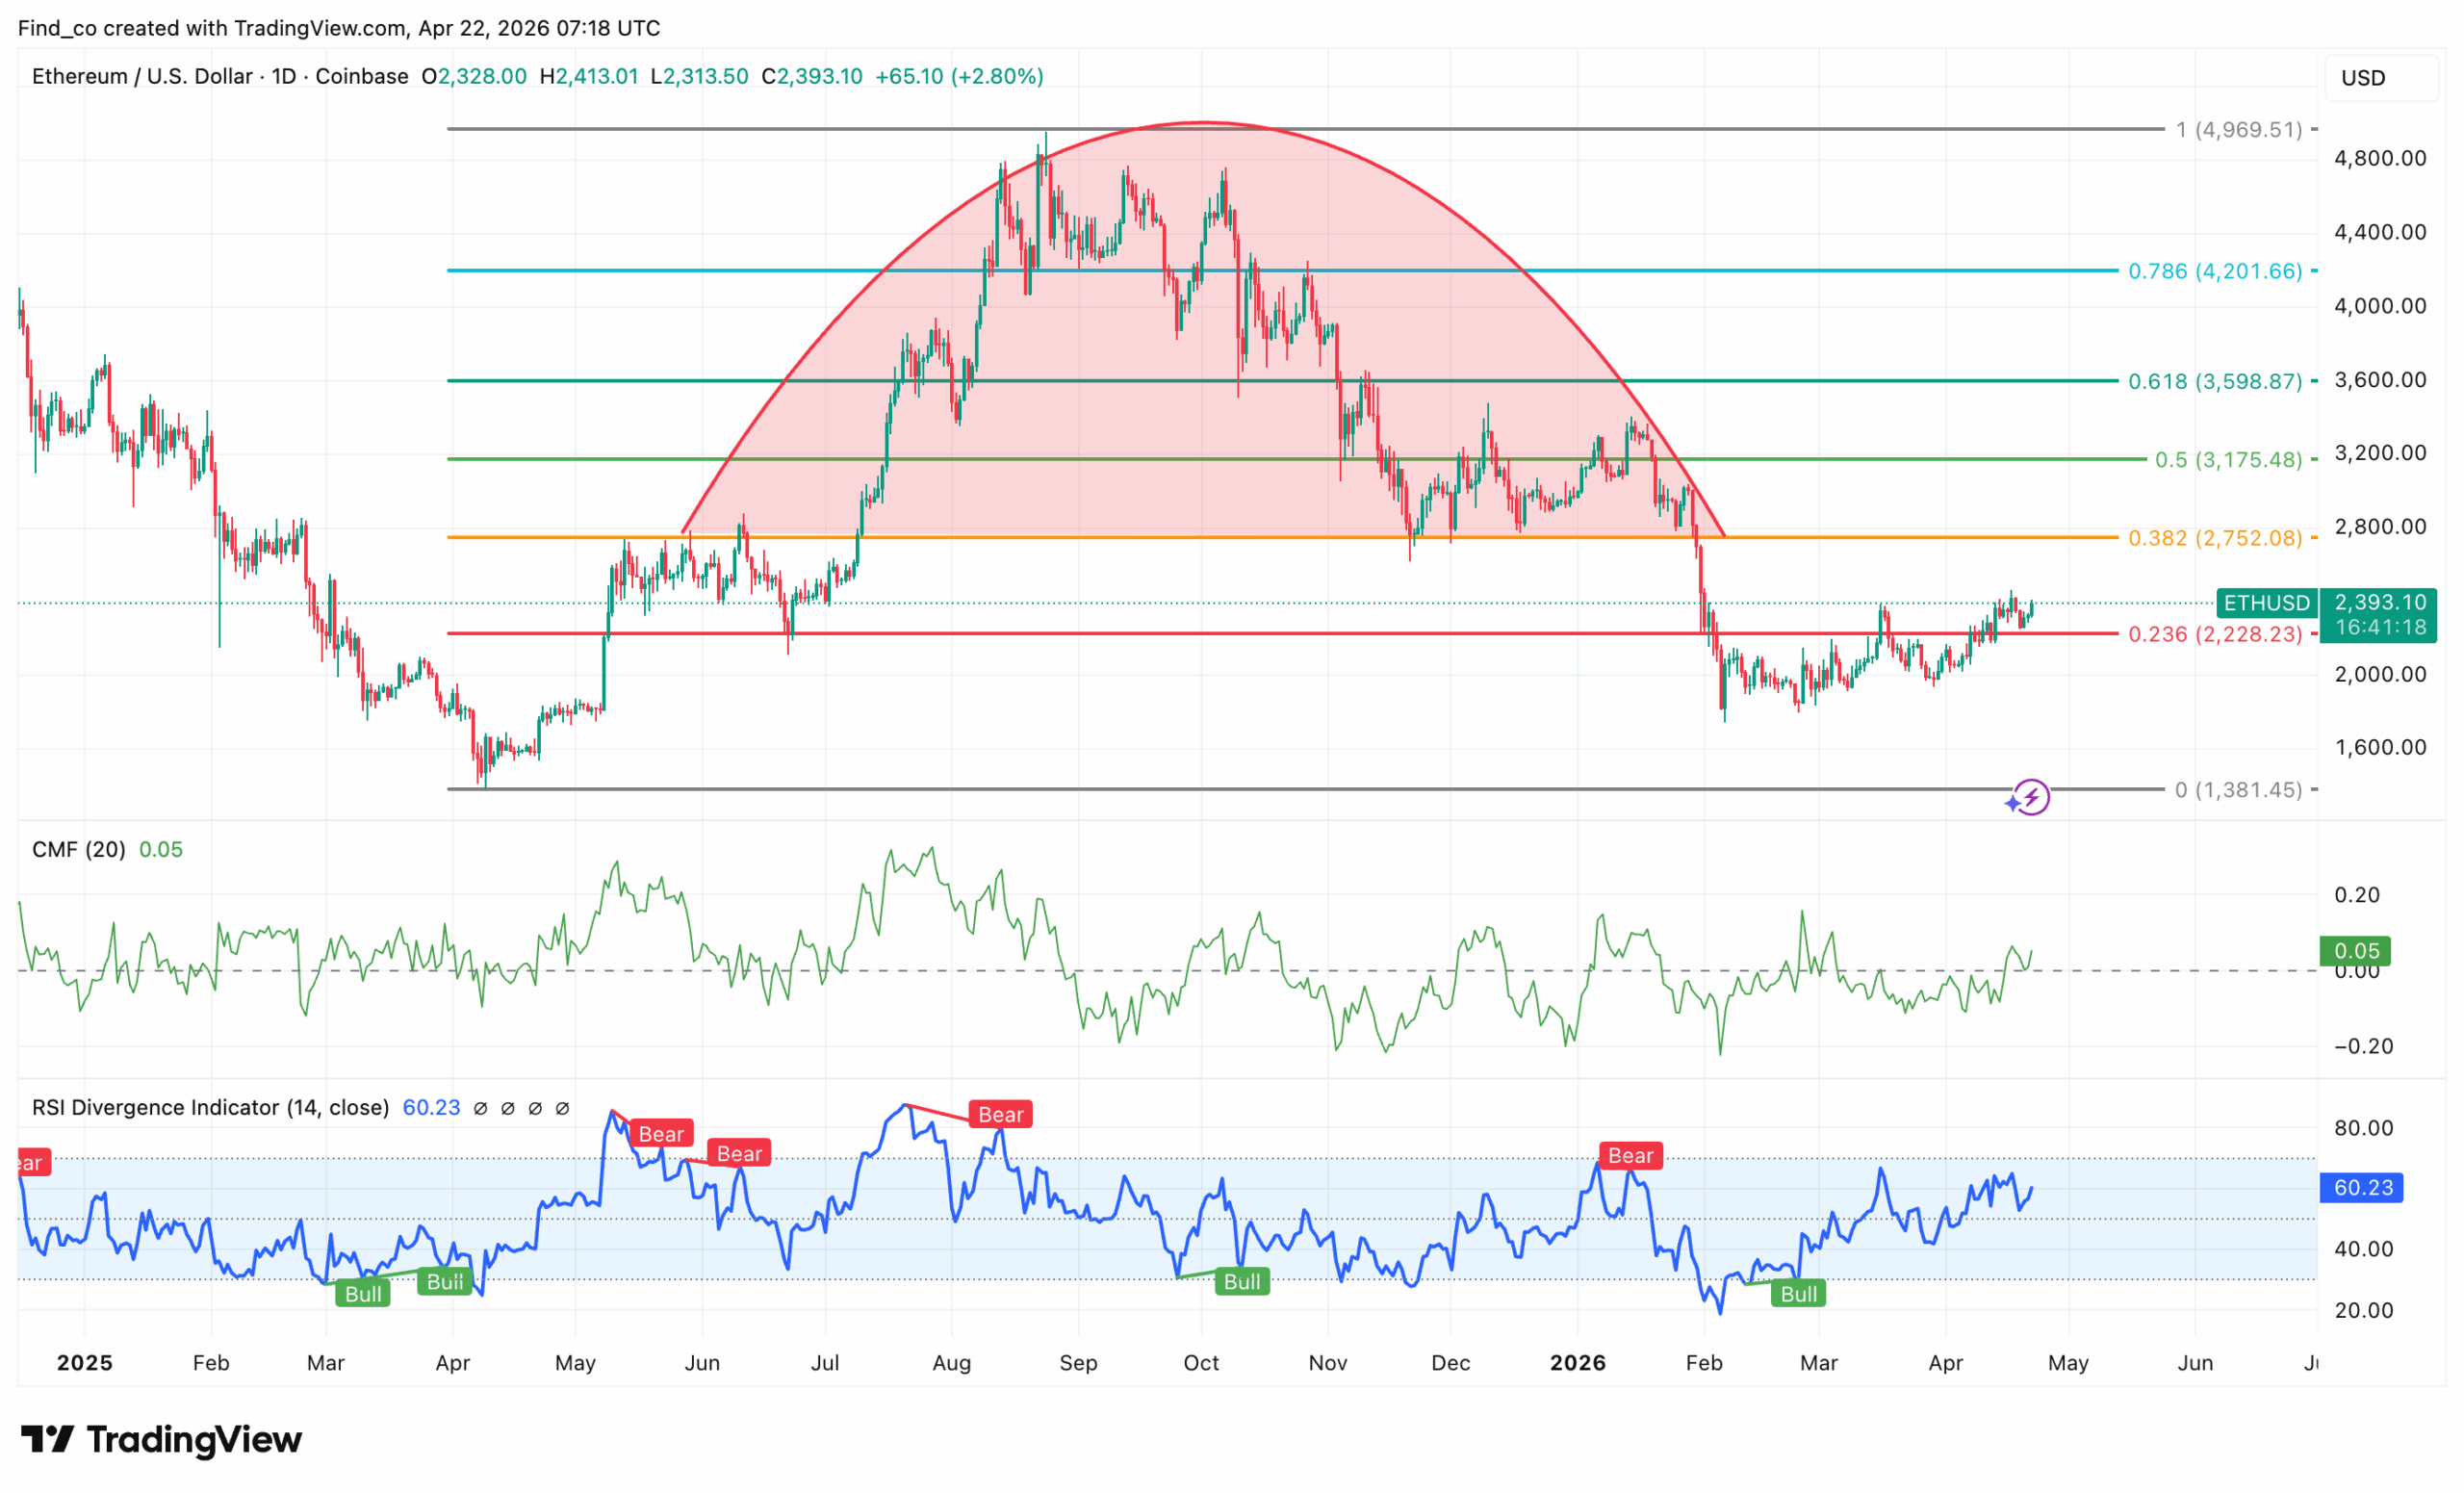
From a technical perspective, the daily chart shows that ETH has already completed a large rounded top structure, and the price had broken down below key mid-range levels before recently stabilizing around the 0.236 Fib.
As shown below, Ethereum’s price is recovering slightly and holding above this support level.
At the same time, the Chaikin Money Flow (CMF) is turning mildly positive, suggesting some capital inflow.
Apart from that, the Relative Strength Index (RSI) has been pushing toward the 60 level, indicating strengthening momentum but not yet overbought conditions.
However, the broader structure is still corrective, as ETH’s price remains below the 0.382 near $2,752 and 0.5 $3,175 resistance levels.
If buyers continue defending the $2,228 region, ETH could move toward $2,752 in the near term.
A confirmed break above that level would open a move toward the 0.618 golden pocket ratio at $3,598.
On the downside, if this recovery fails and the price breaks key support, it could revisit $2,000, as that area previously served as the base after the breakdown.
Disclaimer:
The information provided in this article is for informational purposes only. It is not intended to be, nor should it be construed as, financial advice. We do not make any warranties regarding the completeness, reliability, or accuracy of this information. All investments involve risk, and past performance does not guarantee future results. We recommend consulting a financial advisor before making any investment decisions.
Victor Olanrewaju is a crypto analyst and reporter at CCN with deep roots in on-chain research and technical analysis. His crypto journey began in 2017, but it was the 2020 Uniswap airdrop that sparked a full-time pivot into the space.
With a foundation in copywriting, Victor honed his craft creating high-converting content for leading crypto brokers — most notably an XRP price prediction that ranked #1 on Google during the 2021 bull run.
He later joined AMBCrypto in 2022, where he combined storytelling with technical and on-chain analysis to cover key market narratives.
In 2024, he expanded his expertise at BeInCrypto, collaborating with analysts and using tools like Glassnode, Santiment, and IntoTheBlock to break down Bitcoin and altcoin trends.
At CCN, Victor covers the top cryptocurrencies, memecoins, macro shifts, blending real-time insights with deep-dive metrics.
He holds a Bachelor’s degree in Physics from the University of Ibadan, equipping him to simplify complex data for a wide audience. Follow his work or connect on LinkedIn or X.