Ethereum is holding key support near $1,700 as analysts eye a potential rally toward $4,630 thanks to several factors. | Credit: CCN.com
Share
Key Takeaways
Ethereum long-term holders have substantial unrealized losses following the price crash.
Realized price is below the spot value, indicating that ETH could soon reverse the trend.
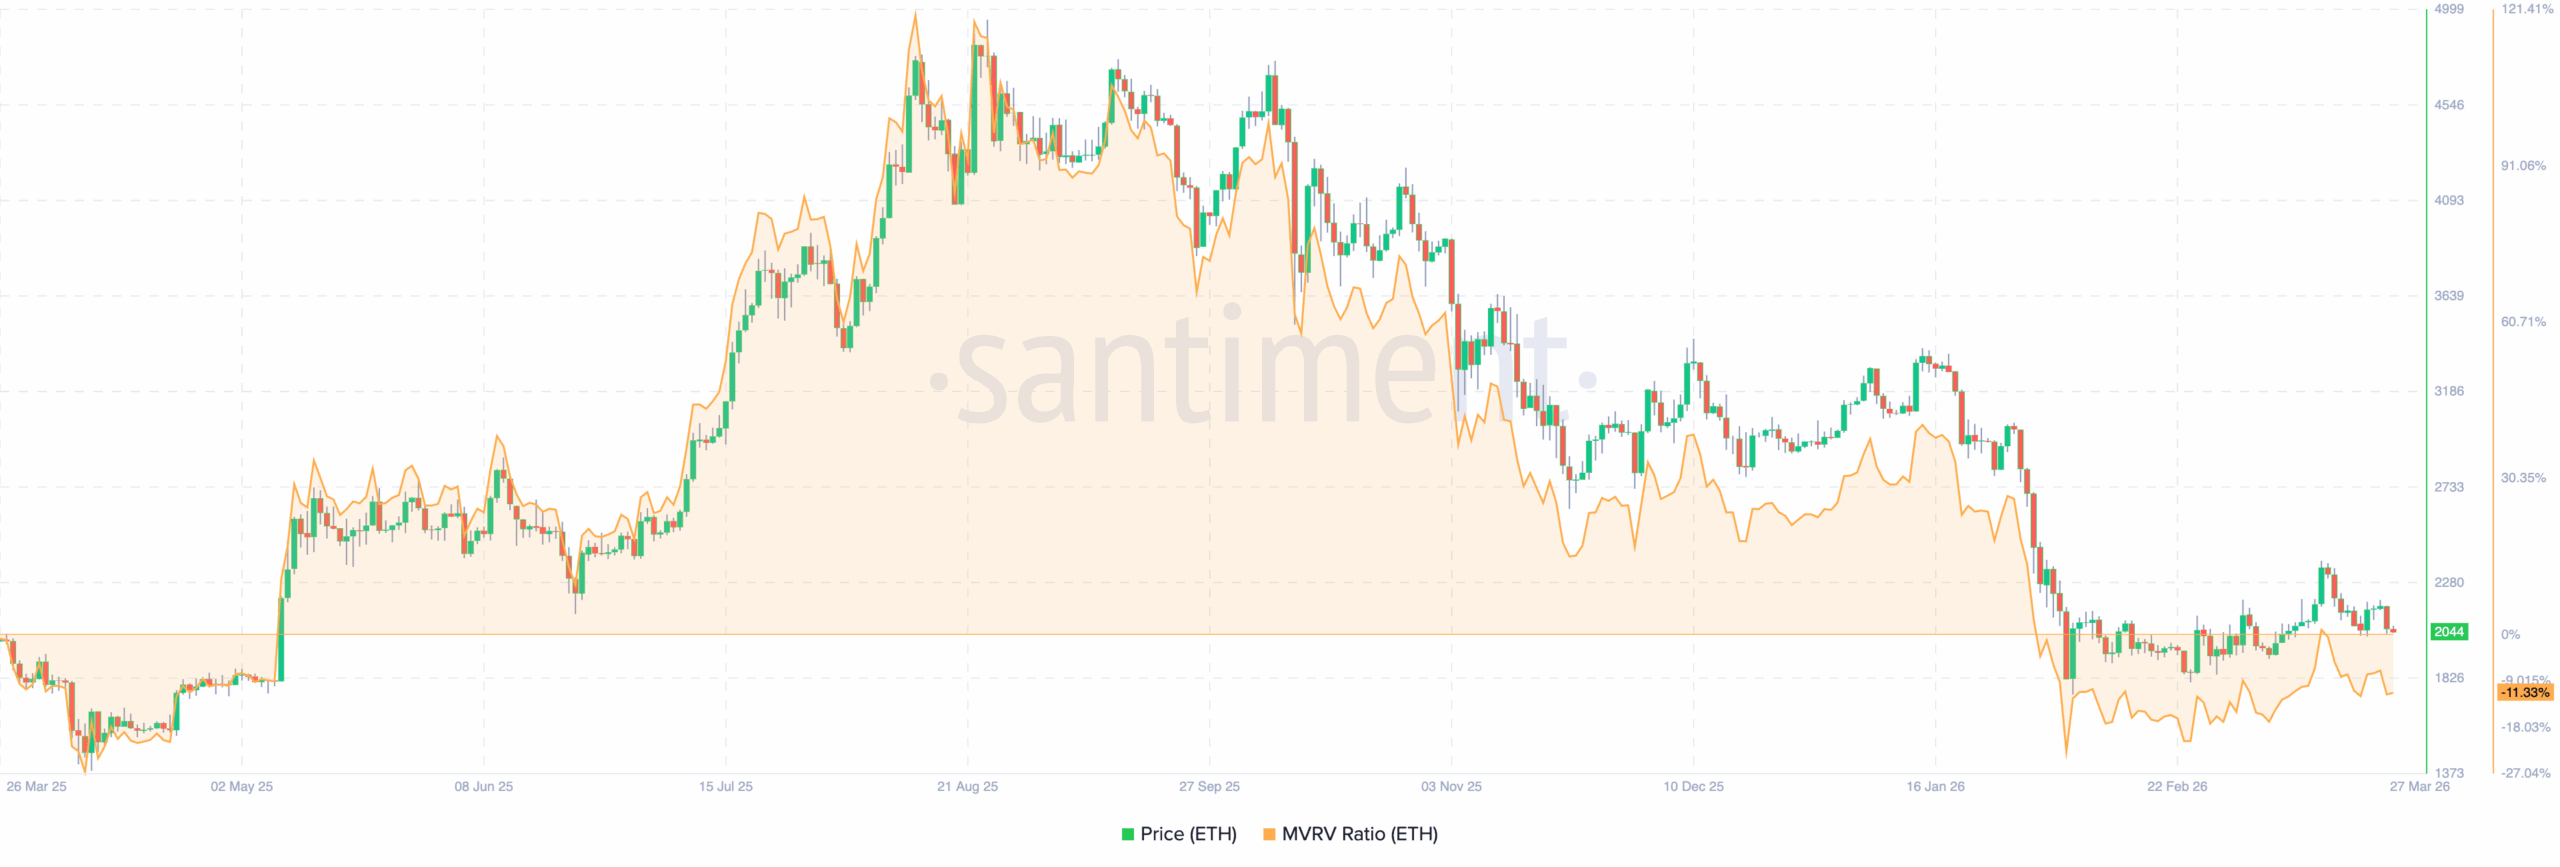
Retail activity has plummeted; however, the MVRV ratio shows ETH is undervalued.
Ethereum’s (ETH) price has shed roughly 60% from its 2025 peak.
For this reason, long-term holders are barely above water, and the average market participant is sitting on a loss.
Yet, buried inside all that pain, history is whispering something familiar —this is exactly what bottoms look like.
Four critical on-chain and sentiment metrics converge at this moment to paint one of the most important Ethereum setups in over a year.
Here’s what the data actually says, and what it means for the ETH’s price going forward.
Long-Term Holders Continue to Bleed
Start with the metric that matters most: long-term holders (LTHs).
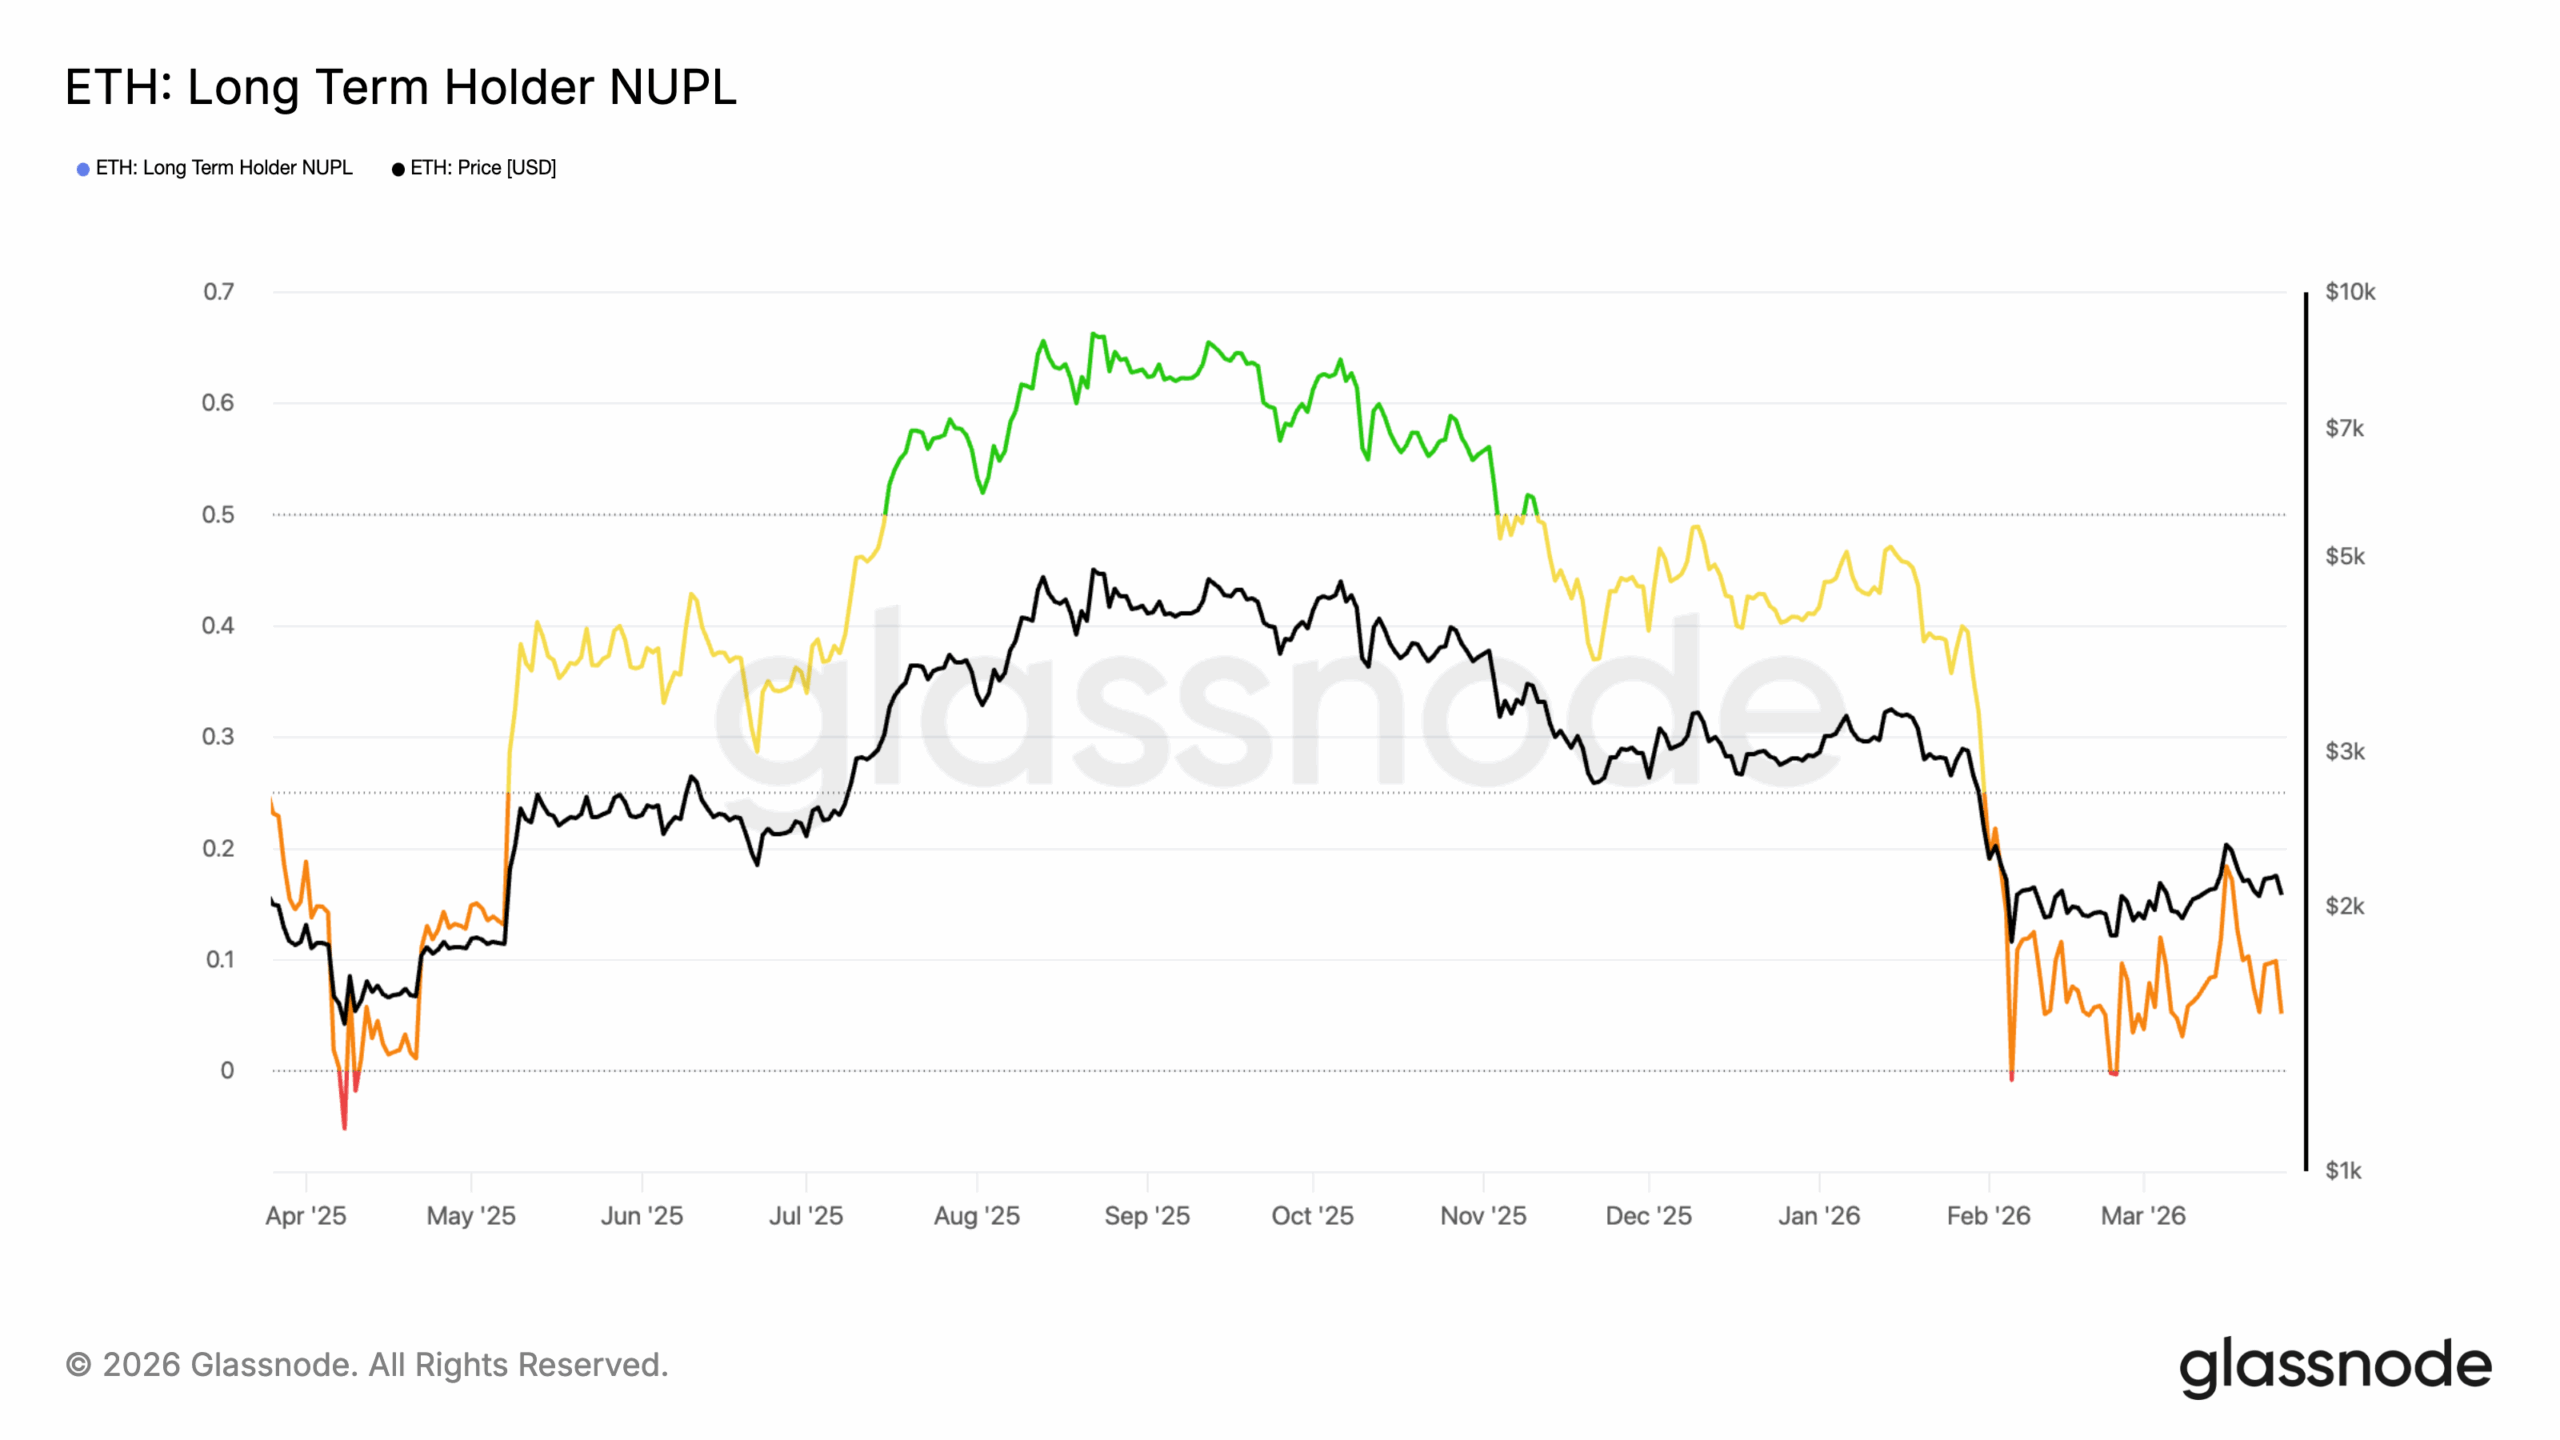
The Net Unrealized Profit/Loss (NUPL) for ETH long-term holders tells us the aggregate profitability of wallets that have held for extended periods.
The chart tells a brutal story. According to Glassnode data, the LTH NUPL peaked in the green “optimism” zone at approximately 0.65 between July and September 2025.
From there, it declined steadily through the yellow “hope” zone and collapsed sharply in February 2026. Today, LTH NUPL sits in the orange zone at roughly 0.05 to 0.15 — barely above zero.
This matters enormously. When LTH NUPL approaches zero, long-term holders are on the edge of being underwater.
But when they even approach breakeven or losses, the market has typically exhausted most of its downside.
Historically, the orange zone has marked either a bottom or the final leg of one.
ETH LTH-NUPL | Credit: Glassnode
Two brief red-zone dips, during which LTHs turned net negative, occurred in early April 2025 and again in February 2026.
Both coincided with price lows. So, if history is anything to go by, Ethereum’s price might have hit the bottom of this cycle.
ETH Is Trading at Cost Basis
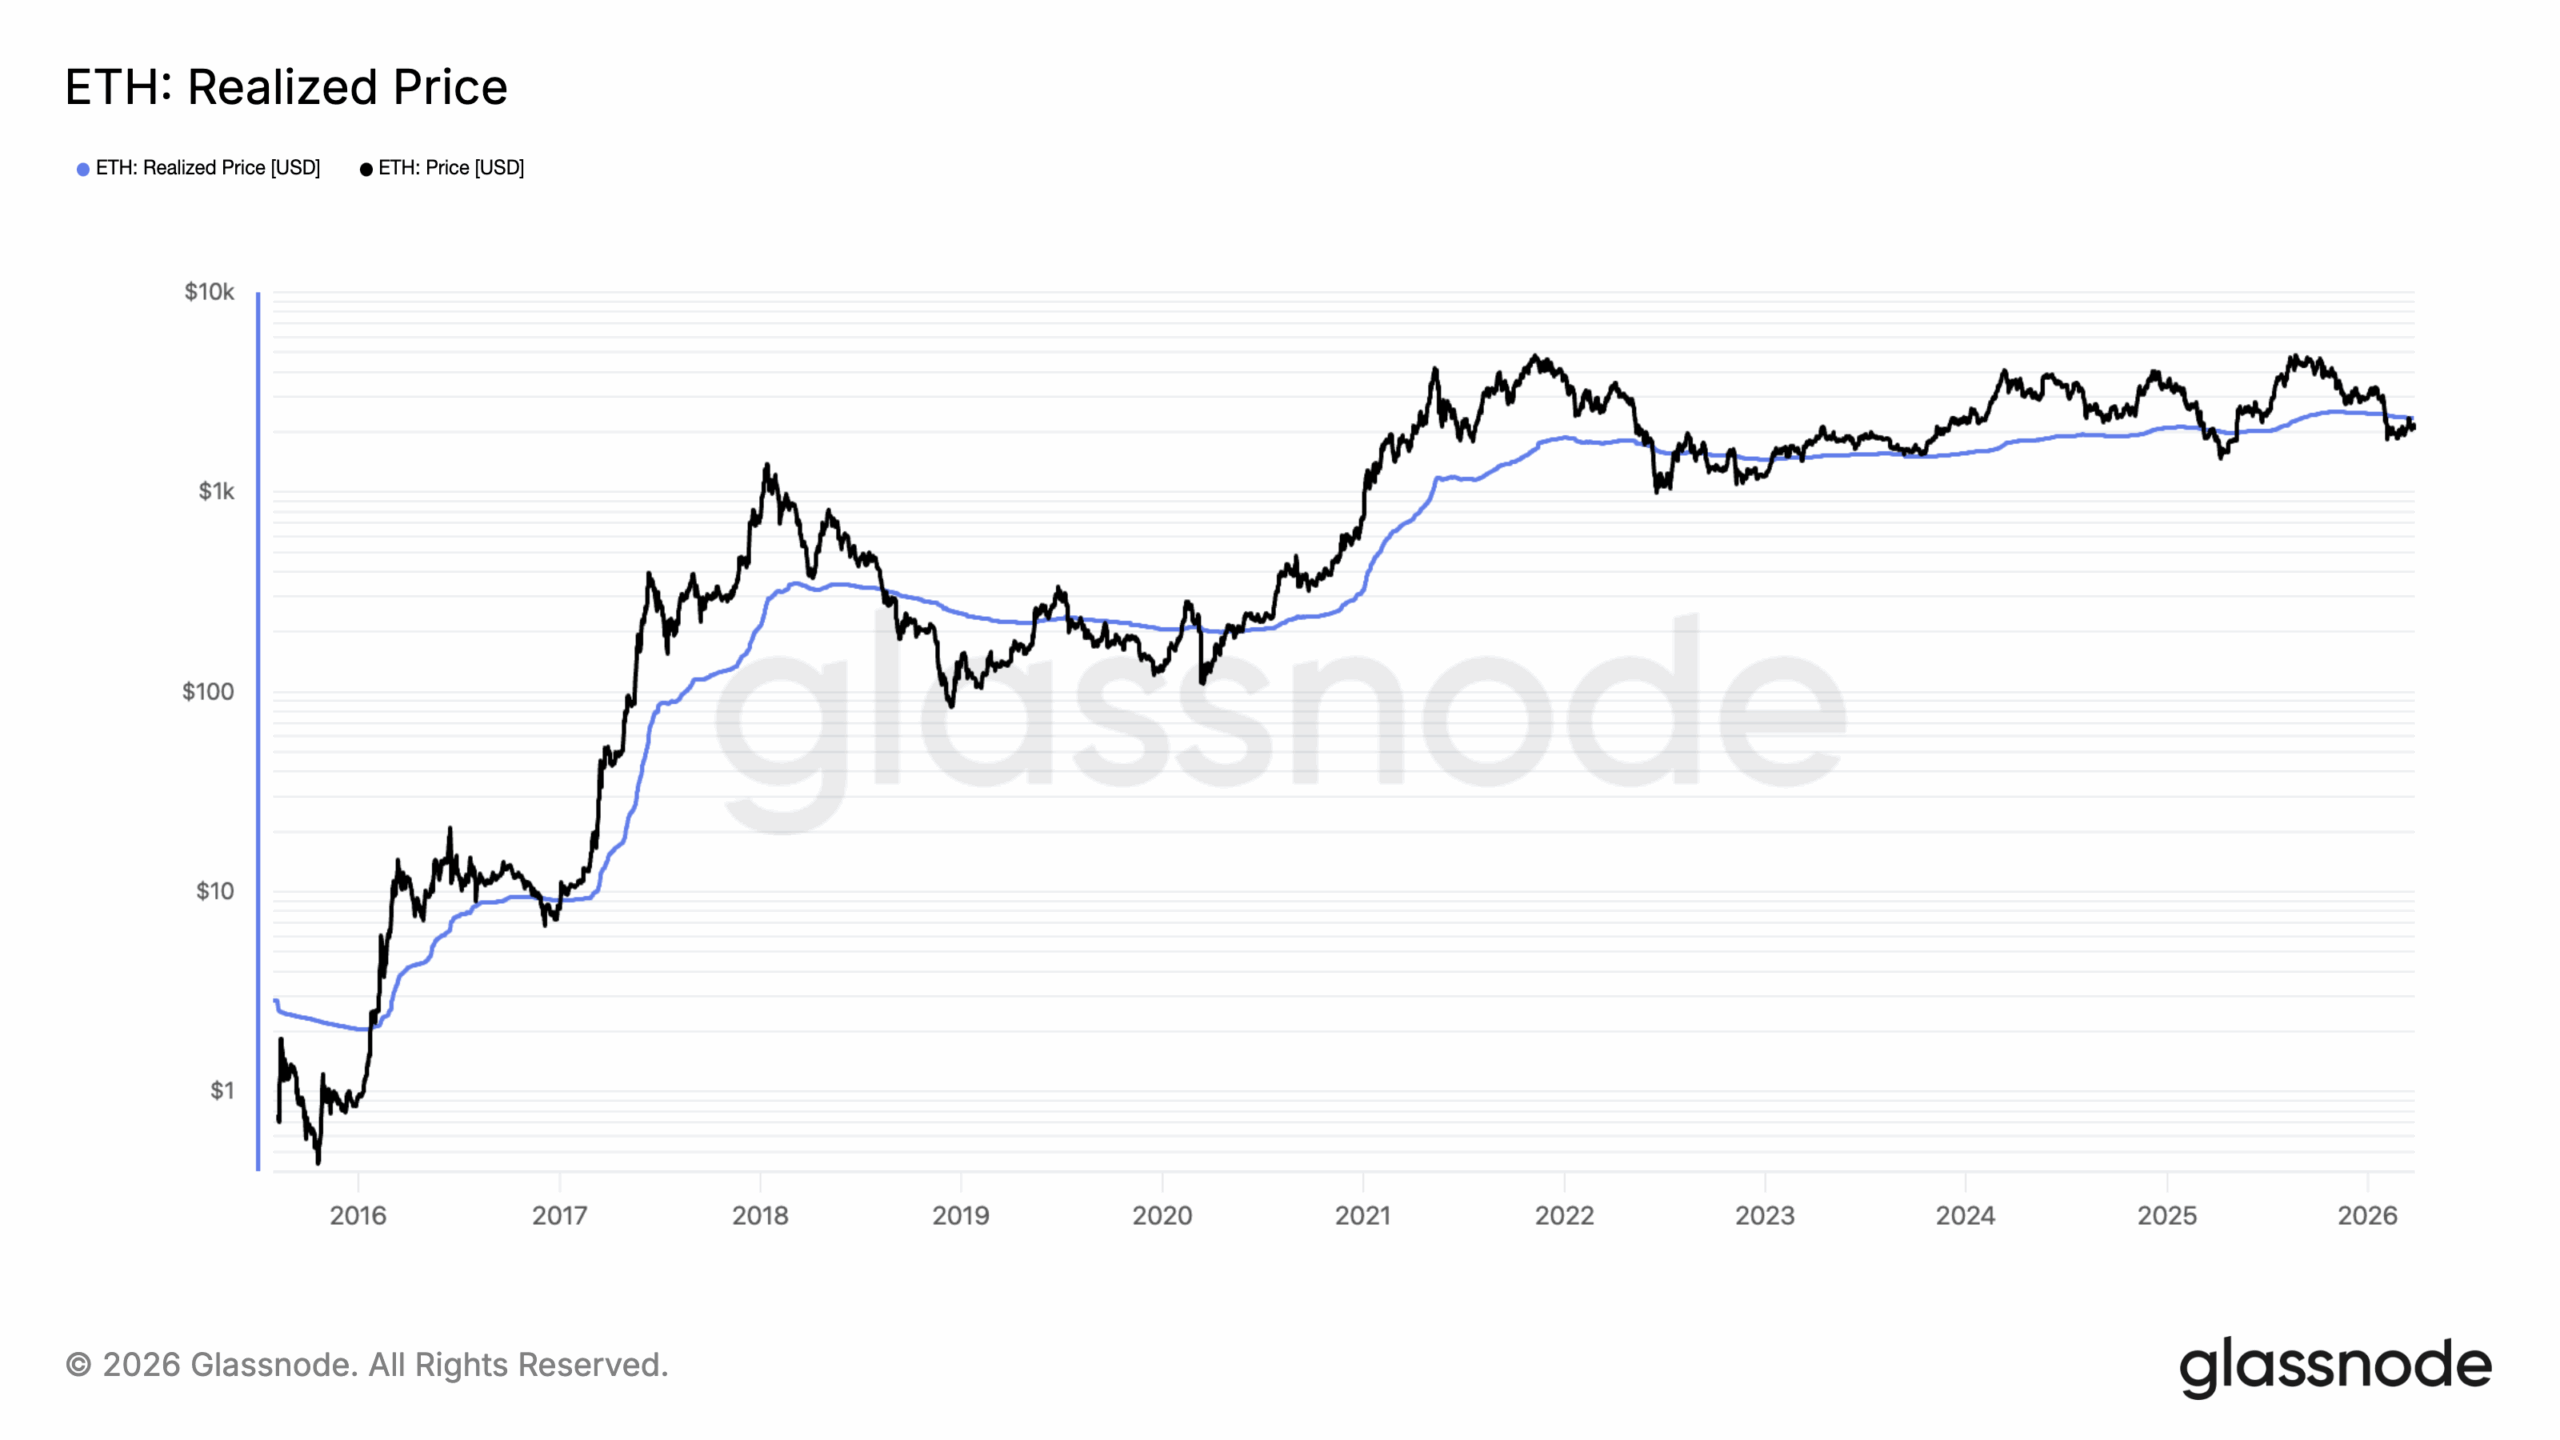
Outside that, the Ethereum realized price chart delivers a rarer and more powerful signal.
The realized price, which is the average price at which each coin last traded on-chain, currently sits between $2,000 and $2,100.
However, ETH’s spot price is trading at roughly $2,044.
That means ETH is essentially trading at its aggregate cost basis. The entire market is at breakeven.
Zoom out on the chart, and this convergence has happened only a handful of times in Ethereum’s history.
In 2018’s bear market, the price crashed through the realized price and stayed below it for months. In 2022, Ethereum’s price fell below the realized price in June and didn’t recover for over a year.
Both periods were painful, but both also represented the deepest accumulation opportunities of their respective cycles.
For price, this is a double-edged signal. On one hand, deeply negative MVRV removes overhead selling pressure — most holders have nothing to protect.
On the other hand, a prolonged stay in negative territory erodes confidence and can delay any meaningful recovery.
Asian Retail Has Left the Building
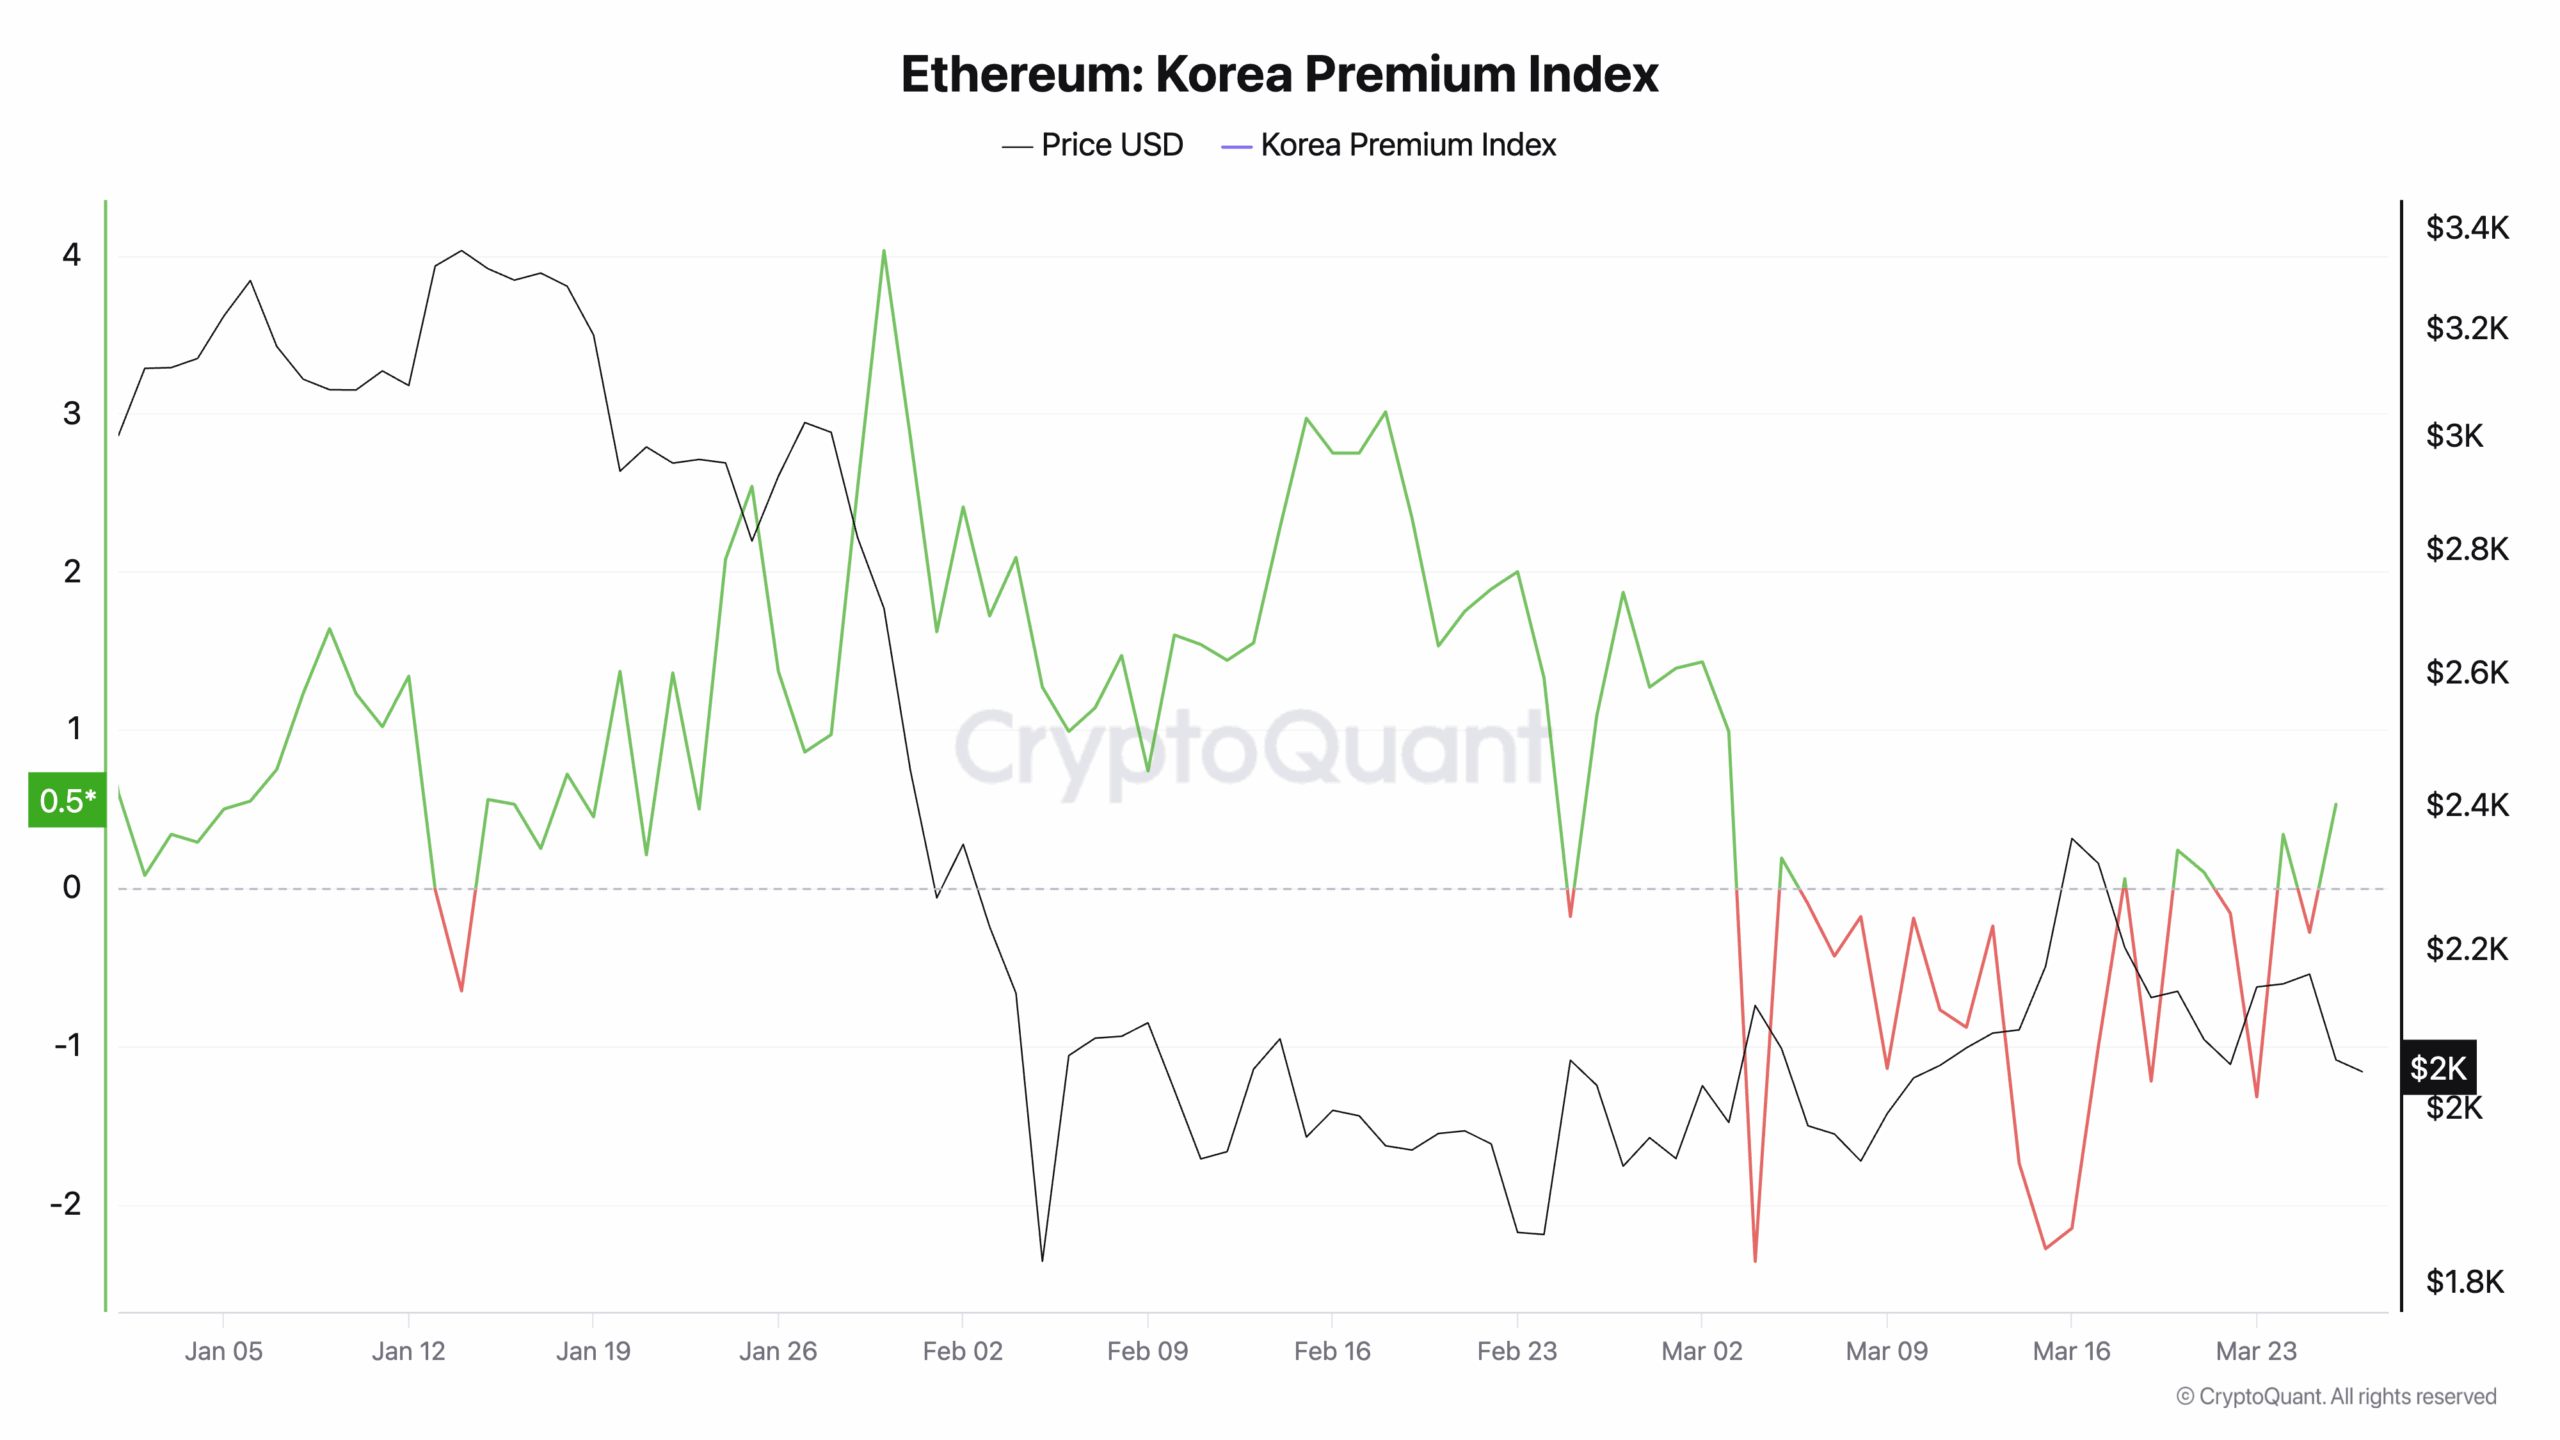
The Korea Premium Index is the sentiment wildcard — and it’s deeply concerning for near-term price action.
In early January 2026, Korea Premium sat at a healthy +3 to +4, indicating that Korean traders were paying a premium over global prices to own ETH. That’s classic retail FOMO. Then the bottom fell out.
It bounced briefly, then collapsed again in mid-to-late February. As of late March 2026, it continues to oscillate between -1 and -2, negative territory.
A negative Korea Premium is a meaningful bearish signal. Korean retail is among the most reactive and sentiment-driven participant groups in crypto.
When they sell at a discount to global prices, it signals fear, not greed. It also signals there is no new demand surge coming from that market in the immediate term.
This is the one metric that challenges a clean bullish reversal narrative.
Even if on-chain data screams “bottom,” a recovery needs buyers. Right now, one of crypto’s most active retail markets isn’t buying, it’s discounting.
The Verdict for ETH Price
Taken together, these four charts paint a coherent picture. Ethereum’s on-chain metrics are deep in capitulation territory. LTH NUPL near zero.
Spot price converging with realized price. MVRV negative.
These are the conditions that, in every prior cycle, preceded significant recoveries.
But the Korea Premium Index injects caution. The demand side remains weak. There is no retail euphoria driving a bid.
A recovery from here won’t be explosive. Instead, it could be slow, grinding, and dependent on a macro or fundamental catalyst that reawakens appetite.
For long-term accumulators, the data argues this is historically one of the better risk/reward windows in the current cycle. For short-term traders, the absence of Korean retail demand warns against expecting an immediate breakout.
ETH at $2,000 isn’t broken. It’s bruised. Whether that bruise heals fast or slow depends entirely on what comes next, but the floor looks firmer by the day.
Disclaimer:
The information provided in this article is for informational purposes only. It is not intended to be, nor should it be construed as, financial advice. We do not make any warranties regarding the completeness, reliability, or accuracy of this information. All investments involve risk, and past performance does not guarantee future results. We recommend consulting a financial advisor before making any investment decisions.
Victor Olanrewaju is a crypto analyst and reporter at CCN with deep roots in on-chain research and technical analysis. His crypto journey began in 2017, but it was the 2020 Uniswap airdrop that sparked a full-time pivot into the space.
With a foundation in copywriting, Victor honed his craft creating high-converting content for leading crypto brokers — most notably an XRP price prediction that ranked #1 on Google during the 2021 bull run.
He later joined AMBCrypto in 2022, where he combined storytelling with technical and on-chain analysis to cover key market narratives.
In 2024, he expanded his expertise at BeInCrypto, collaborating with analysts and using tools like Glassnode, Santiment, and IntoTheBlock to break down Bitcoin and altcoin trends.
At CCN, Victor covers the top cryptocurrencies, memecoins, macro shifts, blending real-time insights with deep-dive metrics.
He holds a Bachelor’s degree in Physics from the University of Ibadan, equipping him to simplify complex data for a wide audience. Follow his work or connect on LinkedIn or X.