Data shows Ethereum's price could be ready to crack $3,000 again | Credit: Hameem Sarwar
Share
Key Takeaways
Ethereum recorded an 8.19% surge in 24 hours, decisively reclaiming the $2,300 level.
For the first time since November 2025, the ETH/BTC ratio has shown a meaningful uptick.
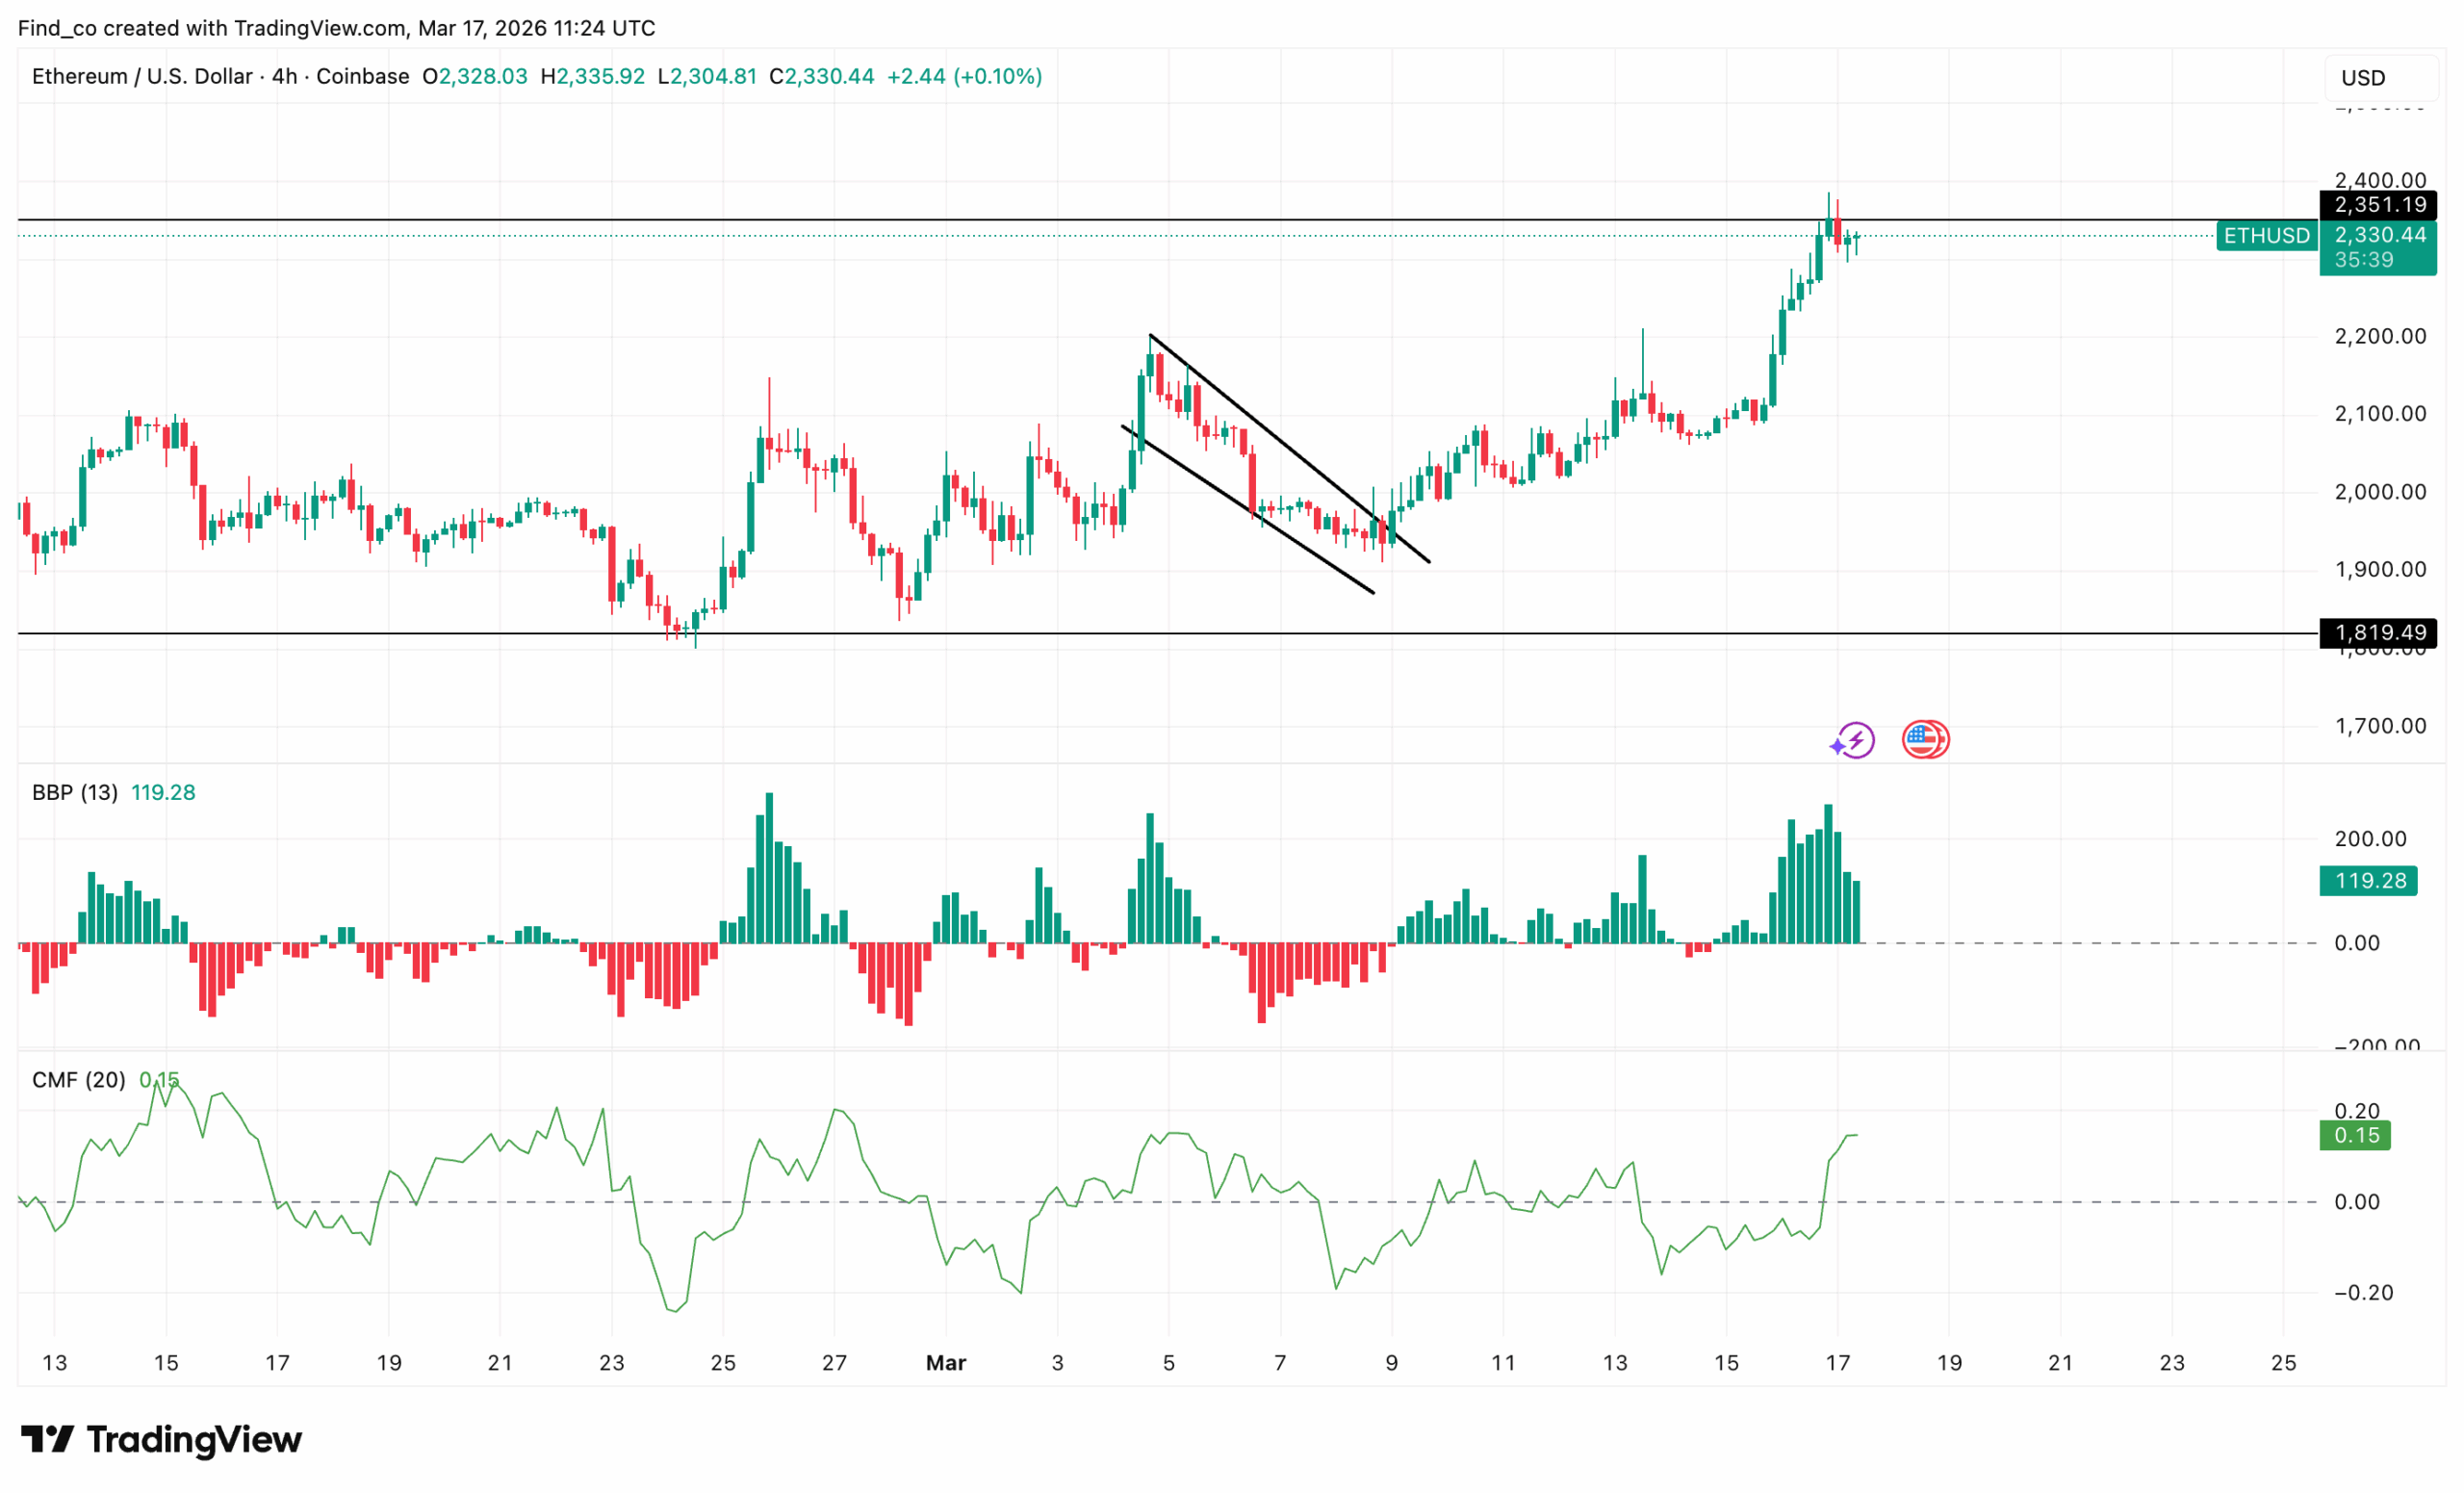
ETH has broken out of a downtrend on the daily chart while forming an ascending channel.
Ethereum (ETH) is showing strength again as bulls stepped in and defended key support, preventing a deeper breakdown.
As a result, ETH’s price is now pushing higher, recording roughly 3% in the past 24 hours, and moving toward a critical resistance zone.
But can this momentum hold, and more importantly, is ETH finally ready to make a run back to the psychological $3,000 mark?
Ethereum Bulls Take Lead
ETH has shifted its structure. After forming a series of lower lows, the price accelerated into a steep ascending channel. This move signals aggressive buying interest.
Moreover, the recent rally appears impulsive. Candles are expanding, and pullbacks remain shallow. This typically suggests trend strength.
However, ETH’s price is now approaching a horizontal resistance level between $2,350 and $2,400. This zone has historically acted as a supply region. As a result, bulls must prove control here.
The technical outlook is clearly improving on the 4-hour chart. First, the Bull Bear Power (BBP) indicator is printing strong green histogram bars.
This confirms that buyers are dominating in the short term. In addition, the Chaikin Money Flow (CMF) has flipped positive and is rising.
This indicates sustained capital inflows into Ethereum. This shift suggests that the rally is backed by real demand, not just short-term speculation.
If Ethereum breaks above $2,400 with strong volume, momentum could accelerate. In that case, the next leg higher may unfold quickly.
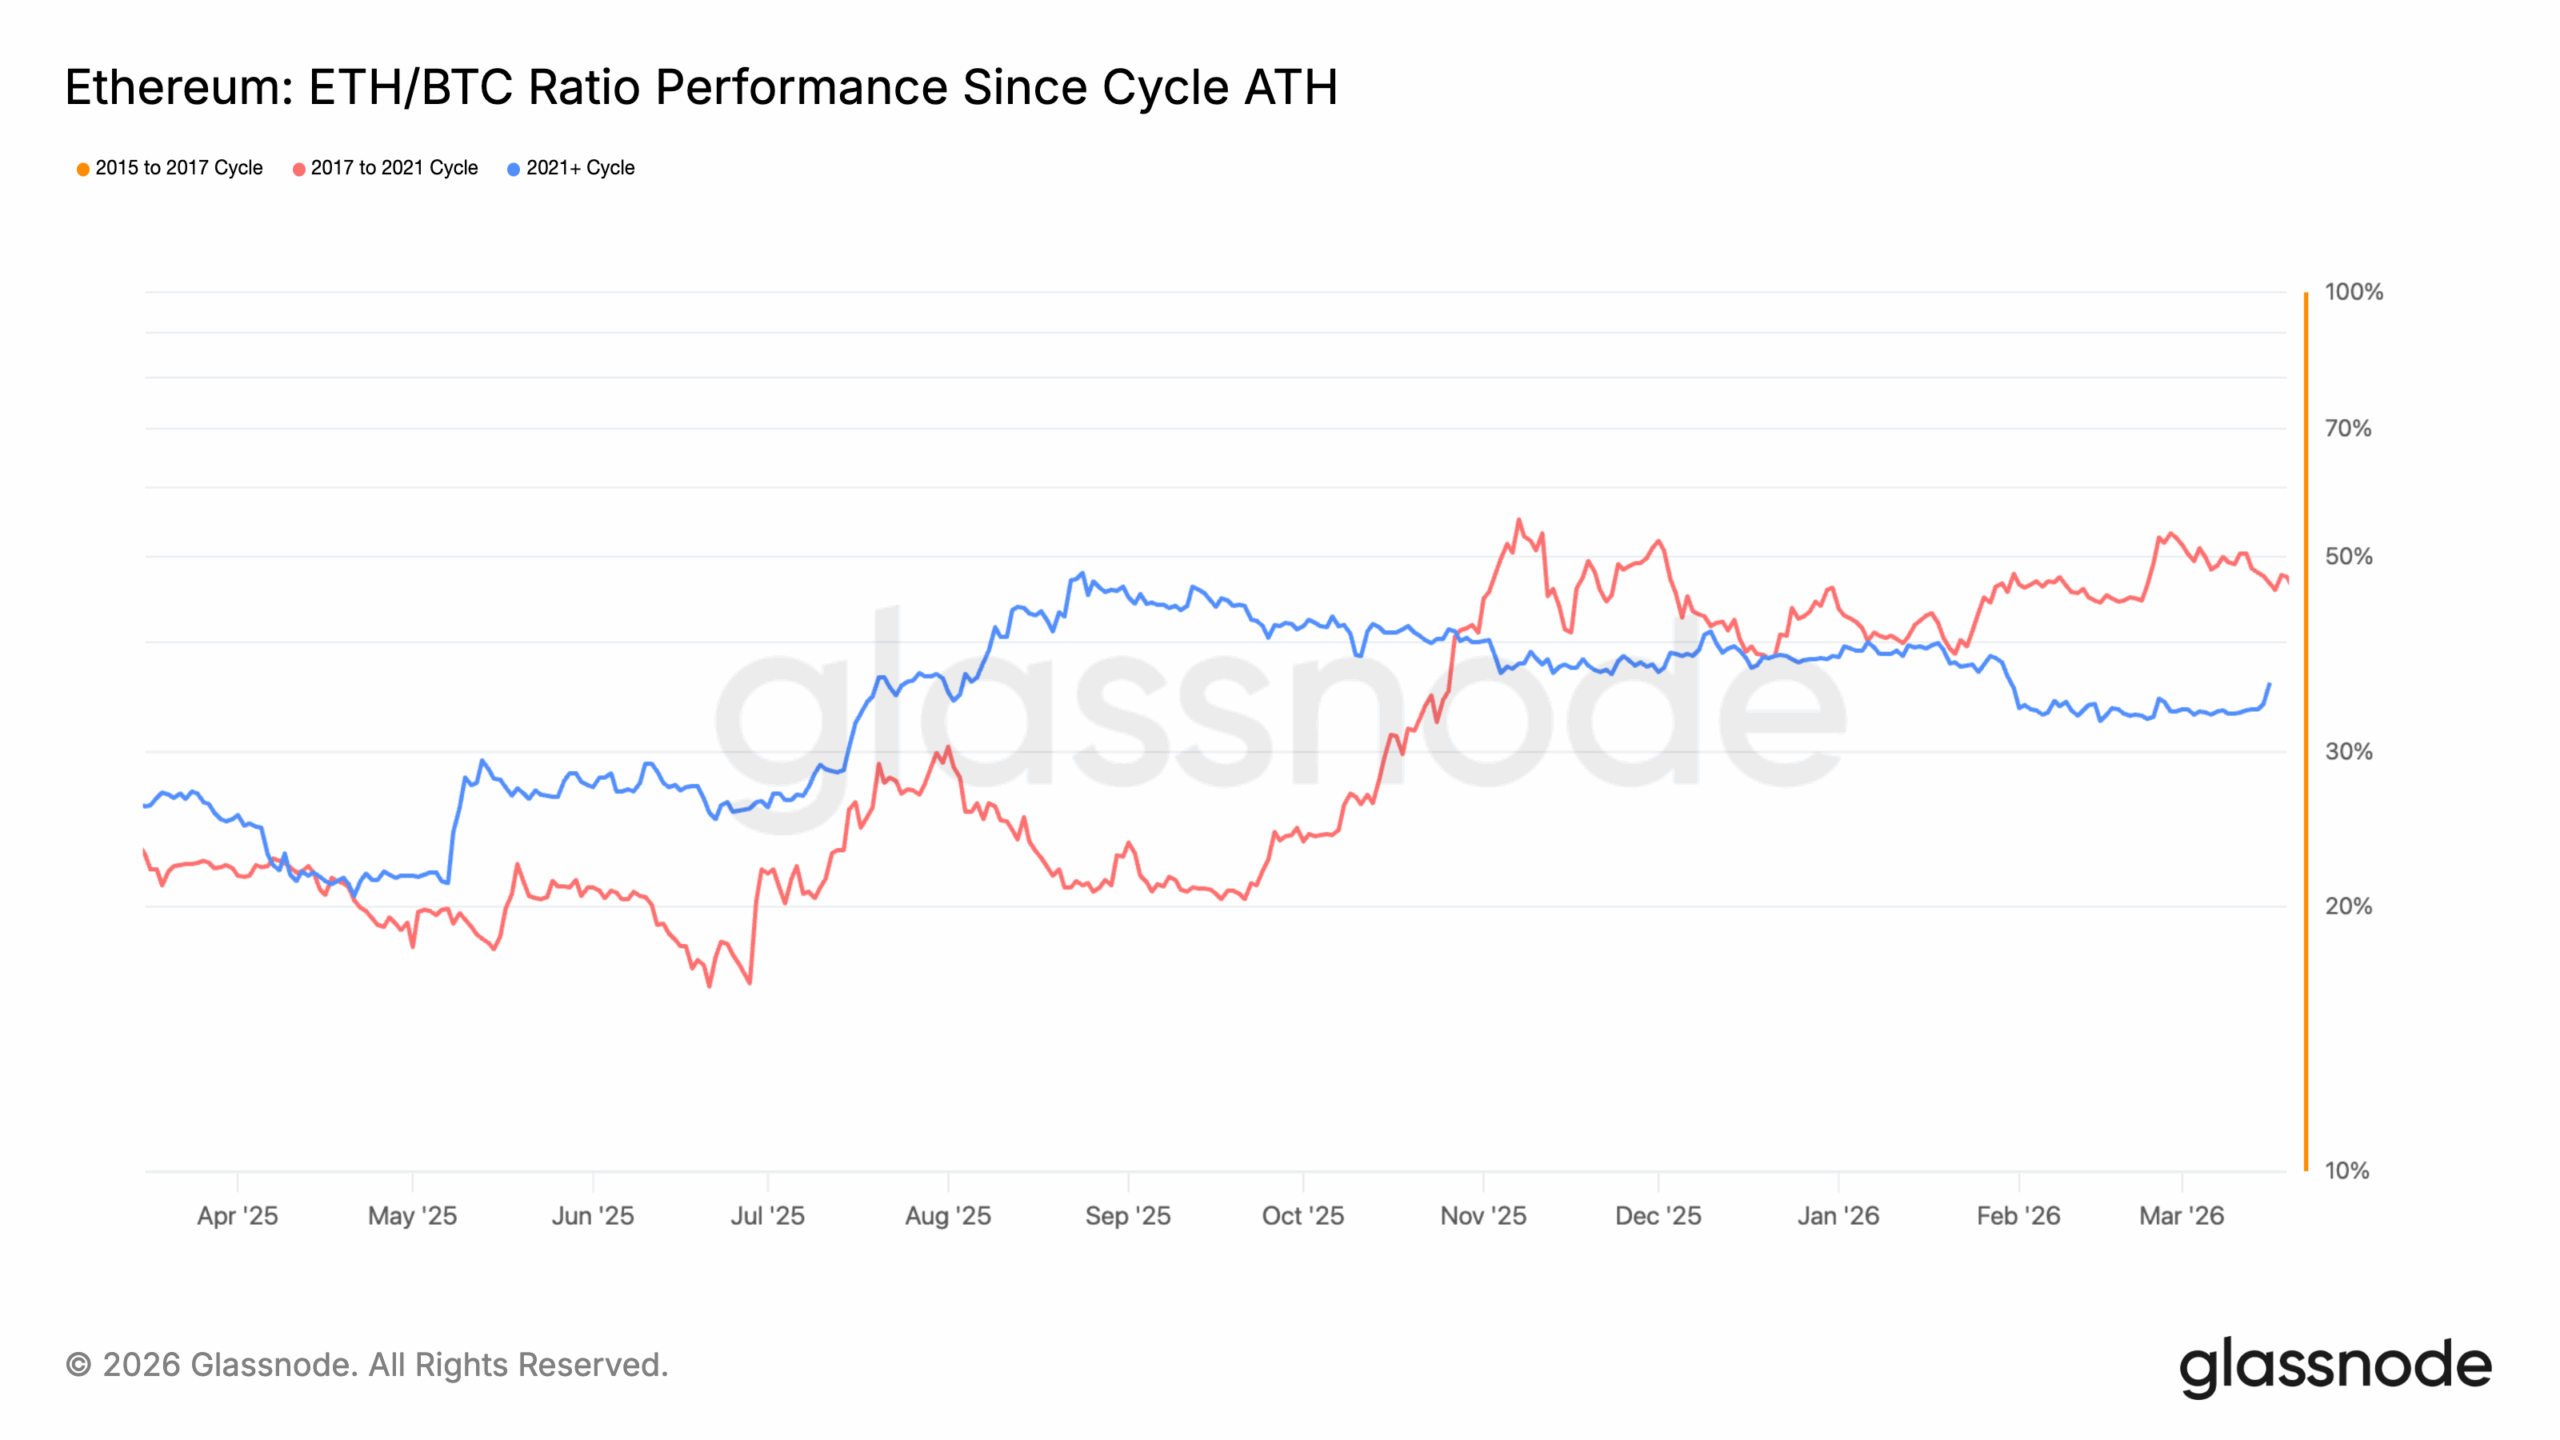
Time to Outpace BTC?
Besides this, the chart below tells an uncomfortable truth about Ethereum, and then quietly hints at what might come next.
The ETH/BTC ratio in the current 2021+ cycle (blue line) has been tracking below the 2017–2021 cycle (red line) for the majority of the past year.
Where the prior cycle saw ETH’s price recover aggressively against BTC after its cycle ATH, climbing from 20% back toward 50% and beyond.
However, the current cycle has struggled to match that pace. For context, Ethereum’s price has consistently underperformed BTC relative to historical precedent.
However, something has shifted this month. The blue line has begun recovering, climbing back toward 35%.
This is its first meaningful uptick since November 2025. Meanwhile, the ETH funding rate at its most extreme negative reading in nine months (flagged on March 13) and the ascending triangle forming on the daily chart are providing the same signal from different directions.
The critical question is whether the current cycle follows the 2017–2021 precedent of a sharp ETH/BTC ratio recovery after the trough.
By the look of things, the ratio could reclaims 40%. If sustained, it would signal the beginning of an extended Ethereum price uptrend.
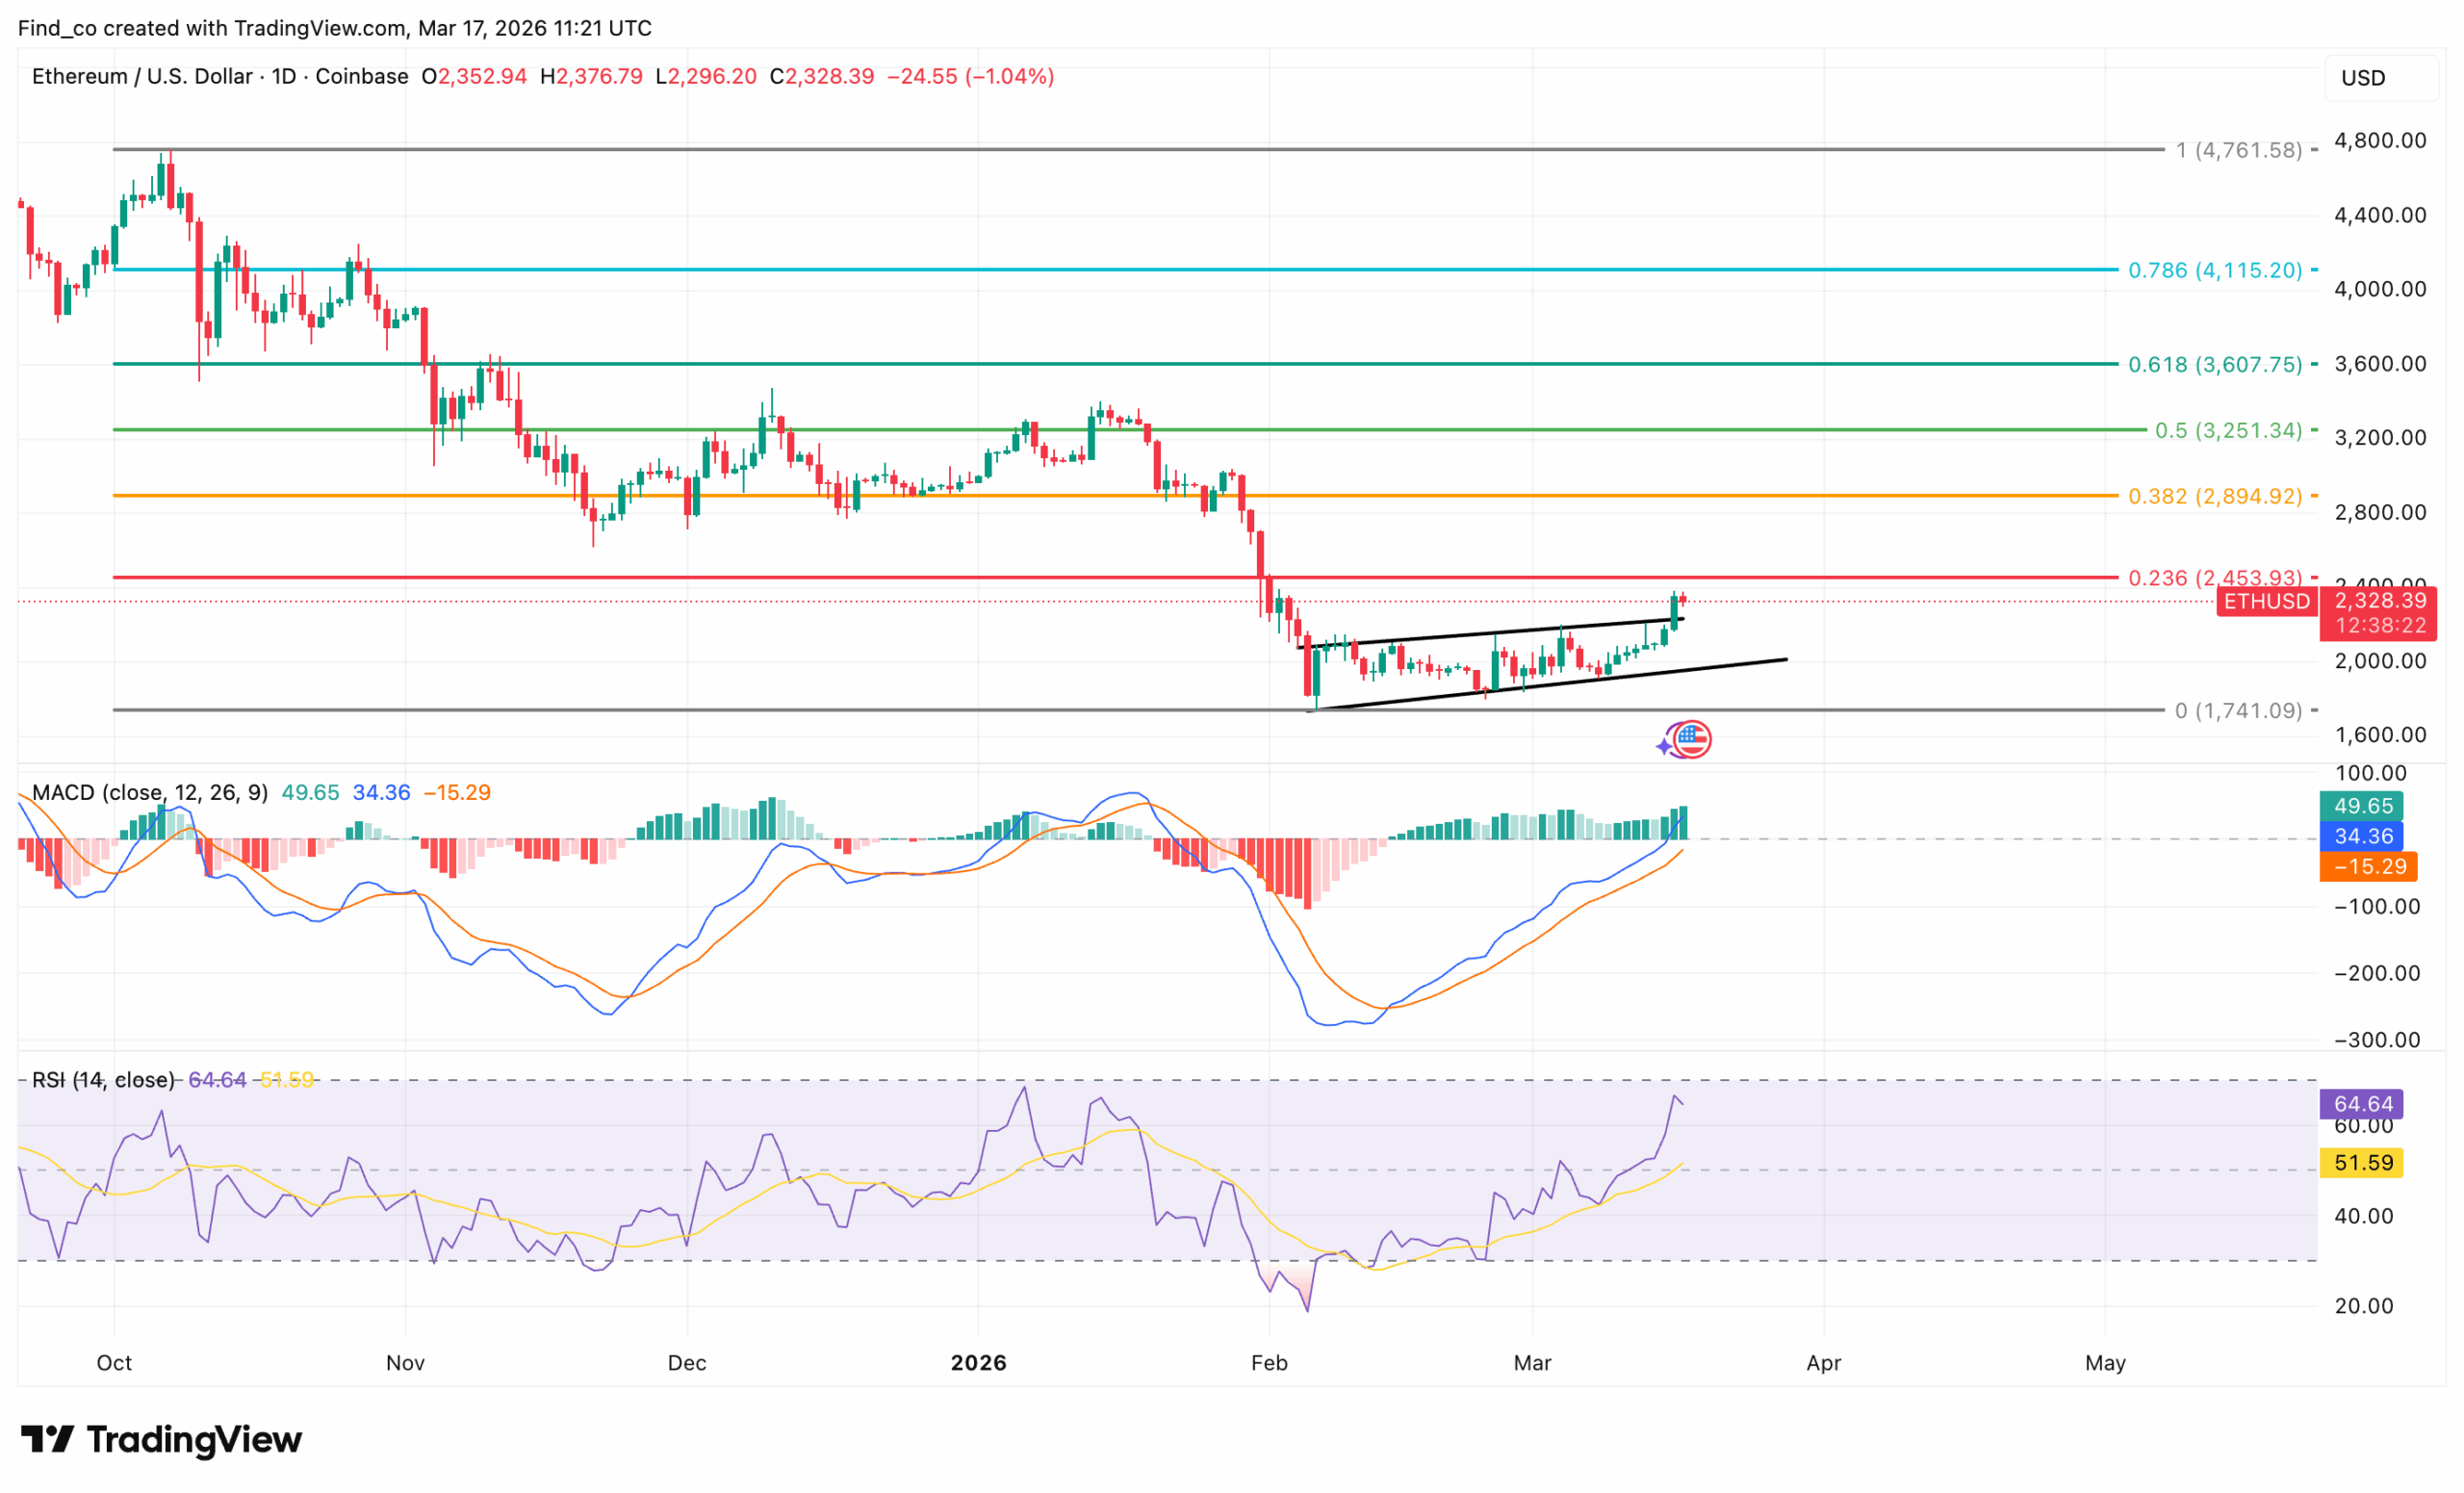
ETH Price Analysis: Bear Run Over?
On the daily chart, Ethereum is attempting a recovery, but broader pressure still lingers as price trades below key Fibonacci resistance near $2,454.
After a breakdown toward $1,700, buyers have regained some control, pushing the price back above $2,300. However, the move is now approaching a critical inflection point.
Notably, momentum indicators are improving. The Moving Average Convergence Divergence (MACD) has crossed upward, signaling a potential bullish shift.
At the same time, the Relative Strength Index (RSI) has climbed above 60, reflecting strengthening buying pressure. As a result, short-term sentiment is turning positive.
However, the structure remains fragile. Price continues to respect a broader descending trendline, while the current upward move forms a rising wedge.
If bulls break above $2,454, a stronger recovery could follow, pushing ETH’s price to $3,000.
Otherwise, rejection here may trigger another downside move, keeping Ethereum within its prevailing downtrend.
Analysts Lend Their Voices
Meanwhile, Crypto Patel, a technical analyst, correctly anticipated the recent move.
“On Feb 16, I noted: Hold $1,800-Relief Bounce Toward $2,650,” He explained.
Patel highlighted that ETH’s next direction hinges on the Strong FVG at $2,474-$2,734, adding that:
“High probability price reclaims this zone first before any real decision point. If ETH breaks the $2,634 FVG level, the path to $3,000 opens, and that level will determine whether we see a new ATH.”
In contrast, Ted Pillows warns of a potential reversal if ETH reaches the $2,400 zone.
“Ethereum has reclaimed $2,150. From here, there’s little resistance until $2,400. In my view, ETH could touch $2,400 before reversing toward new lows,” He noted.
The contrasting outlooks highlight a market caught between bullish reclaiming pressure and looming reversal risks, making ETH’s next moves critical for traders.
Disclaimer:
The information provided in this article is for informational purposes only. It is not intended to be, nor should it be construed as, financial advice. We do not make any warranties regarding the completeness, reliability, or accuracy of this information. All investments involve risk, and past performance does not guarantee future results. We recommend consulting a financial advisor before making any investment decisions.
Victor Olanrewaju is a crypto analyst and reporter at CCN with deep roots in on-chain research and technical analysis. His crypto journey began in 2017, but it was the 2020 Uniswap airdrop that sparked a full-time pivot into the space.
With a foundation in copywriting, Victor honed his craft creating high-converting content for leading crypto brokers — most notably an XRP price prediction that ranked #1 on Google during the 2021 bull run.
He later joined AMBCrypto in 2022, where he combined storytelling with technical and on-chain analysis to cover key market narratives.
In 2024, he expanded his expertise at BeInCrypto, collaborating with analysts and using tools like Glassnode, Santiment, and IntoTheBlock to break down Bitcoin and altcoin trends.
At CCN, Victor covers the top cryptocurrencies, memecoins, macro shifts, blending real-time insights with deep-dive metrics.
He holds a Bachelor’s degree in Physics from the University of Ibadan, equipping him to simplify complex data for a wide audience. Follow his work or connect on LinkedIn or X.