Meet the Top 101 in Crypto

Pi Network (PI) Is Trapped in a Descending Triangle as $0.15 Support Comes Under Threat

Published 27 March 2026
Victor Olanrewaju
Authors

Key Takeaways

  • PI’s price is confined in a descending triangle on the 4-hour chart.
  • The AO has turned negative, indicating rising bearish momentum.
  • The daily chart analysis suggests PI might slide below key support.

Unlike its performance about one week ago, the Pi Network (PI) price has dropped.

For context, after the post-Kraken listing decline, PI’s price bounced again, reaching $0.20 on Saturday, March 21.

This ignited bullish sentiment that the PI coin will break out again. However, that did not happen as the altcoin’s price dropped.

So, what lies ahead for the price? Let’s find out.

PI Coin Extends Fall

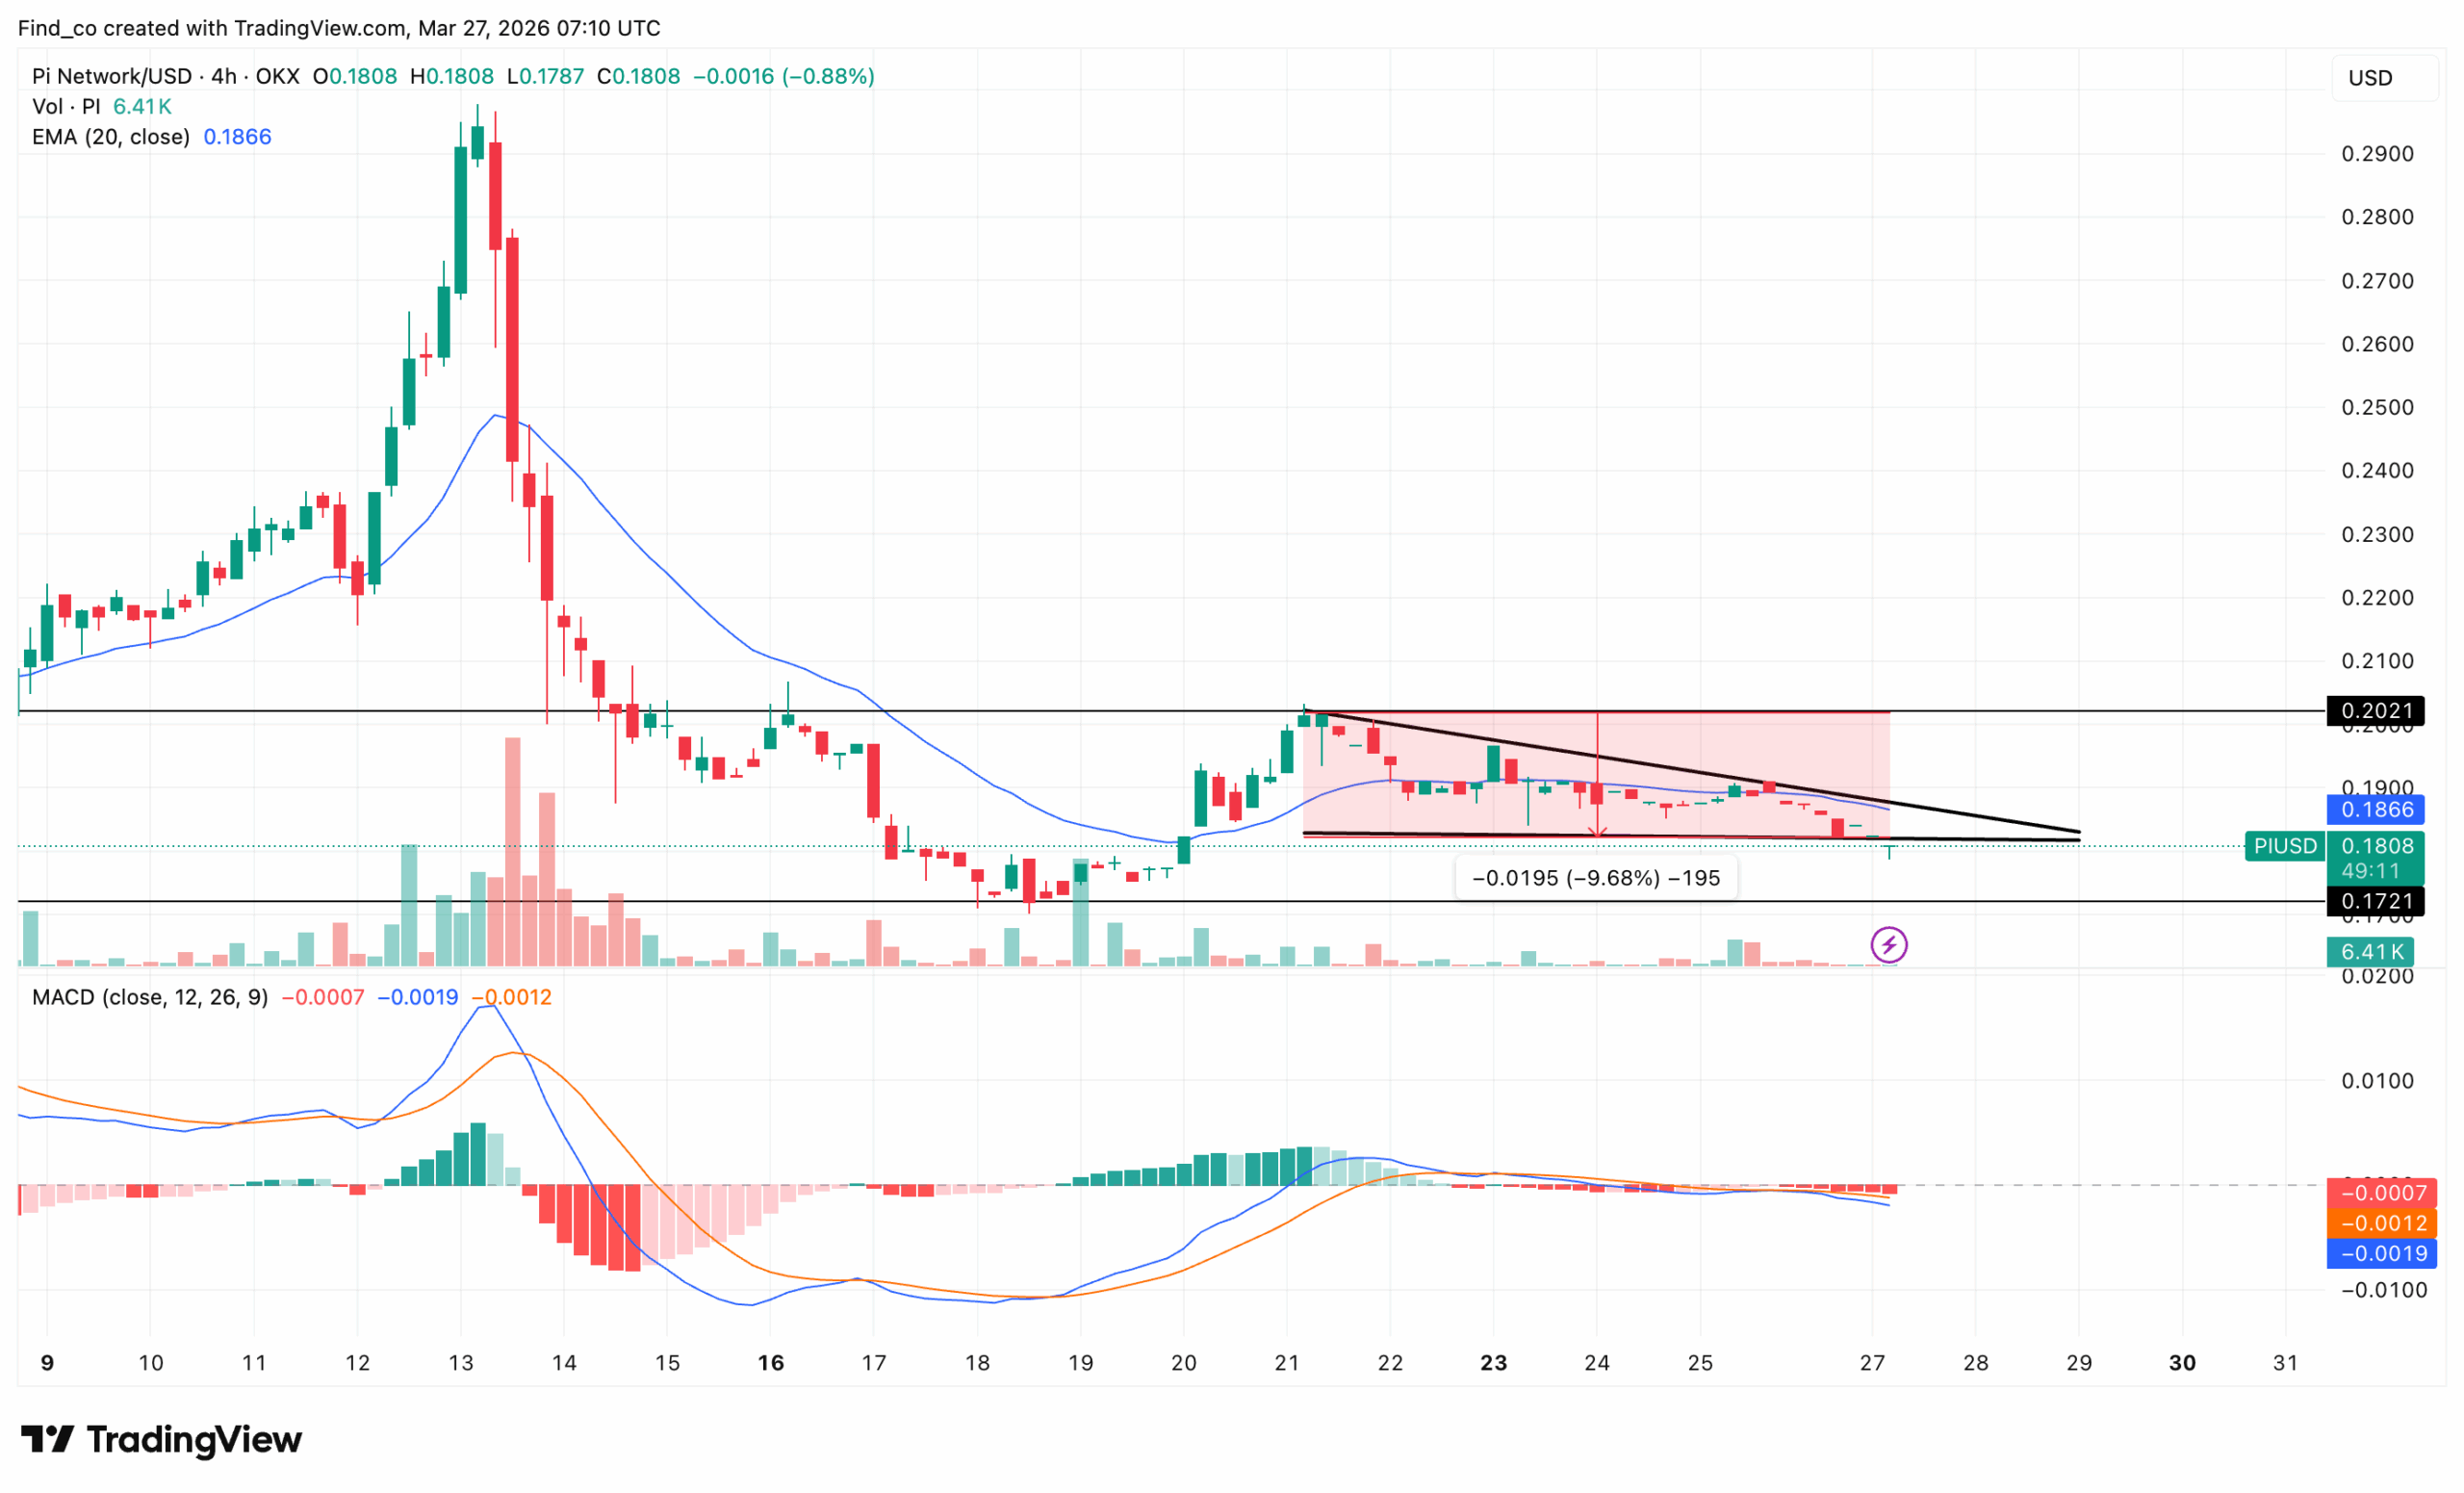
The PI/USD 4-hour chart tells the complete story of March 2026 in a single frame.

The spike to $0.29 around March 13 and 14 (the Kraken listing and PI Day convergence) is the dominant feature on the left side of the chart.

That peak was sharp, volume-driven, and reversed. The sell-off that followed was equally decisive.

For context, the Pi Network price collapsed from $0.29 through $0.20 in a matter of days.

What has developed since March 21 is the descending triangle now dominating the right side of the chart.

The red shaded zone marks the formation precisely. The upper boundary (the descending black trendline) connects the lower highs of $0.21.

Meanwhile, the lower boundary is the flat horizontal support at $0.17.

In addition, the 20 EMA sitting at $0.19 has become a mechanical resistance layer. Price has tested it from below and been rejected.

It now sits above the current $0.18 price, serving as an additional ceiling that compresses the triangle’s resolution. 

So, a confirmed 4-hour close below $0.17 on expanding volume would trigger the measured breakdown move annotated on the chart.

Pi Network price analysis
PI/USD 4-Hour Chart | Credit: TradingView

If that is the case, the Pi Network price might experience a a 10% decline, pointing toward $0.15.

Momentum Becomes Bearish

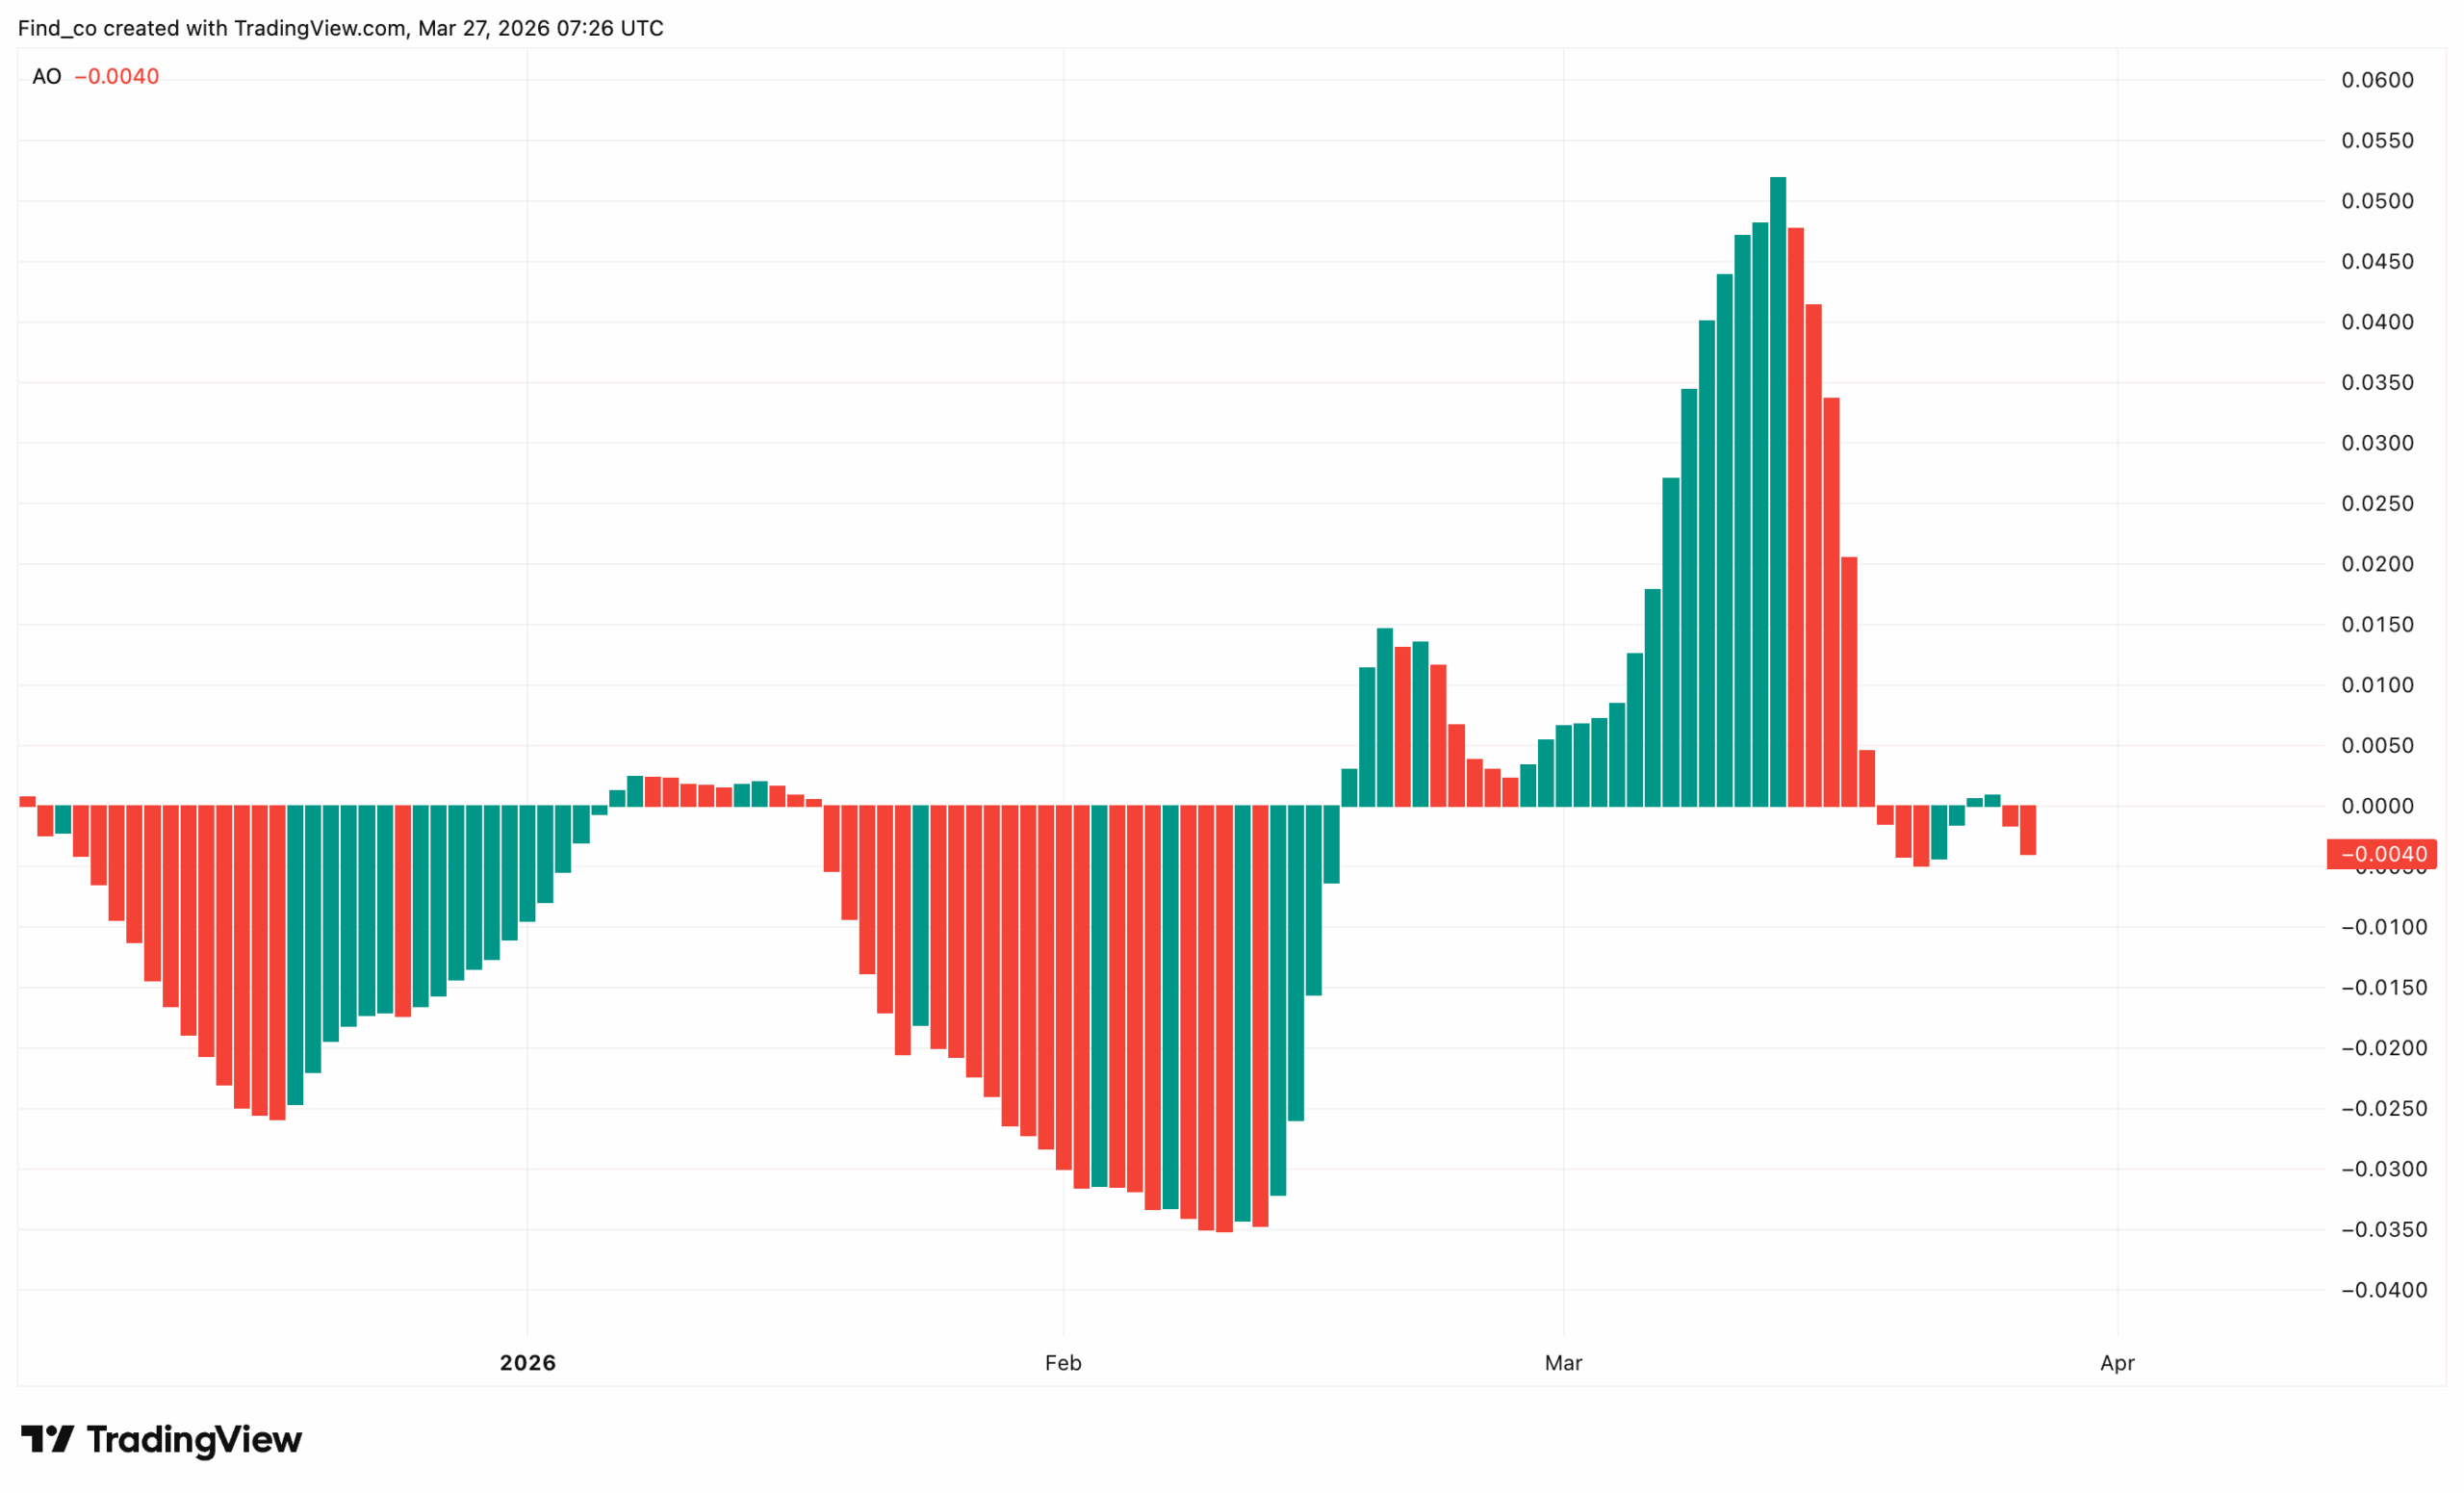
Besides that, the Awesome Oscillator for PI/USD tells a clear three-act story, and the current reading sits at the most pivotal point of all.

The first act saw the AO sink to -0.025 in early January before recovering toward zero. Act two brought an even deeper trough at -0.032 in February.

Crucially, green bars fought back throughout both declines, signalling buyers never fully surrendered.

That resilience paid off. From late February through mid-March, the AO exploded to +0.053. Bulls were unambiguously in control, and momentum was real.

Now, the tide has turned again. The AO has collapsed back to -0.0040, barely below zero but trending lower, indicating rising bearish momentum.

Pi Network PI momentum
PI/USD Awesome Oscillator | Credit: TradingView

The zero line is everything right now. A fresh green crossover signals recovery. Continued red bars confirm another bearish cycle is underway.

As it stands, the Pi Network price does not seem likely to recover soon.

PI Price Prediction: Support at Risk

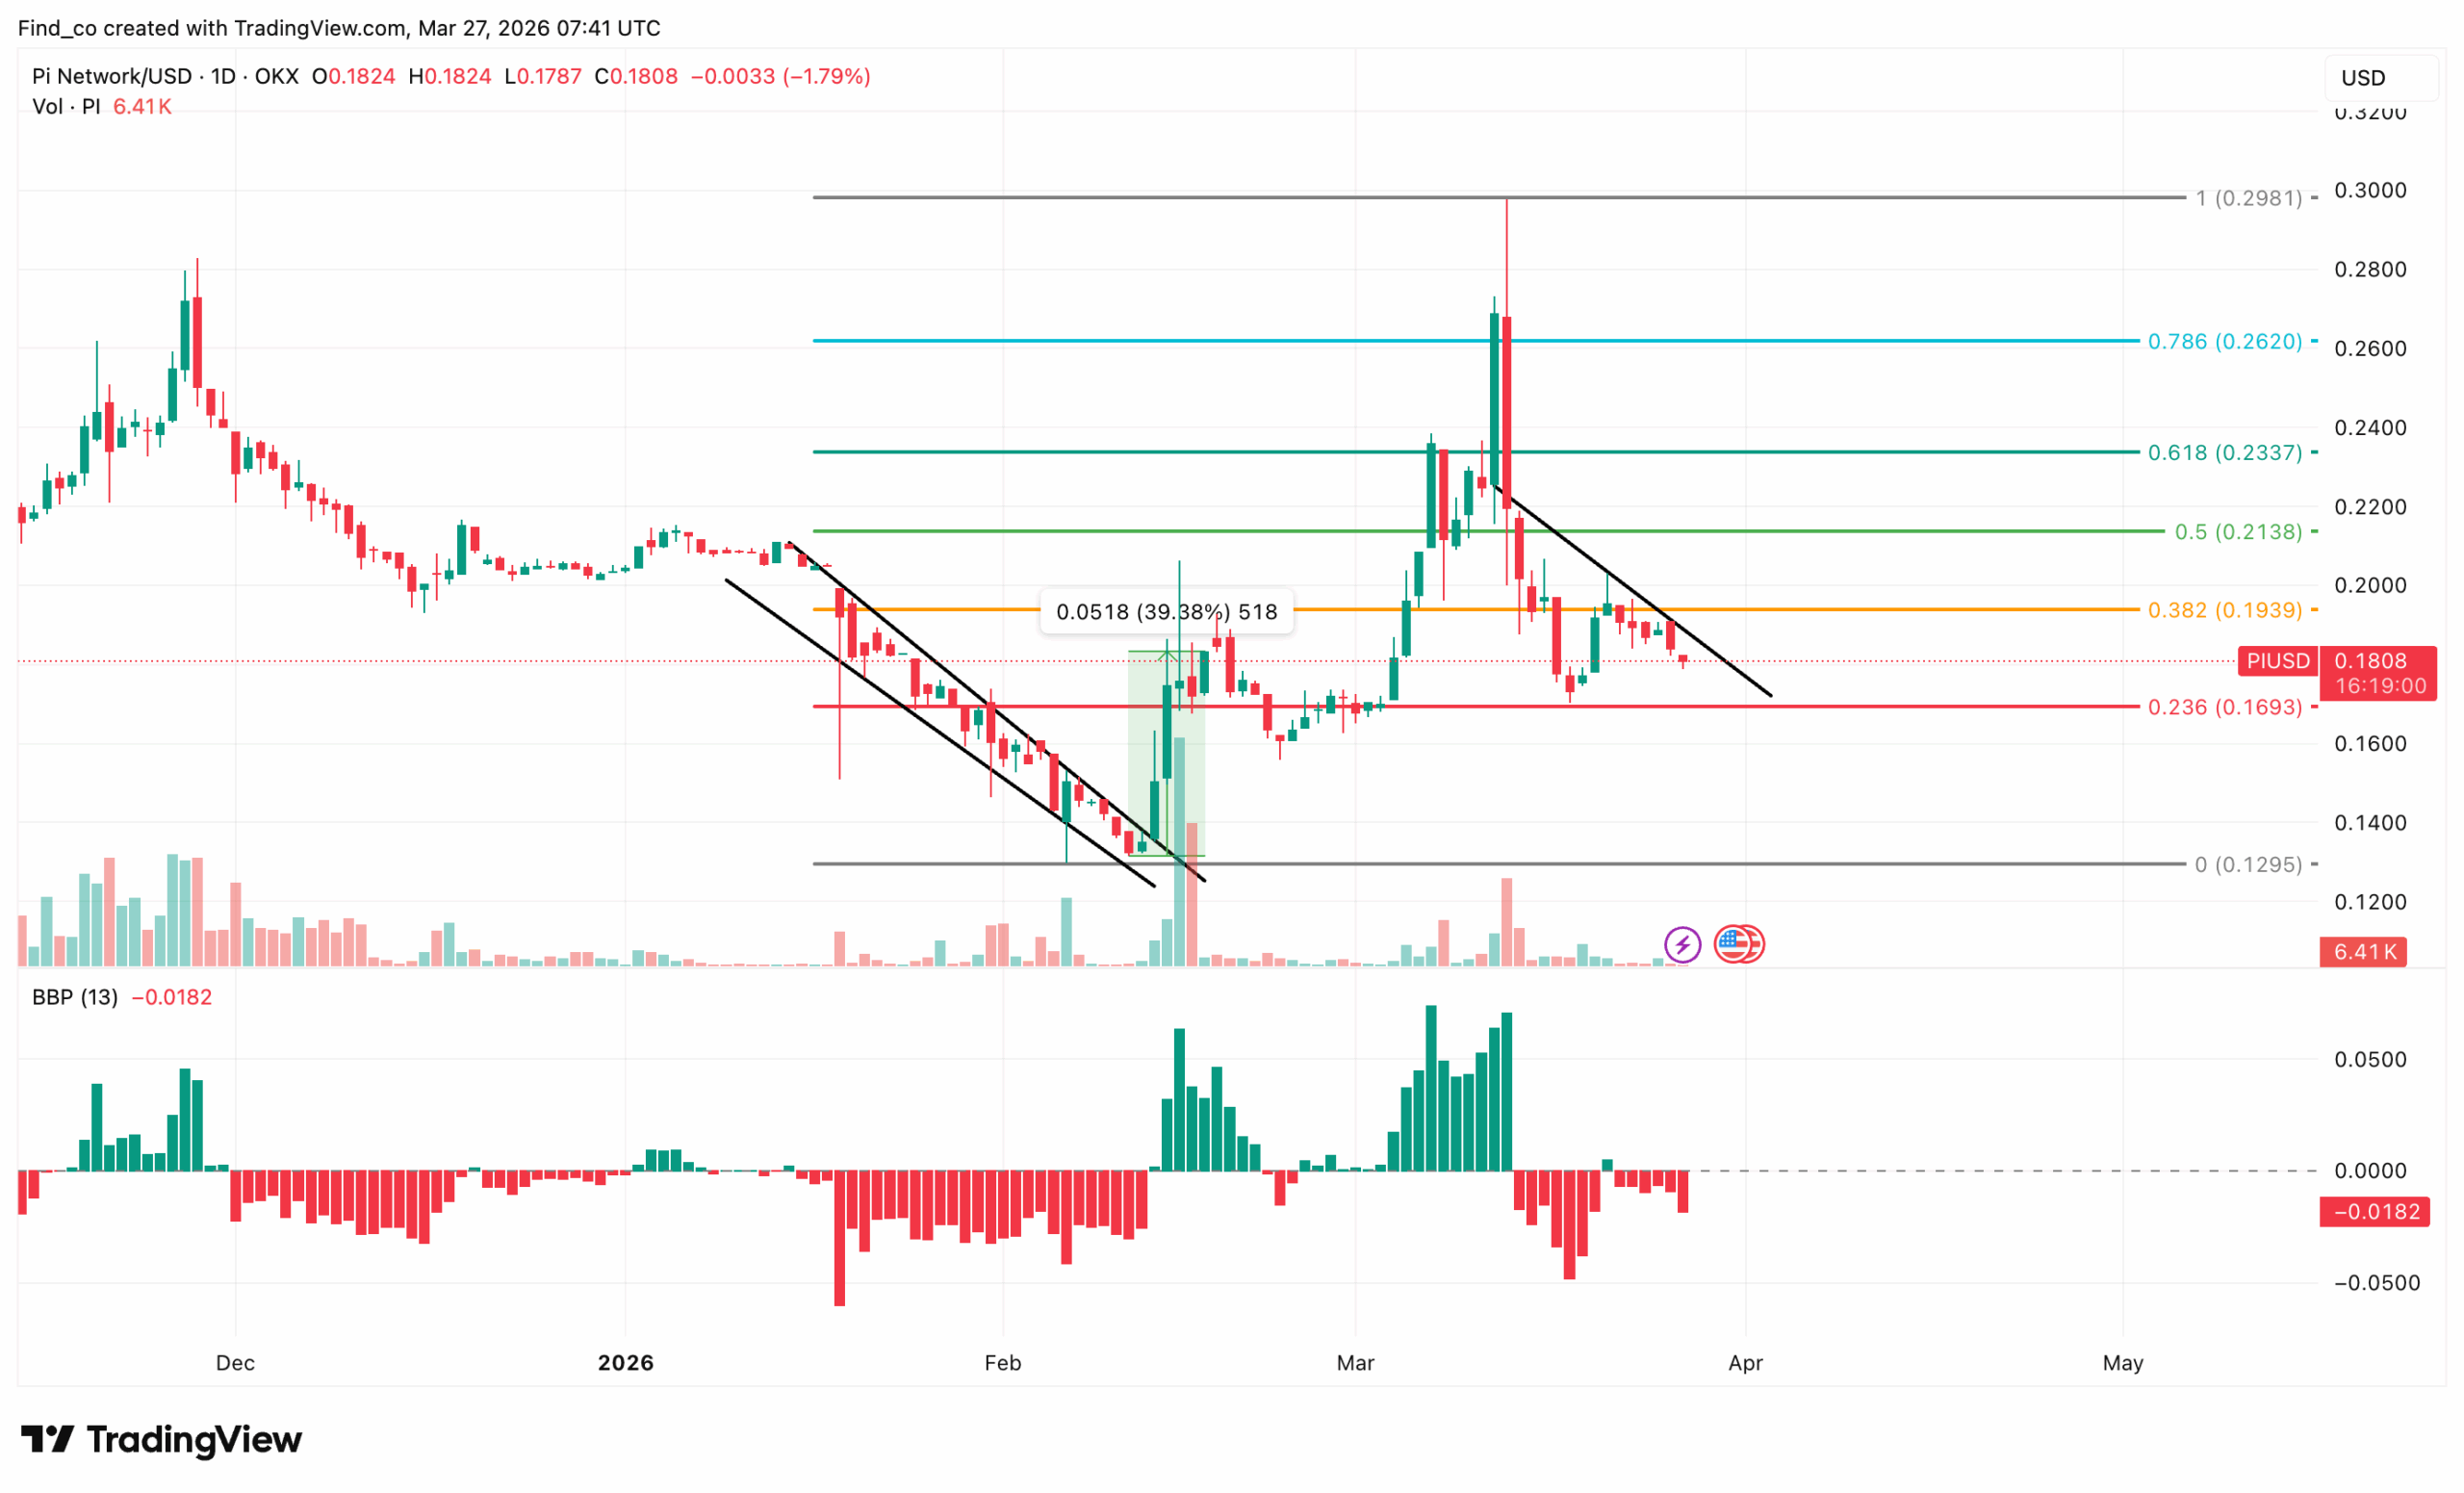
On the daily chart, PI trades at $0.18, and the chart pattern has repeatedly punished bulls.

Two descending channels have defined this chart. The first formed throughout January and February, grinding price from $0.20 down to a low of $0.13 — a decline of 39.38%.

A brief volume-driven spike in mid-February briefly broke the channel. But sellers quickly reclaimed control.

The second descending channel formed after the March peak near $0.30, when PI briefly spiked to its highest level on this chart before collapsing.

That rejection was severe. Price sliced through the 0.618 level at $0.23 and the 0.5 level at $0.21 in rapid succession.

Now the Pi Network price sits just above the 0.236 level at $0.17. This level must be held to prevent a retest of the $0.13 absolute low.

In addition, the Bull Bear Power (BBP) reads -0.0182, indicating that sellers are dominant. 

Pi Network price outlook
PI/USD Daily Chart | Credit: TradingView

Volume has also thinned dramatically since the March spike, suggesting the move lacked genuine accumulation.

Bulls need a channel breakout and a reclaim of $0.19 to shift the narrative. Until then, the descending structure remains firmly intact — and the $0.15 support is the key level to watch.

Disclaimer: The information provided in this article is for informational purposes only. It is not intended to be, nor should it be construed as, financial advice. We do not make any warranties regarding the completeness, reliability, or accuracy of this information. All investments involve risk, and past performance does not guarantee future results. We recommend consulting a financial advisor before making any investment decisions.
Victor Olanrewaju

Victor Olanrewaju is a crypto analyst and reporter at CCN with deep roots in on-chain research and technical analysis. His crypto journey began in 2017, but it was the 2020 Uniswap airdrop that sparked a full-time pivot into the space.

With a foundation in copywriting, Victor honed his craft creating high-converting content for leading crypto brokers — most notably an XRP price prediction that ranked #1 on Google during the 2021 bull run.

He later joined AMBCrypto in 2022, where he combined storytelling with technical and on-chain analysis to cover key market narratives.

In 2024, he expanded his expertise at BeInCrypto, collaborating with analysts and using tools like Glassnode, Santiment, and IntoTheBlock to break down Bitcoin and altcoin trends.

At CCN, Victor covers the top cryptocurrencies, memecoins, macro shifts, blending real-time insights with deep-dive metrics.

He holds a Bachelor’s degree in Physics from the University of Ibadan, equipping him to simplify complex data for a wide audience. Follow his work or connect on LinkedIn or X.

Related

Survey Icon
Help us improve
1 of 4
Is this your first time here?
What brought you here today?
What are you most interested in?
Would you be interested in:
Thank you icon
Thank you for your feedback!
DMCA.com Protection Status