ETH’s bounce attempts keep getting sold | Credit: Hameem Sarwar
Share
Key Takeaways
ETH has flipped $2,000 from support into resistance, with repeated failed breakouts.
The MVRV ratio suggests long-term value, but only if demand for ETH resumes.
Ethereum remains in a confirmed downtrend, trading inside a descending channel.
Ethereum (ETH) is in trouble.
As of today, ETH’s price has dropped again, and every attempt to reclaim $2,000 has failed.
Three times in two weeks, buyers stepped in. Three times, ETH bears pushed them right back down. So what’s really going on?
The answer isn’t just one thing. It’s a perfect storm of technical weakness, whale behavior, and macro pressure — all hitting at the same time.
In this analysis, CCN explains why Ethereum’s price might keep struggling to rise past $2,000. Besides that, we also highlighted what could be next for the cryptocurrency.
The $2,000 Level Is Now a Ceiling, Not Support
Not long ago, $2,000 was considered solid support for ETH. Now, it’s a wall that Ethereum can’t seem to break through.
The numbers tell the story.
On Feb. 6, ETH surged 23% but stalled near $2,120. On Feb. 12, it climbed 11%, then reversed.
On Feb. 15, Ethereum’s price moved 7% before fading again under $2,000. Notably, each attempt was weaker than the last.
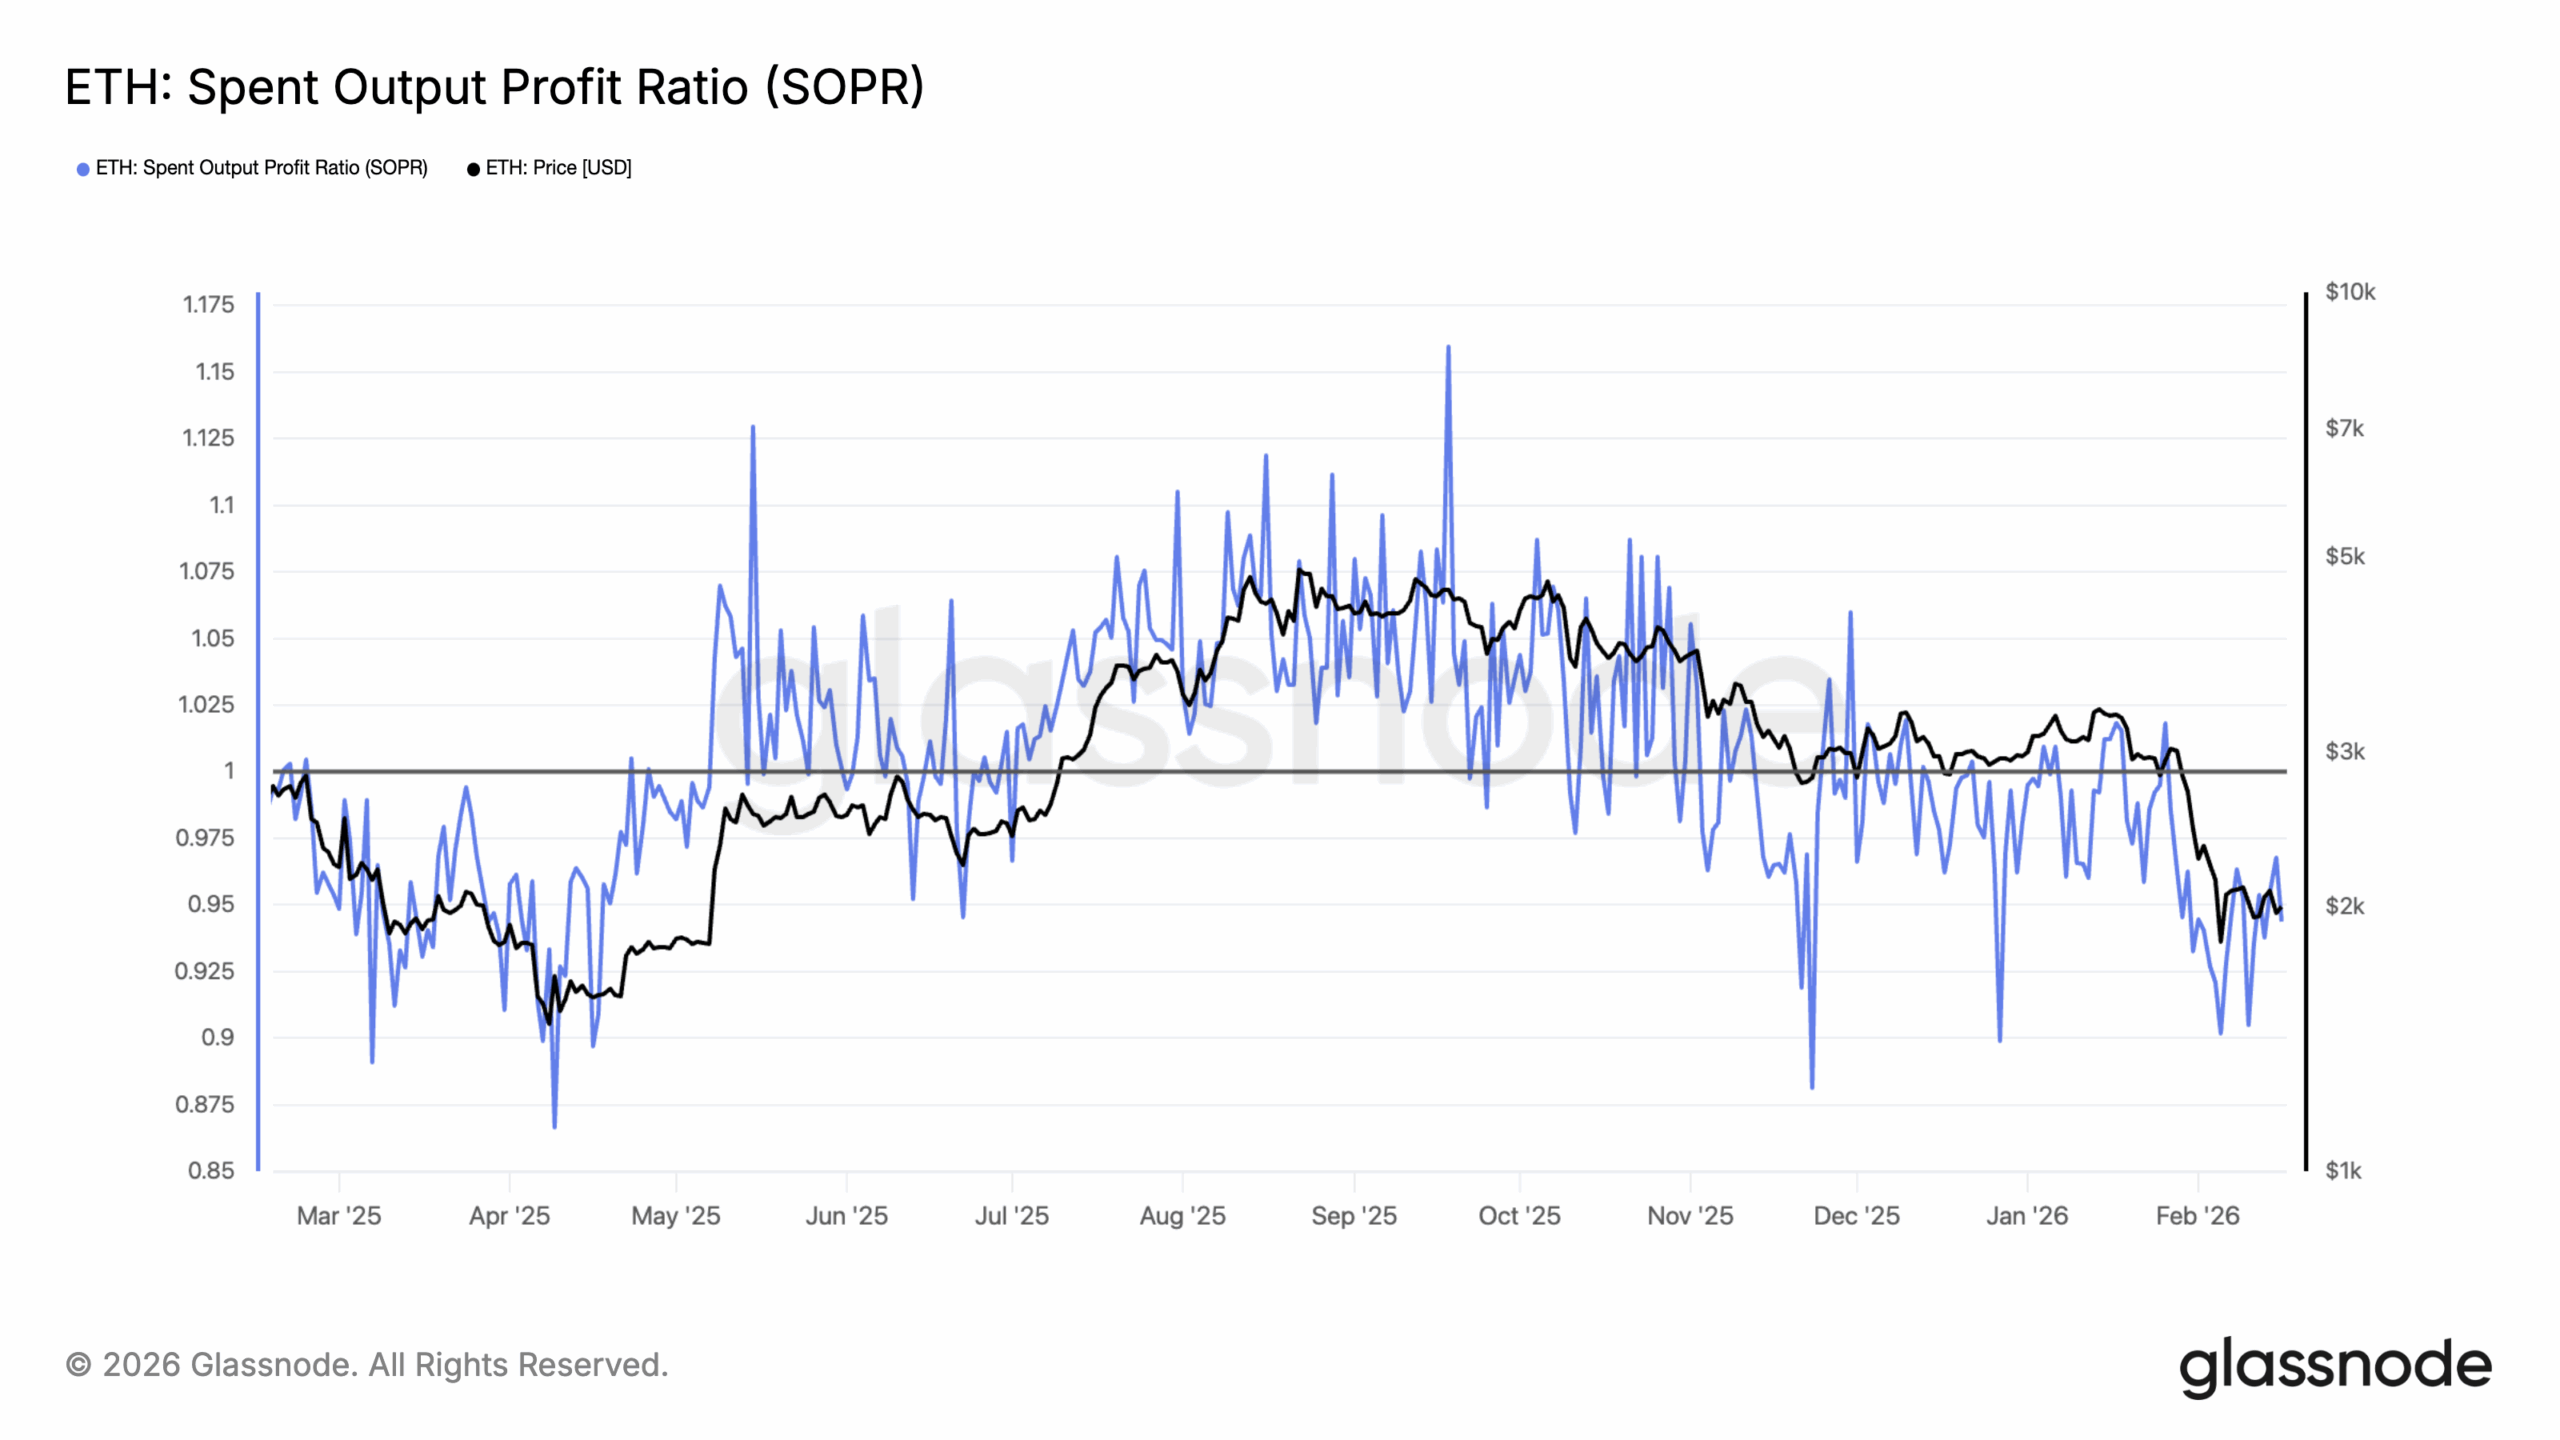
There’s a technical reason for this. On-chain data shows that more than 1.01 million ETH were purchased at prices between $1,995 and $2,015.
So, as it stands, several short-term holders are unprofitable.
ETH Spent Output Profit Ratio | Credit: CryptoQuant
Therefore, it is unlikely that Ethereum’s price will see more accumulation than distribution, which will positively impact the price.
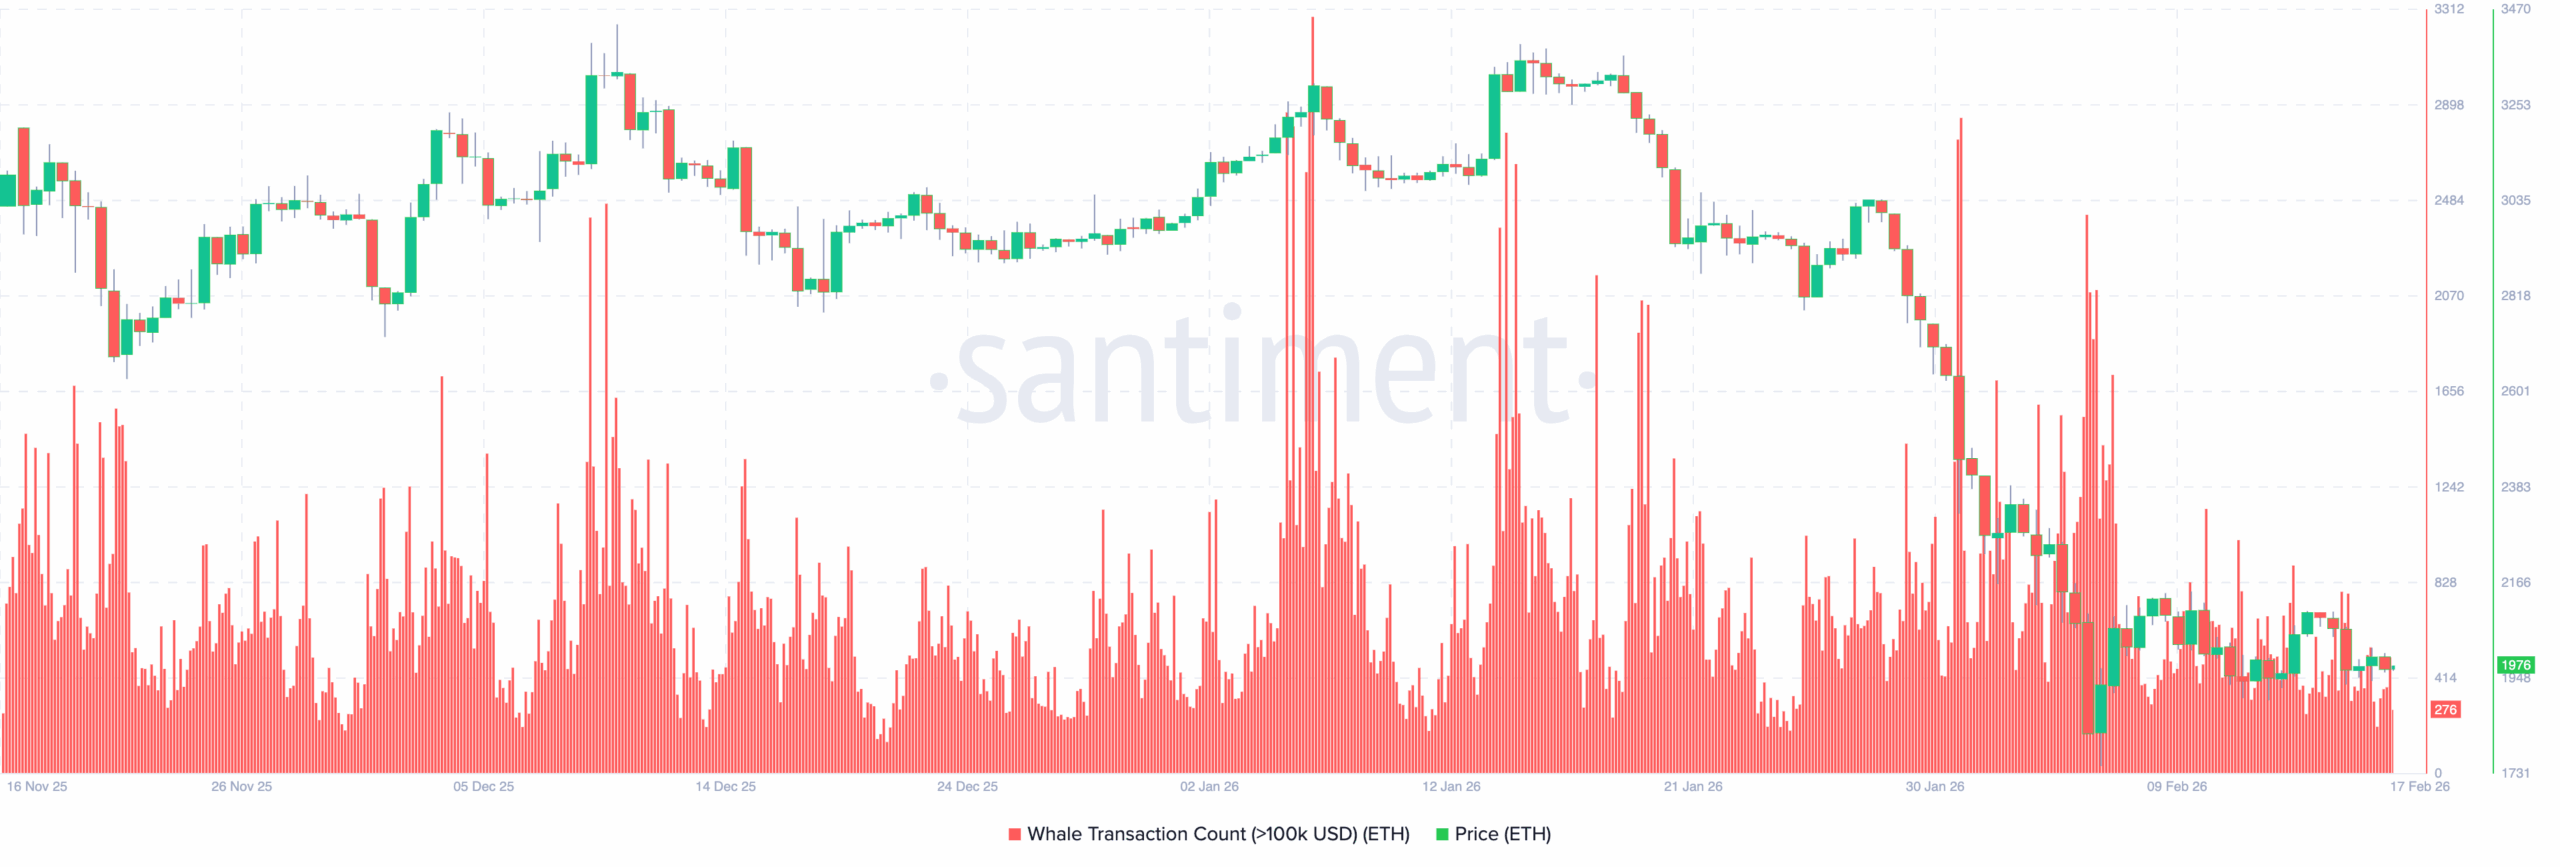
Ethereum Whales Are Quietly Exiting
Here’s what makes this drop more concerning. While smaller investors were buying the dip, whales were selling into it.
Between early and mid-February, wallets holding large amounts of ETH reduced their positions from 113.92 million ETH to 113.66 million ETH — a drop of roughly 260,000 ETH, worth around $500 million.
At the same time, long-term holder selling pressure rose 34%, from -13,677 ETH to -18,411 ETH.
In short, the big money is not accumulating. Instead, they are distributing. Should this trend persist, Ethereum’s price might struggle to trade higher.
Beyond the charts, the broader market is working against ETH. Persistent uncertainty around global monetary policy has pushed investors into a defensive mode.
As risk appetite shrinks, altcoins like Ethereum tend to suffer more than Bitcoin (BTC) — they carry higher beta, meaning they fall harder in risk-off environments.
Adding to the pressure, Ethereum Foundation founder Vitalik Buterin announced in late January that he had withdrawn 16,384 ETH for deployment toward long-term goals.
While only around 3,000 ETH appear to have been sold, the move rattled sentiment.
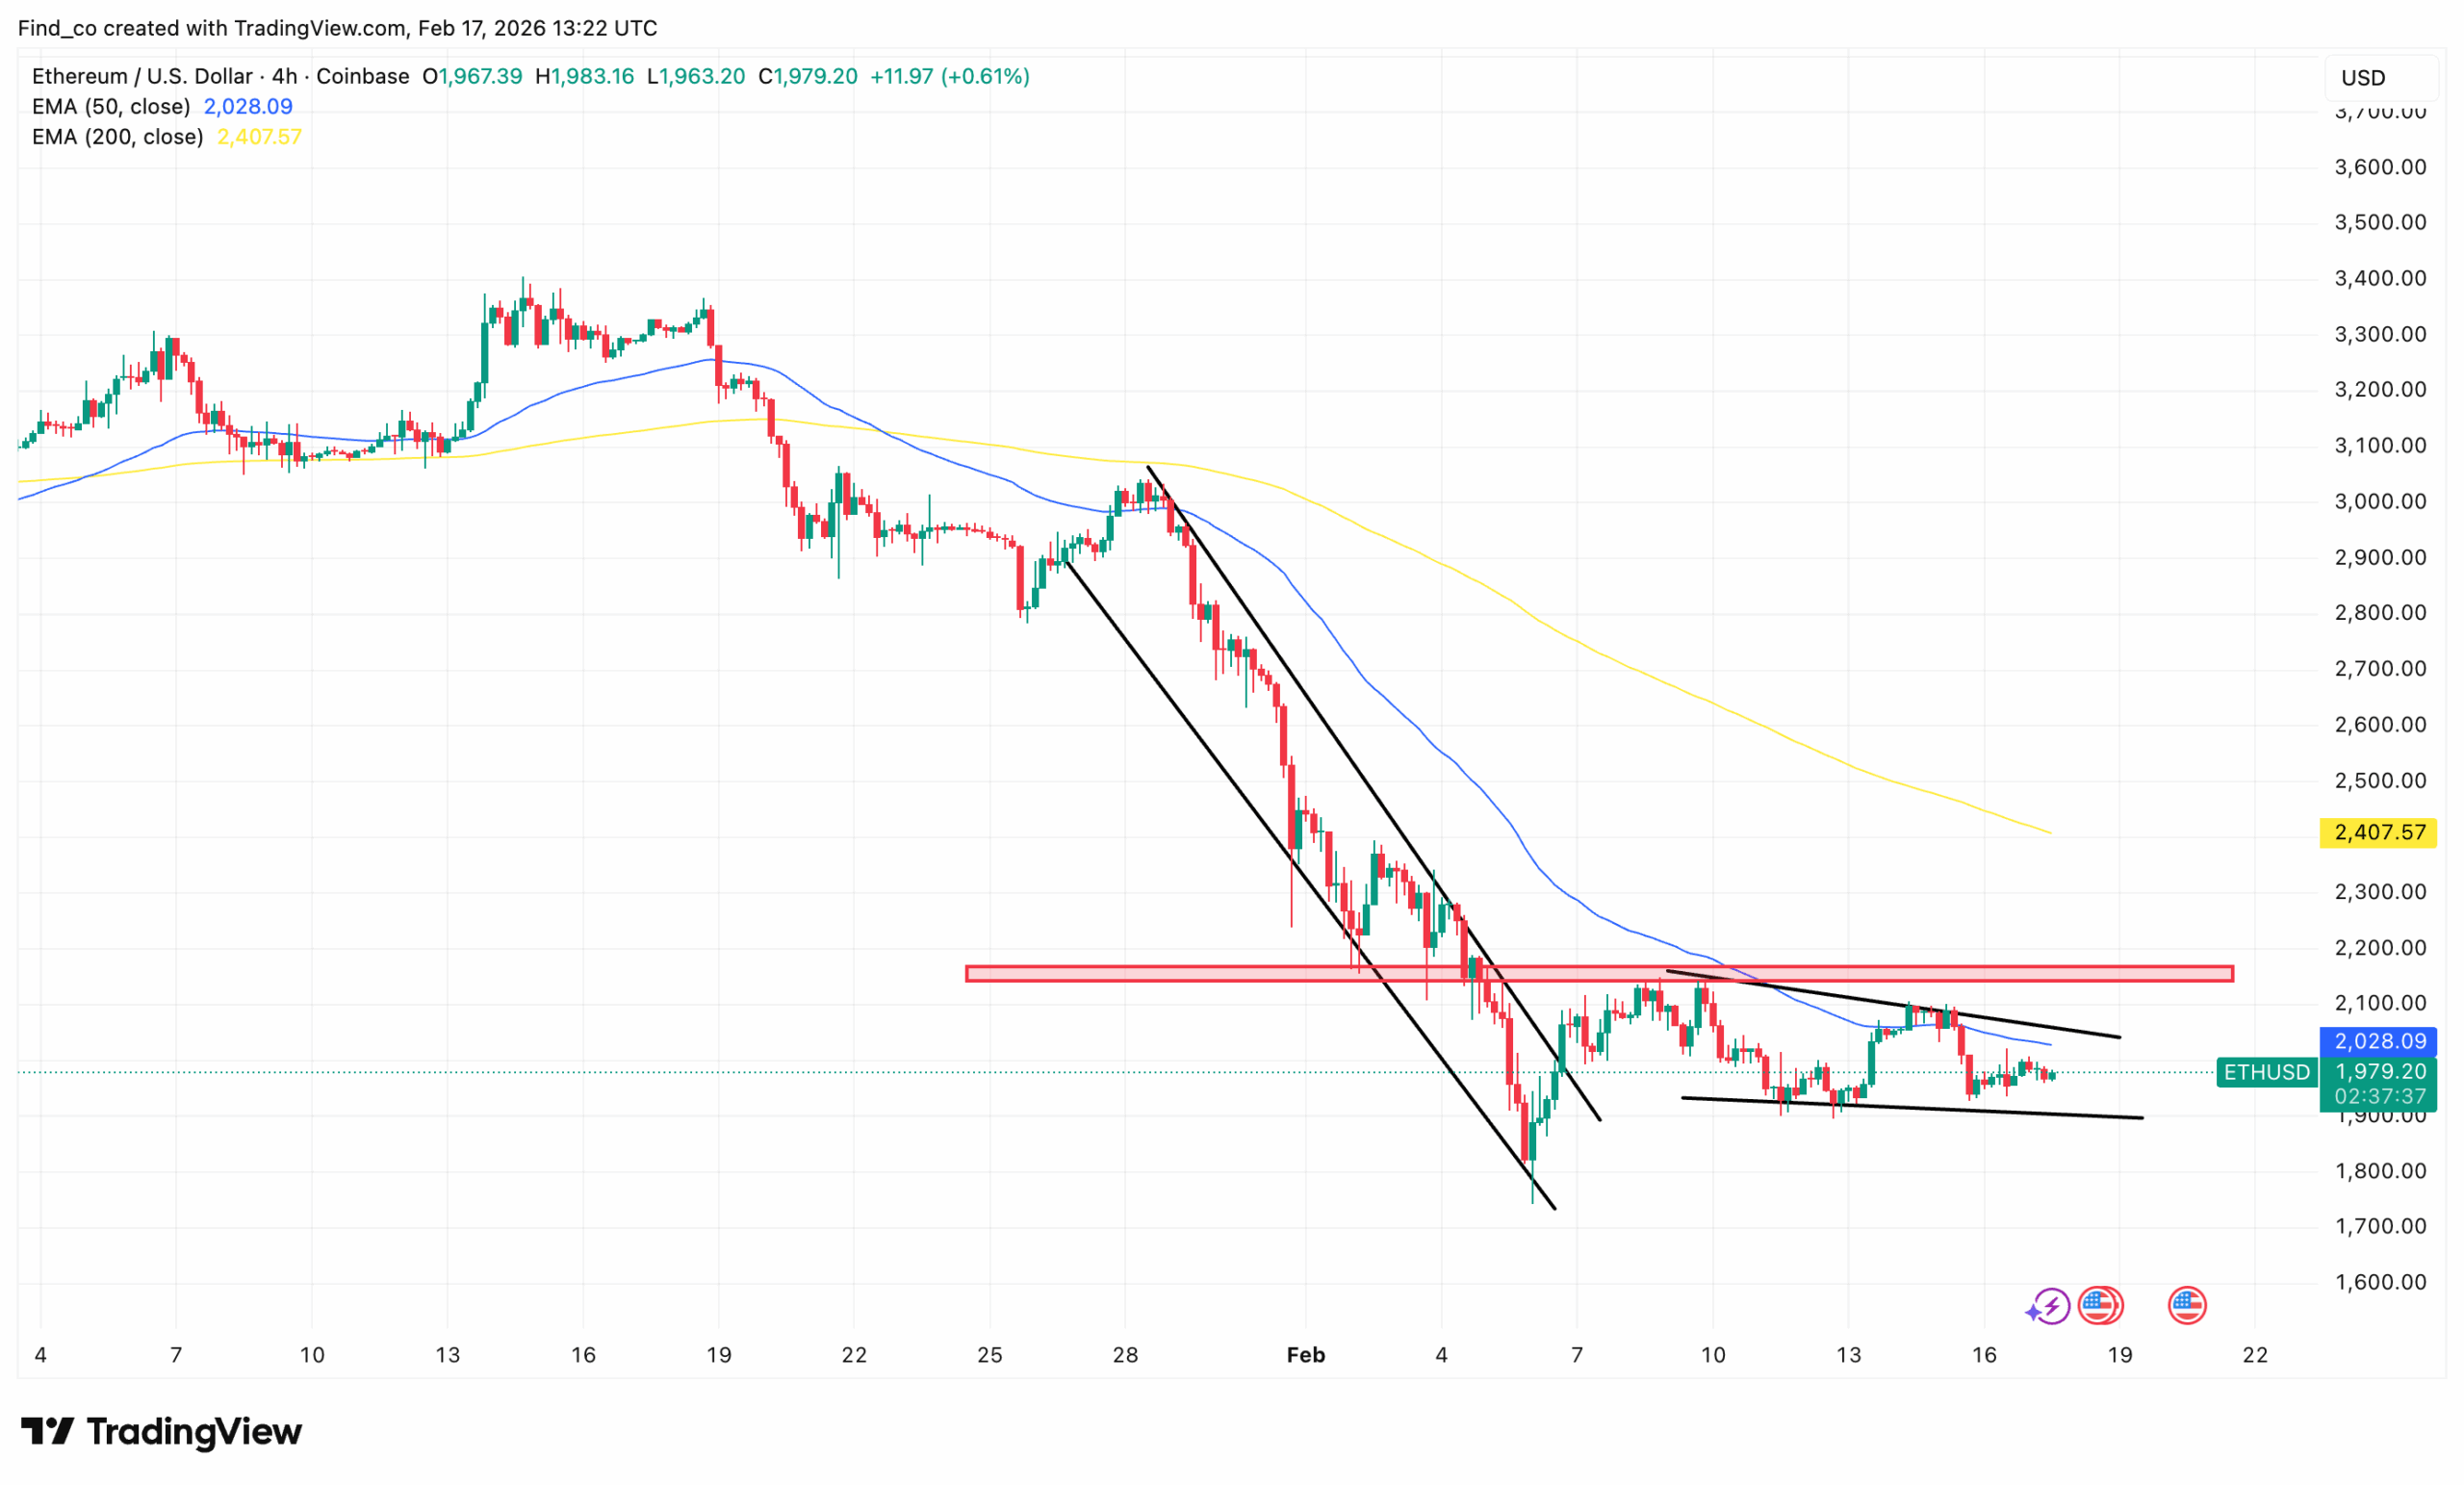
Meanwhile, Ethereum’s price is trading below its 50-, 100-, and 200-period moving averages — all of which are sloping downward.
That’s not a sideways trend. That’s a confirmed bearish structure.
ETH/USD 4-Hour Chart | Credit: TradingView
Is There Any Good News for ETH?
Yes, but it’s long-term.
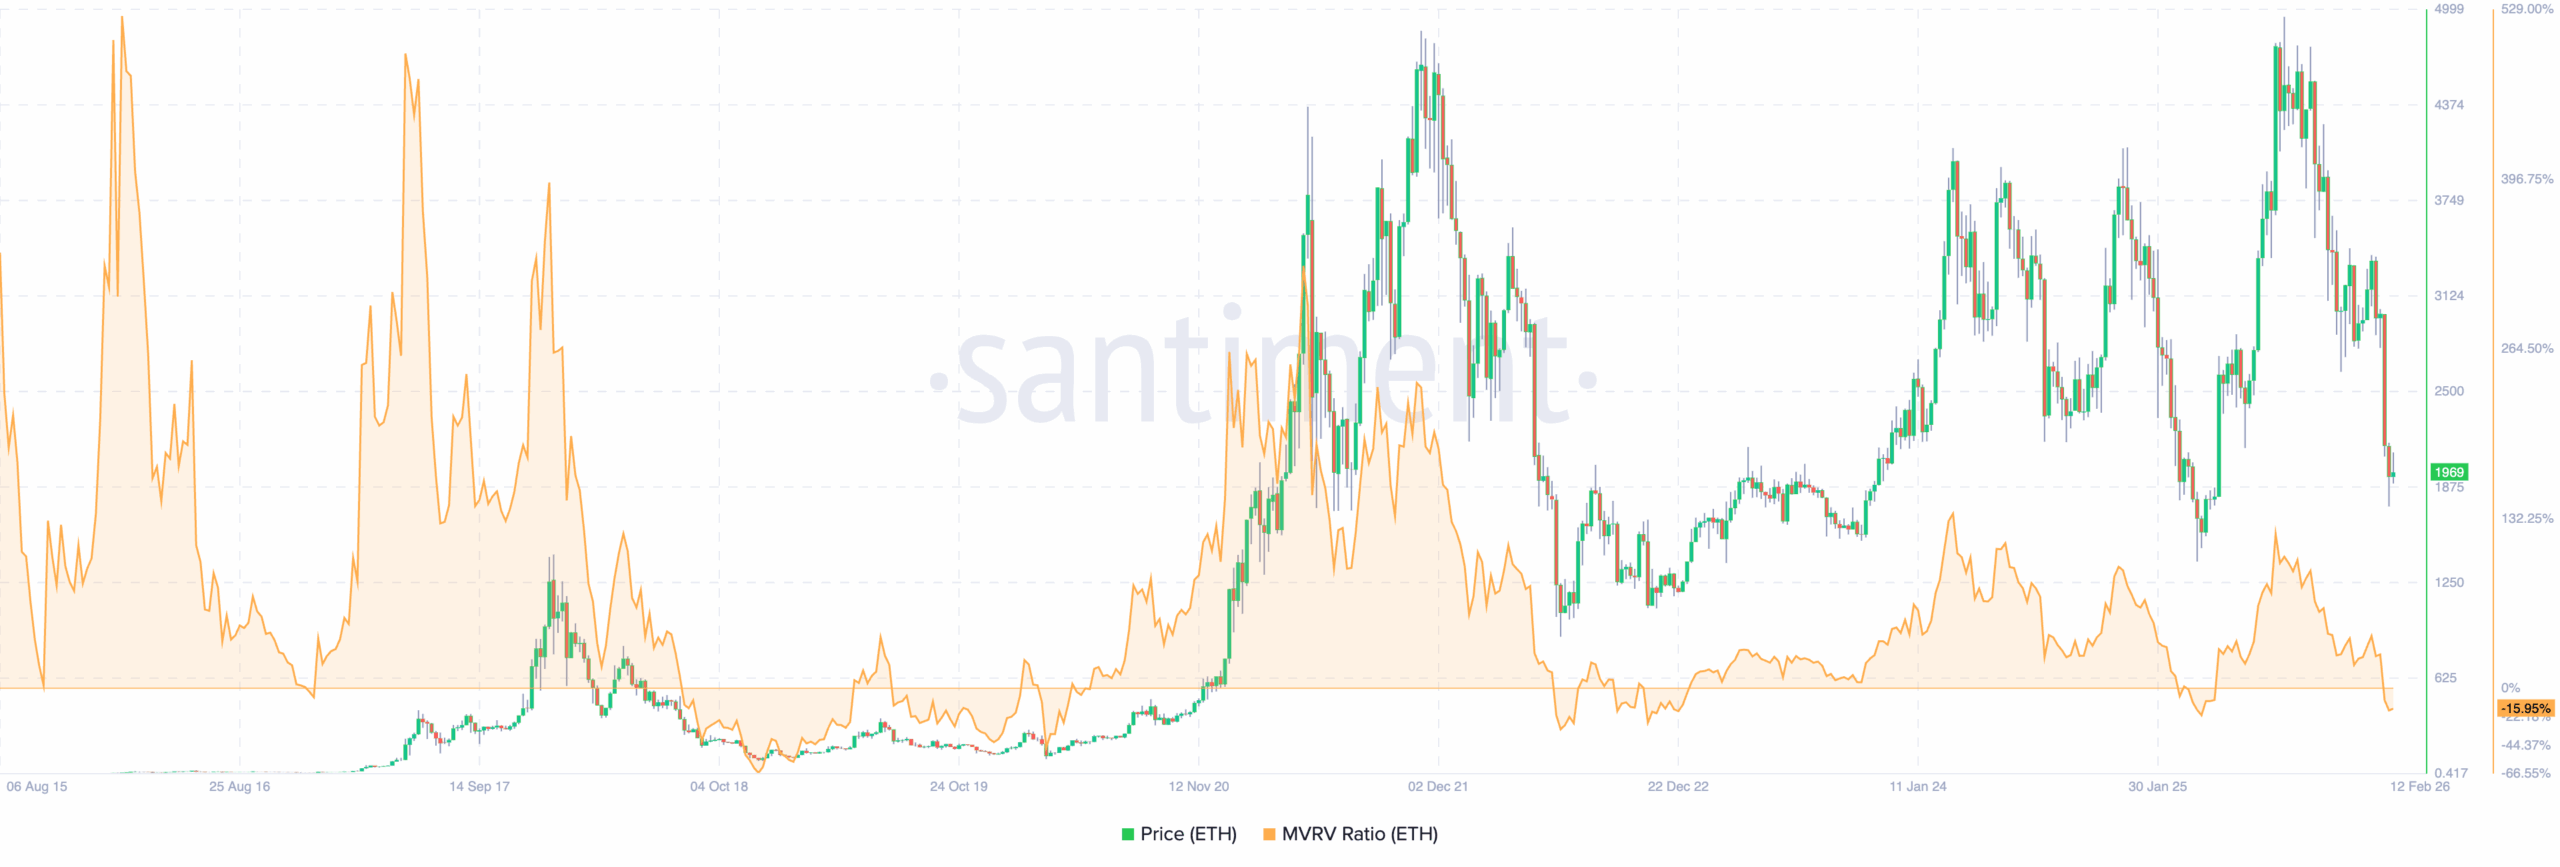
Ethereum’s Market Value to Realized Value (MVRV) ratio has entered what analysts call the “opportunity zone,” a range historically associated with selling exhaustion and eventual recovery.
However, historically, demand has to increase for Ethereum’s price to reflect the MVRV ratio. Unfortunately, that is not the case right now.
As such, ETH will likely close in on $1,500 before it makes a notable rebound.
Institutional interest remains intact, with BlackRock’s iShares Ethereum Trust and Grayscale’s Mini Trust posting notable inflows in early February.
Furthermore, the Fusaka network upgrade, launched in December 2025, introduced PeerDAS for 8x higher data throughput and significantly reduced Layer-2 fees — strong fundamentals that haven’t gone away.
But all in all, this does not imply that ETH’s price will rebound significantly anytime soon.
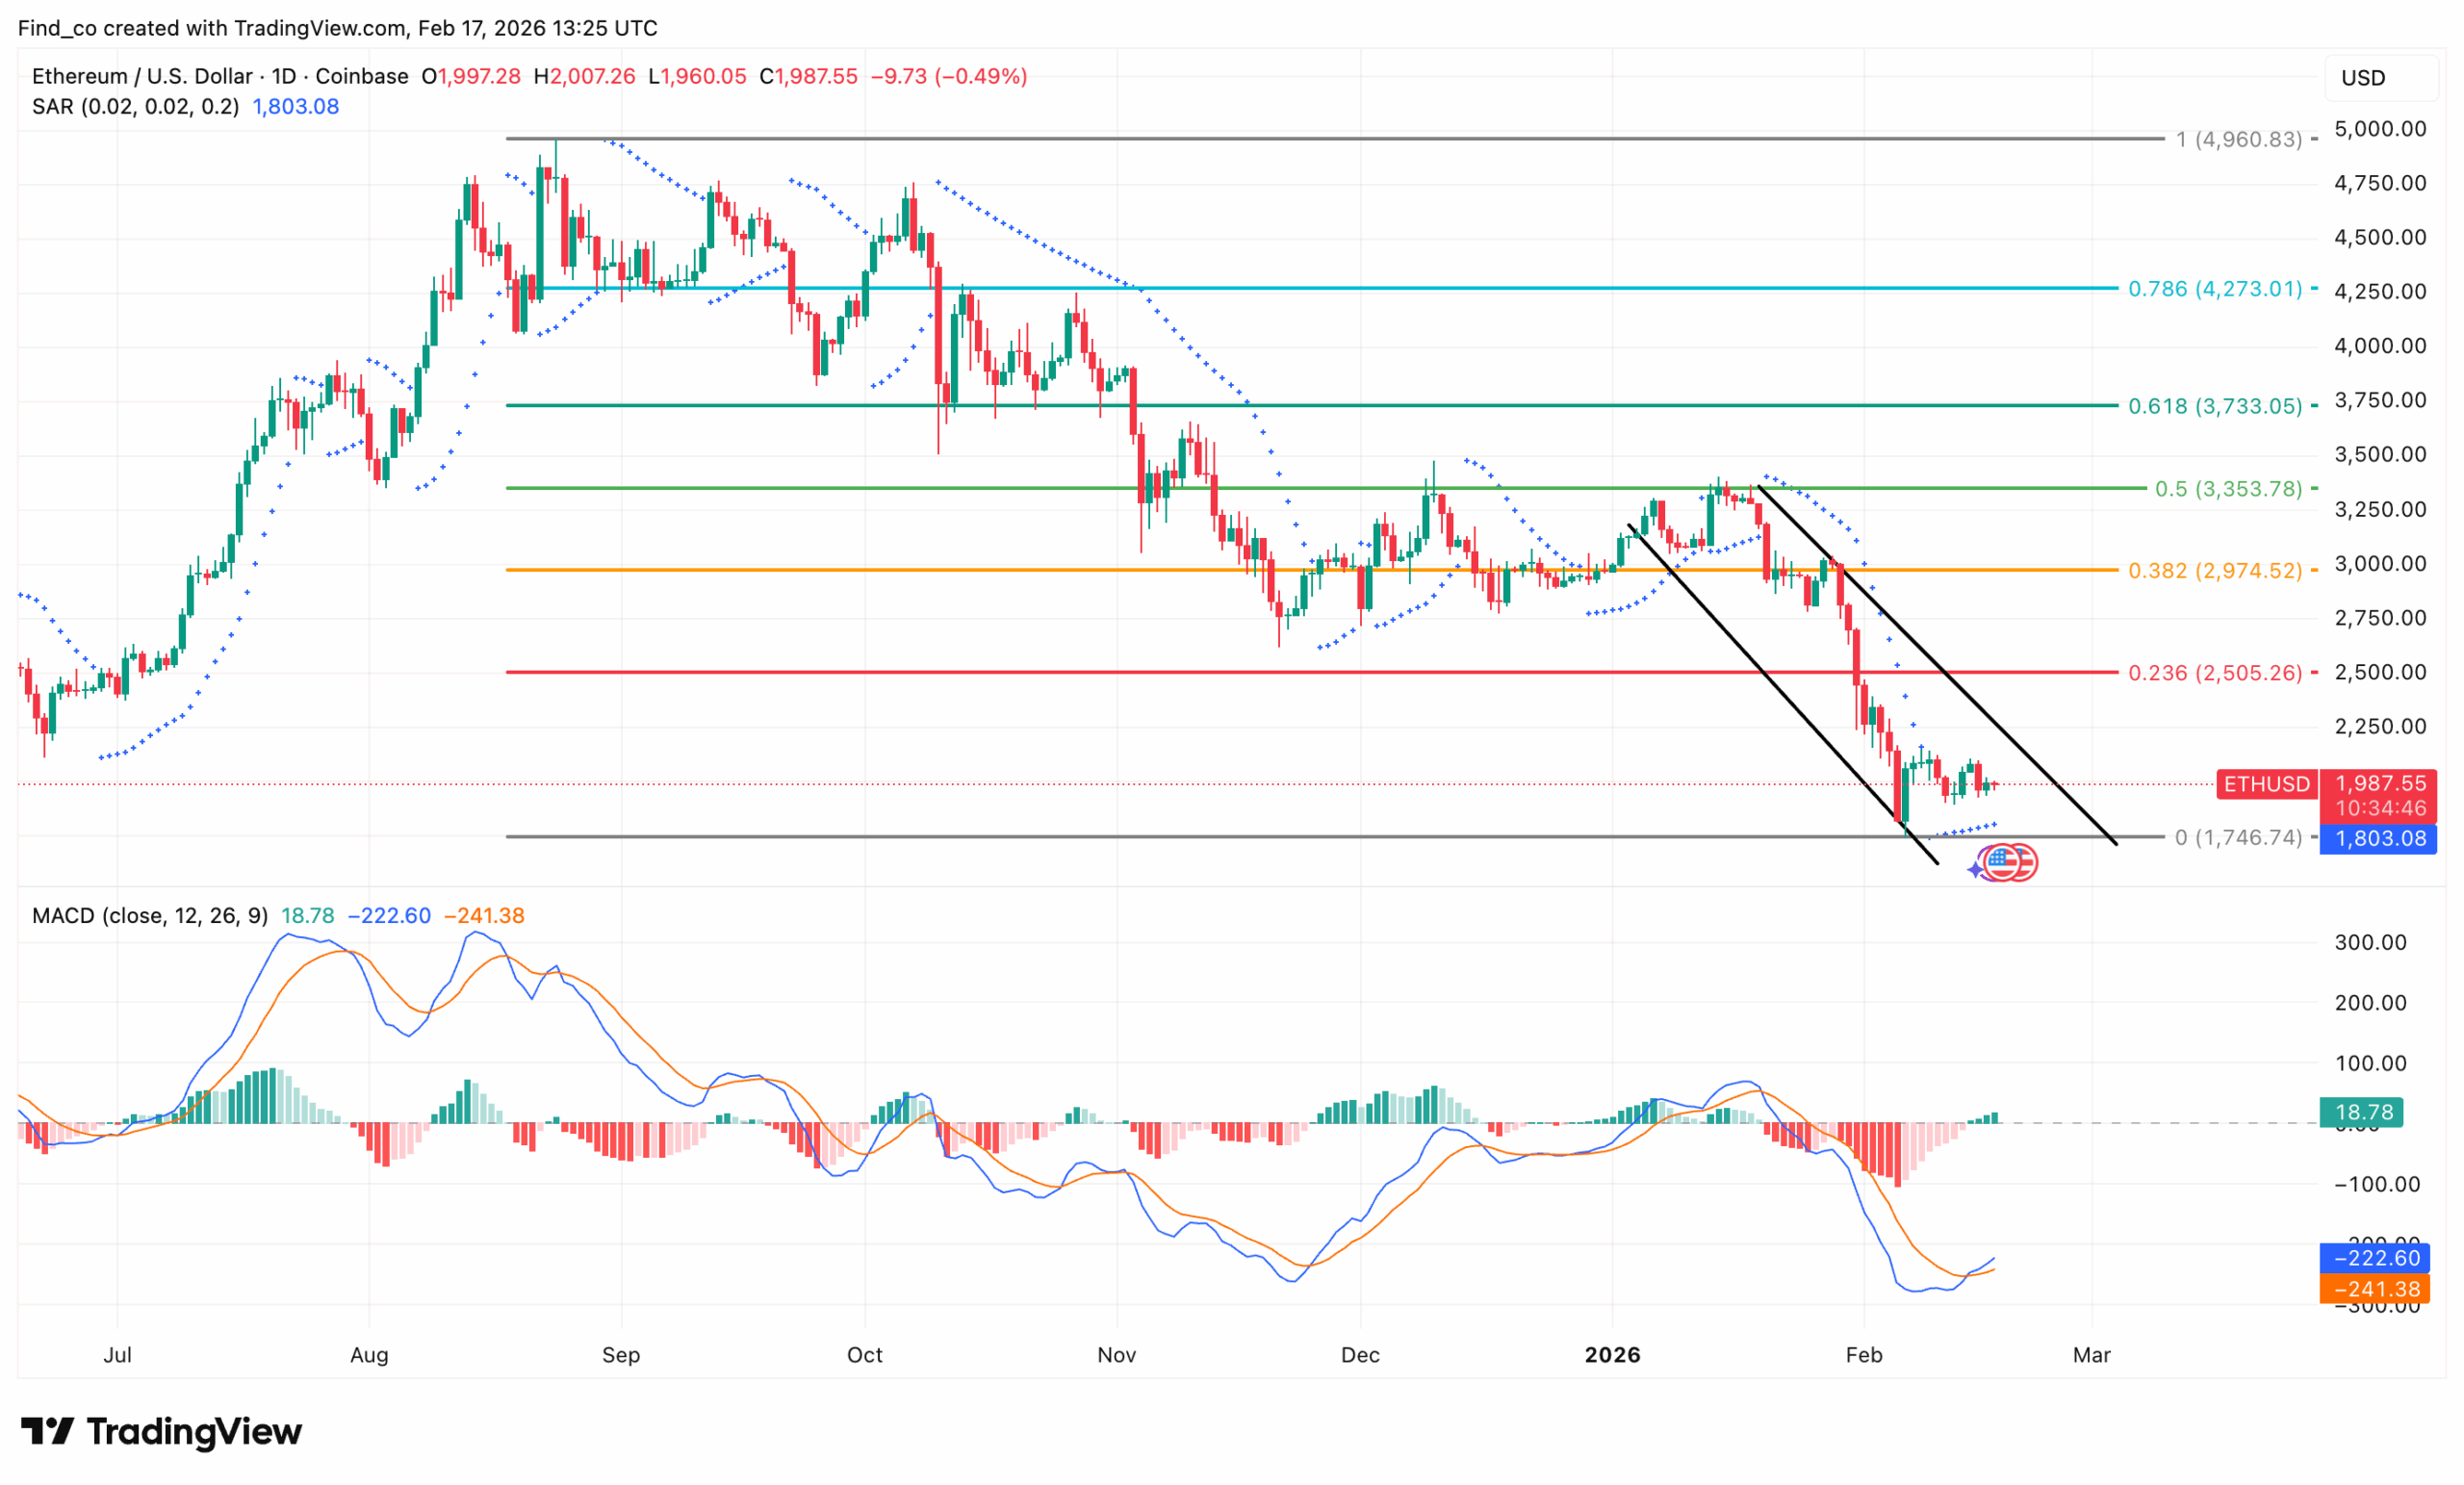
ETH Price Analysis
Ethereum’s short-term outlook remains bearish. The next key support sits at $1,900. A break below that could expose ETH to $1,800 or lower.
The recent selloff pushed the price into the 0.236 retracement zone, with the current range forming just above the $1,746 support.
Structurally, this is a critical demand zone, as it marks the last significant higher-timeframe support.
The descending channel drawn from the recent highs is still intact, and ETH’s price is currently compressing near its lower boundary.
For bulls to regain control, Ethereum would need to reclaim the $2,250 region and break the channel structure.
Meanwhile, the Parabolic Stop And Reverse (SAR) remains above Ethereum’s price, reinforcing the prevailing downward bias. However, the recent clustering of smaller candles near support indicates volatility contraction.
In addition, the Moving Average Convergence Divergence (MACD) is deeply negative but beginning to flatten. That reflects waning downside momentum.
Disclaimer:
The information provided in this article is for informational purposes only. It is not intended to be, nor should it be construed as, financial advice. We do not make any warranties regarding the completeness, reliability, or accuracy of this information. All investments involve risk, and past performance does not guarantee future results. We recommend consulting a financial advisor before making any investment decisions.
Victor Olanrewaju is a crypto analyst and reporter at CCN with deep roots in on-chain research and technical analysis. His crypto journey began in 2017, but it was the 2020 Uniswap airdrop that sparked a full-time pivot into the space.
With a foundation in copywriting, Victor honed his craft creating high-converting content for leading crypto brokers — most notably an XRP price prediction that ranked #1 on Google during the 2021 bull run.
He later joined AMBCrypto in 2022, where he combined storytelling with technical and on-chain analysis to cover key market narratives.
In 2024, he expanded his expertise at BeInCrypto, collaborating with analysts and using tools like Glassnode, Santiment, and IntoTheBlock to break down Bitcoin and altcoin trends.
At CCN, Victor covers the top cryptocurrencies, memecoins, macro shifts, blending real-time insights with deep-dive metrics.
He holds a Bachelor’s degree in Physics from the University of Ibadan, equipping him to simplify complex data for a wide audience. Follow his work or connect on LinkedIn or X.