New Hampshire Plans $100M Bitcoin-Backed Bonds — What Citizens Need to Know. Credit: CCN.
Share
Key Takeaways
MARA Holdings sold 15,133 BTC worth over $1 billion between March 4 and March 25, reducing its holdings by approximately 28% and pushing Bitcoin below $70,000.
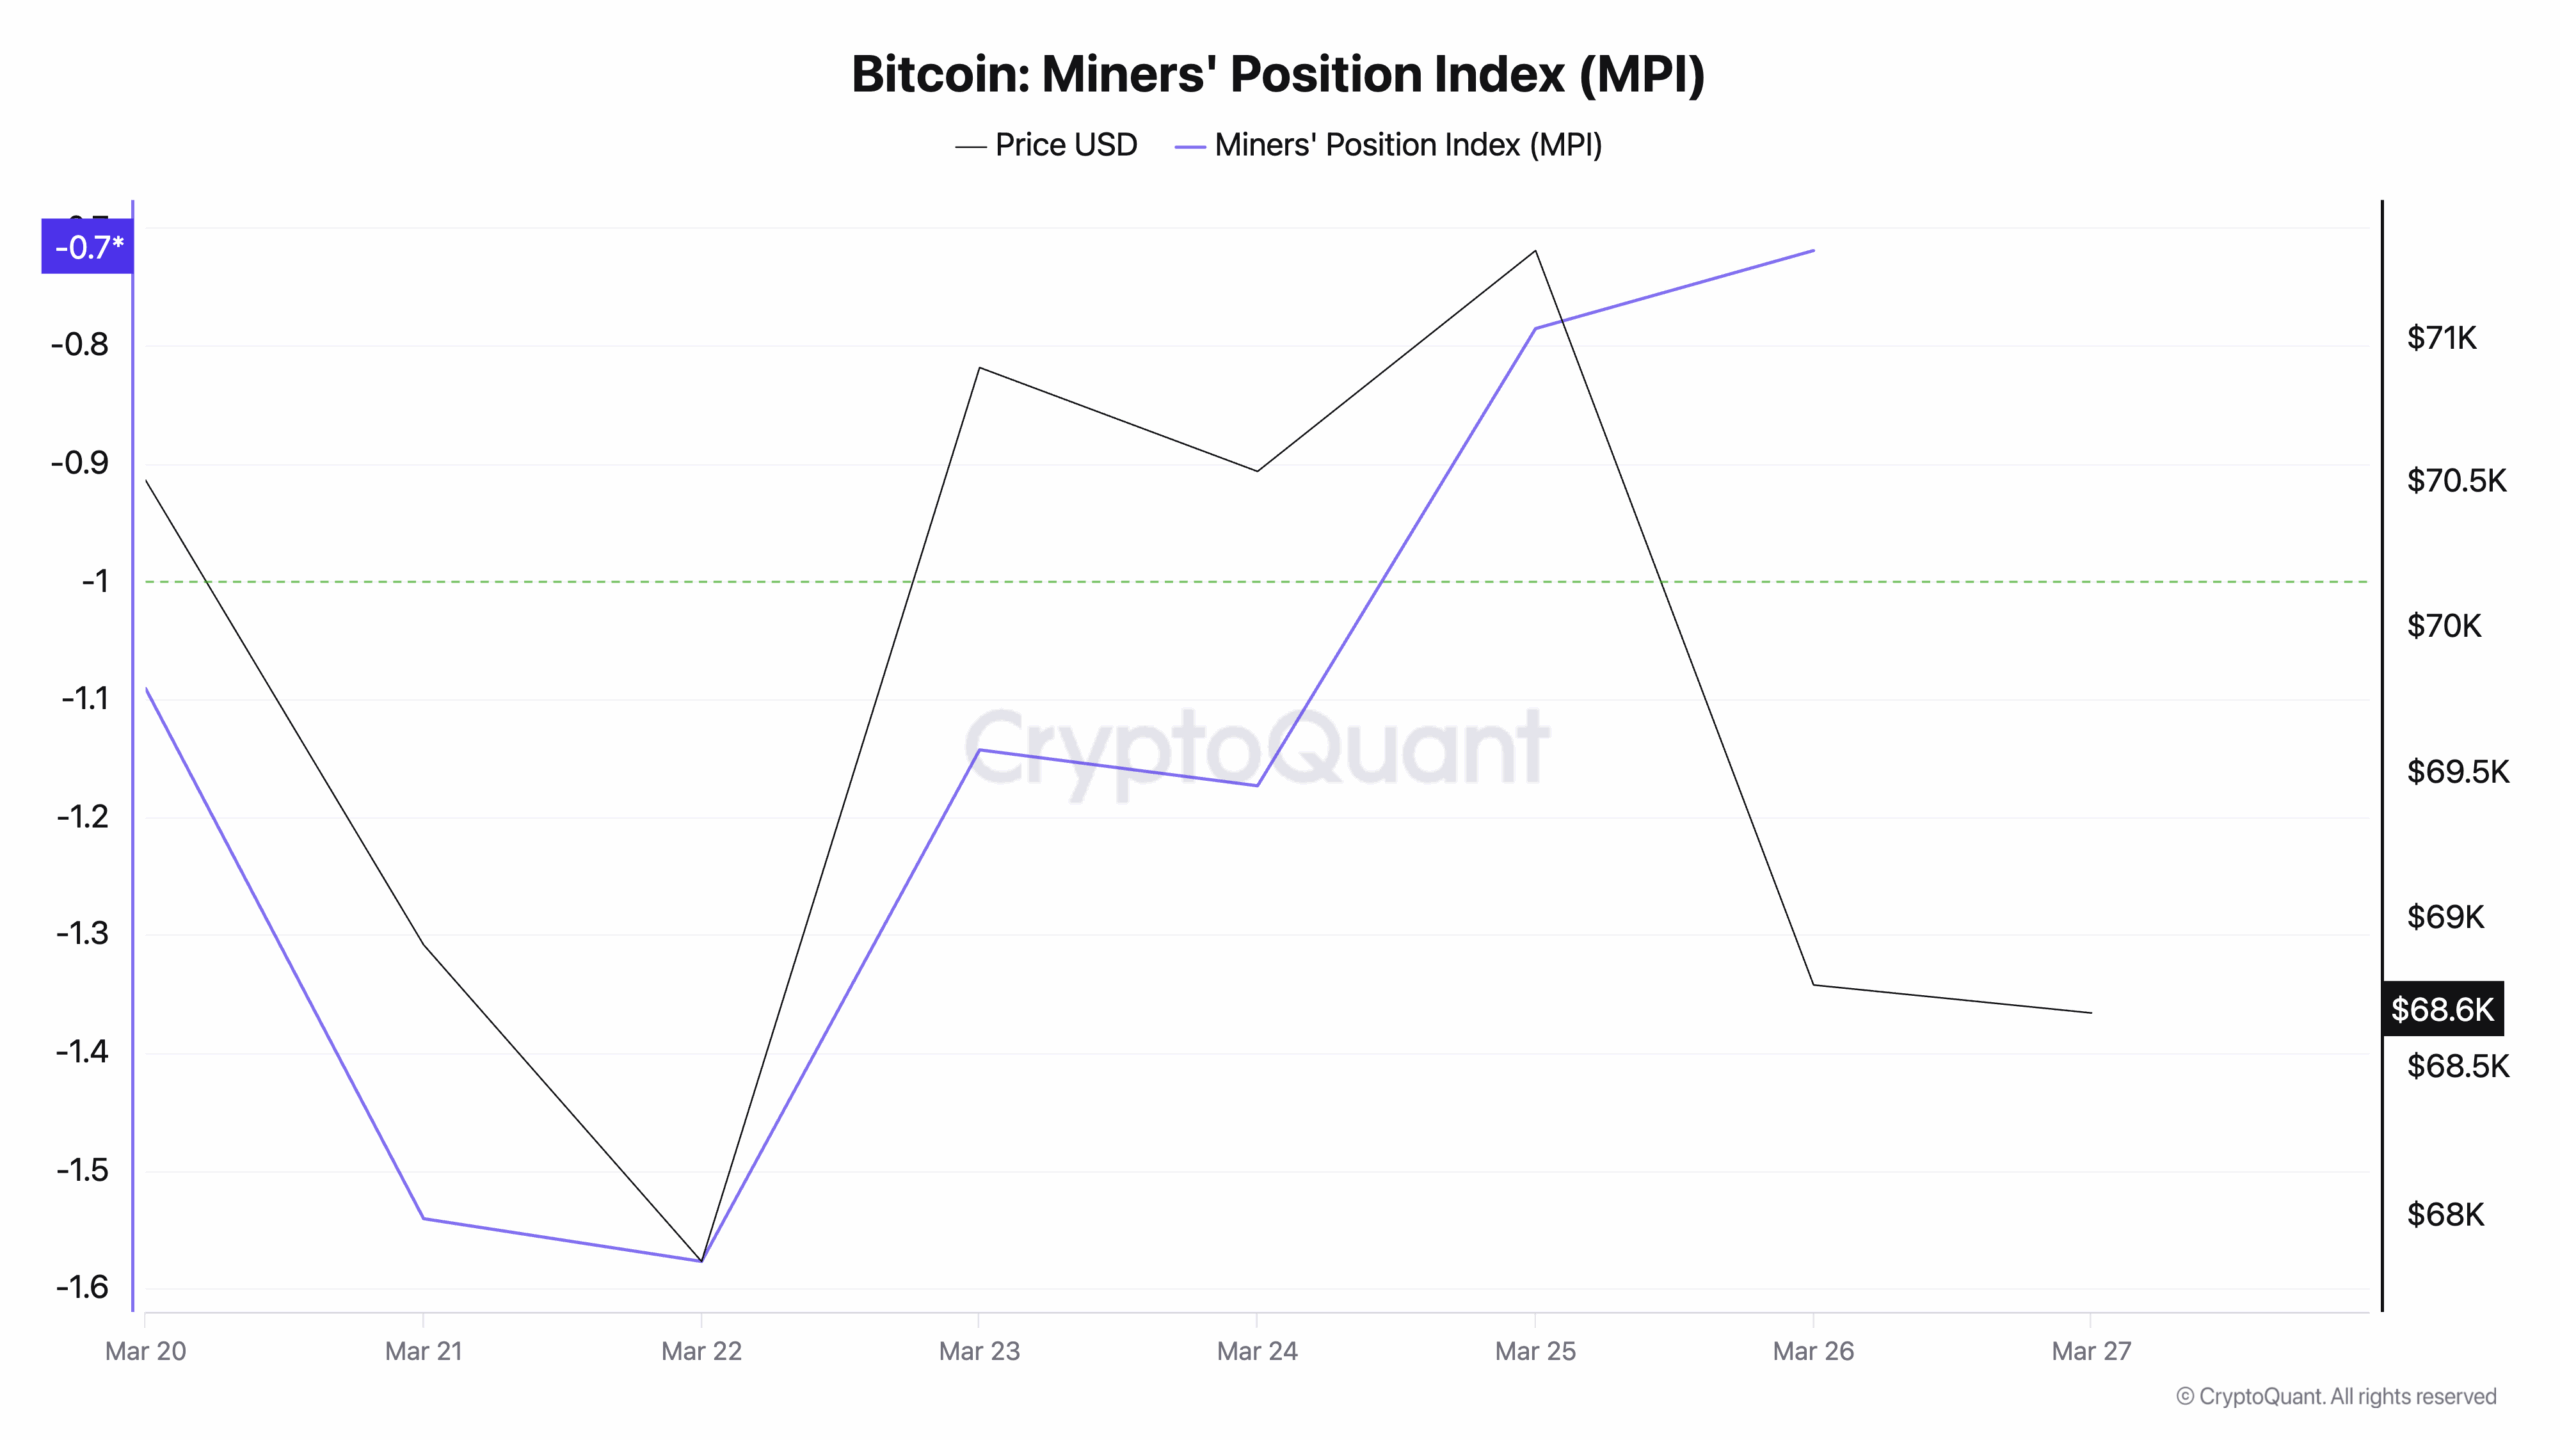
Bitcoin’s MPI has climbed to a seven-day high, signaling a broader uptick in miner selling that could sustain downward price pressure.
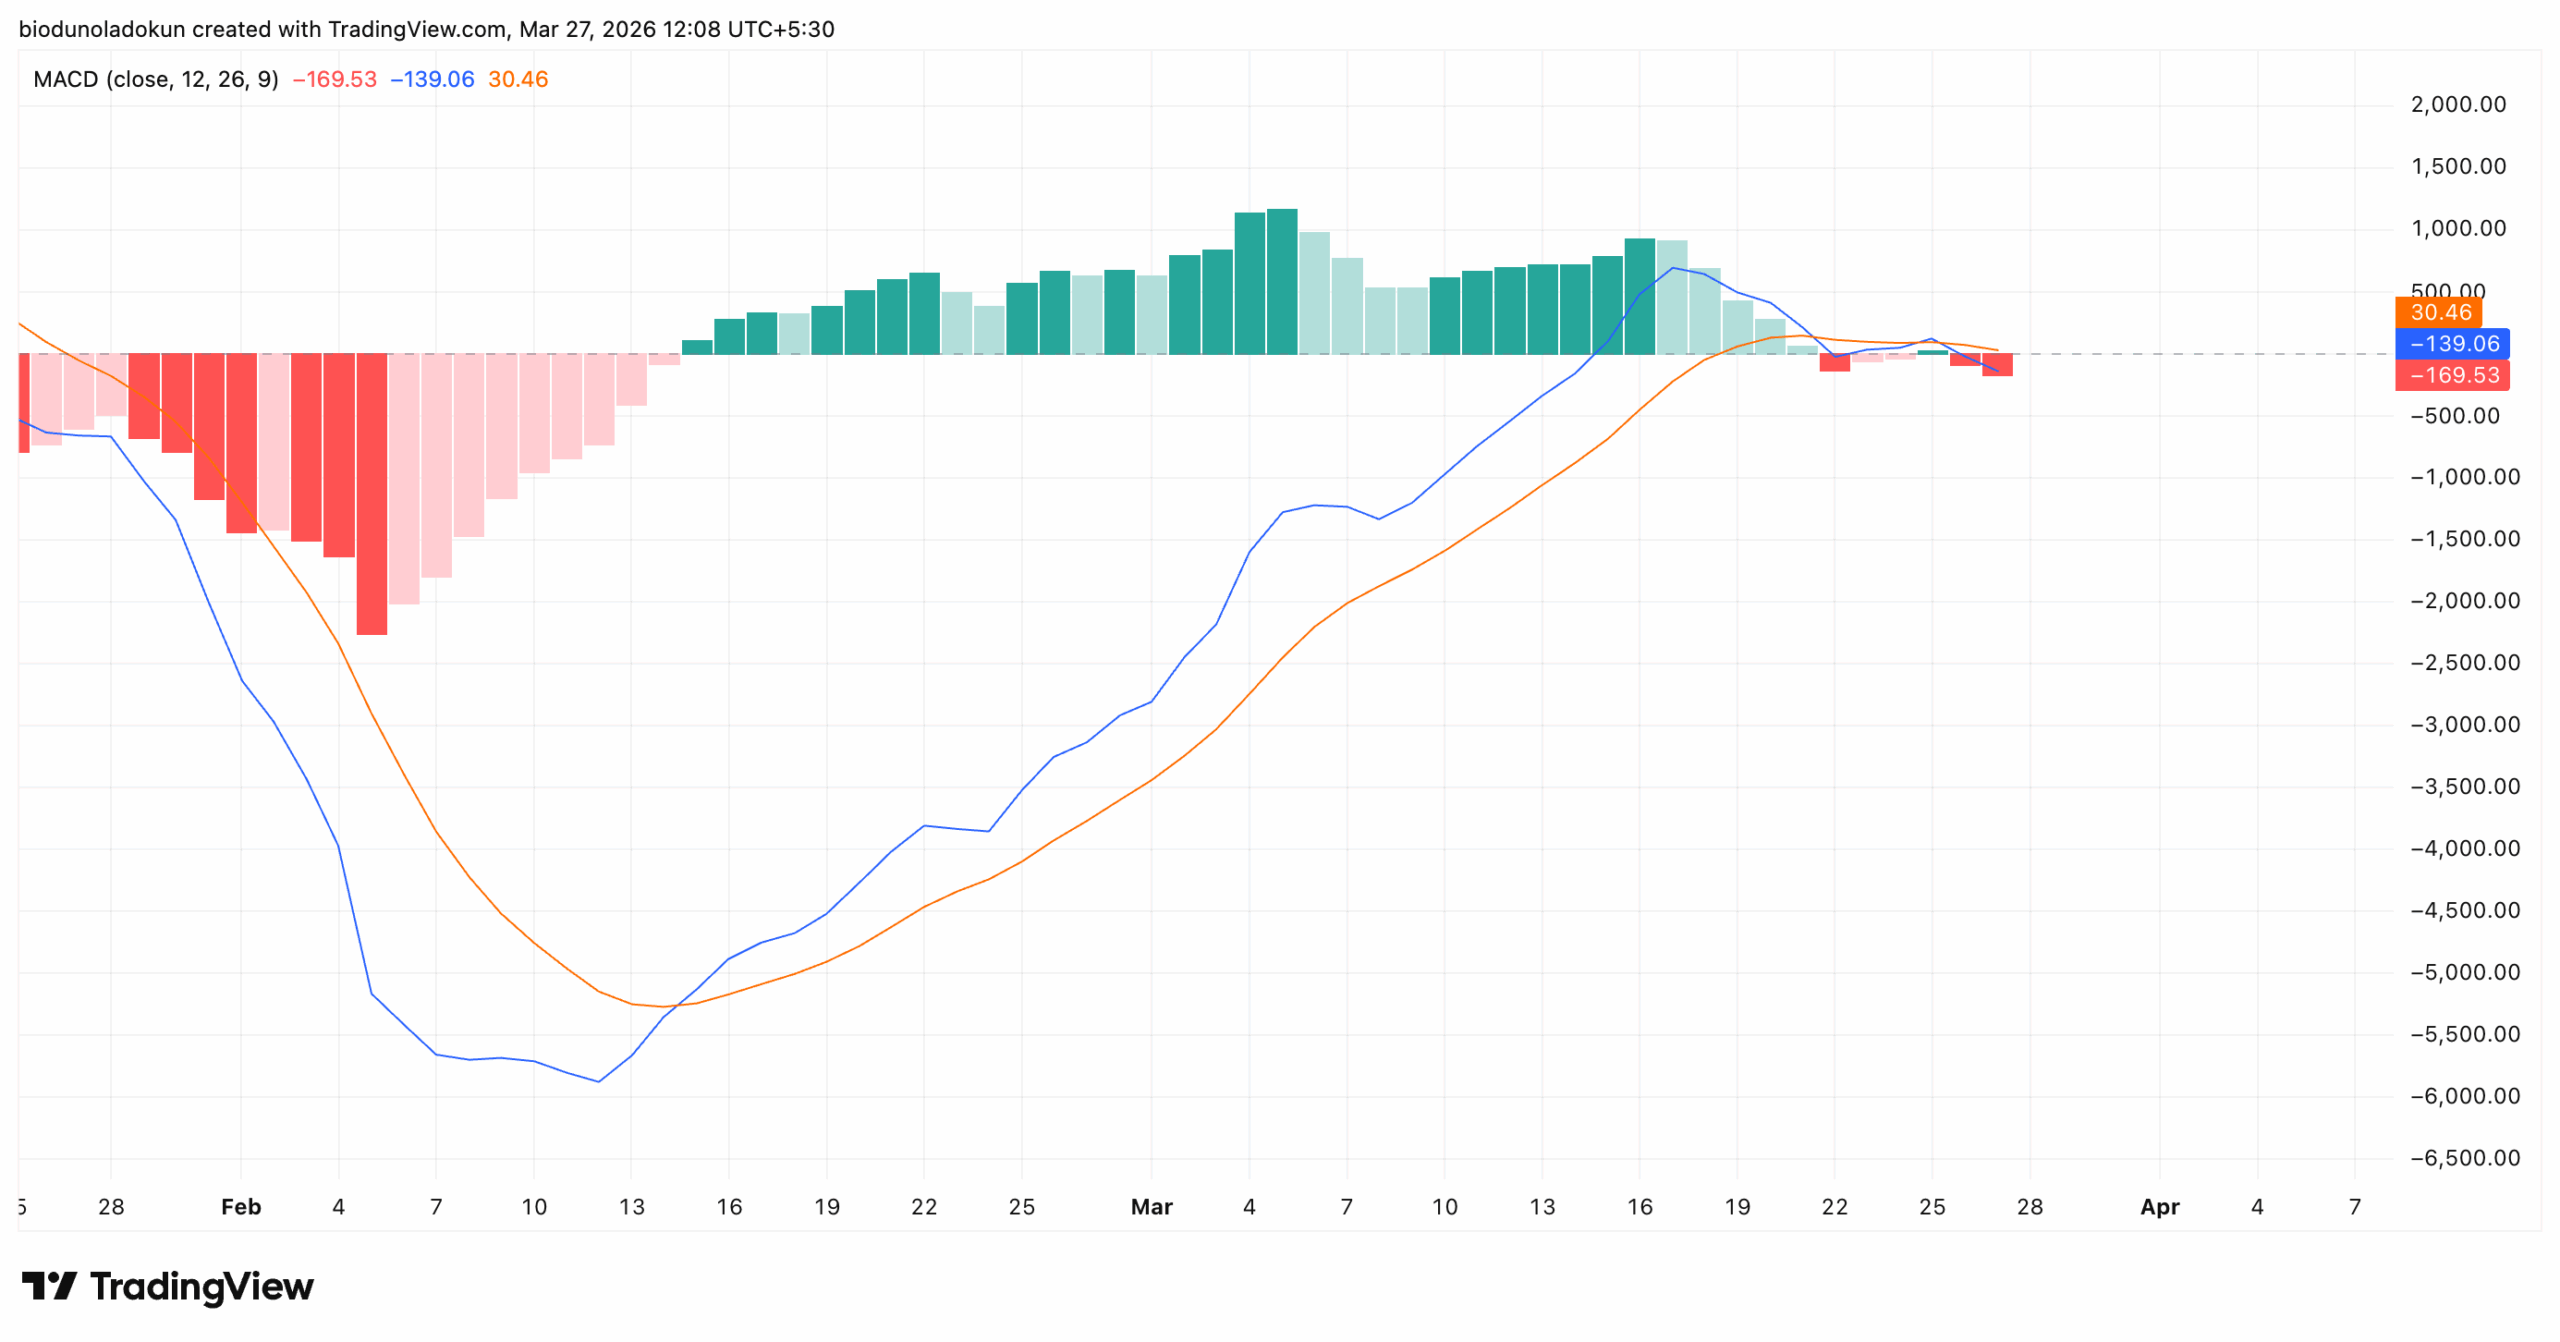
BTC’s MACD and 20-day EMA both point to continued decline.
Leading coin Bitcoin has failed to hold the $70,000 level it had been testing over the past several days, closing below it yesterday and extending losses into Friday.
BTC is currently down 2% on the day, with rising trading volume forming a bearish divergence. At press time, volume is up 12%, signaling that sellers are firmly in control.
The decline comes against a broader macro backdrop that has kept the coin largely rangebound for much of the past month, with investor sentiment remaining subdued amid persistent macroeconomic uncertainty.
Adding to the pressure, the world’s largest Bitcoin miner recently confirmed the sale of a significant portion of its coin holdings, a move that has worsened the already-dampening sentiment.
What does this mean for the coin in the near term?
MARA Confirms $1 Billion BTC Liquidation
Bitcoin miner MARA Holdings Inc. confirmed yesterday that it sold 15,133 BTC — valued at over $1 billion — between March 4 and March 25. The company cited a major balance sheet overhaul as the rationale behind the sale. This sale has reduced Mara’s Bitcoin holdings by about 28%, according to data from BitcoinTreasuries.net.
Miner sell-offs are inherently bearish signals. When they are this significant, the market reacts.
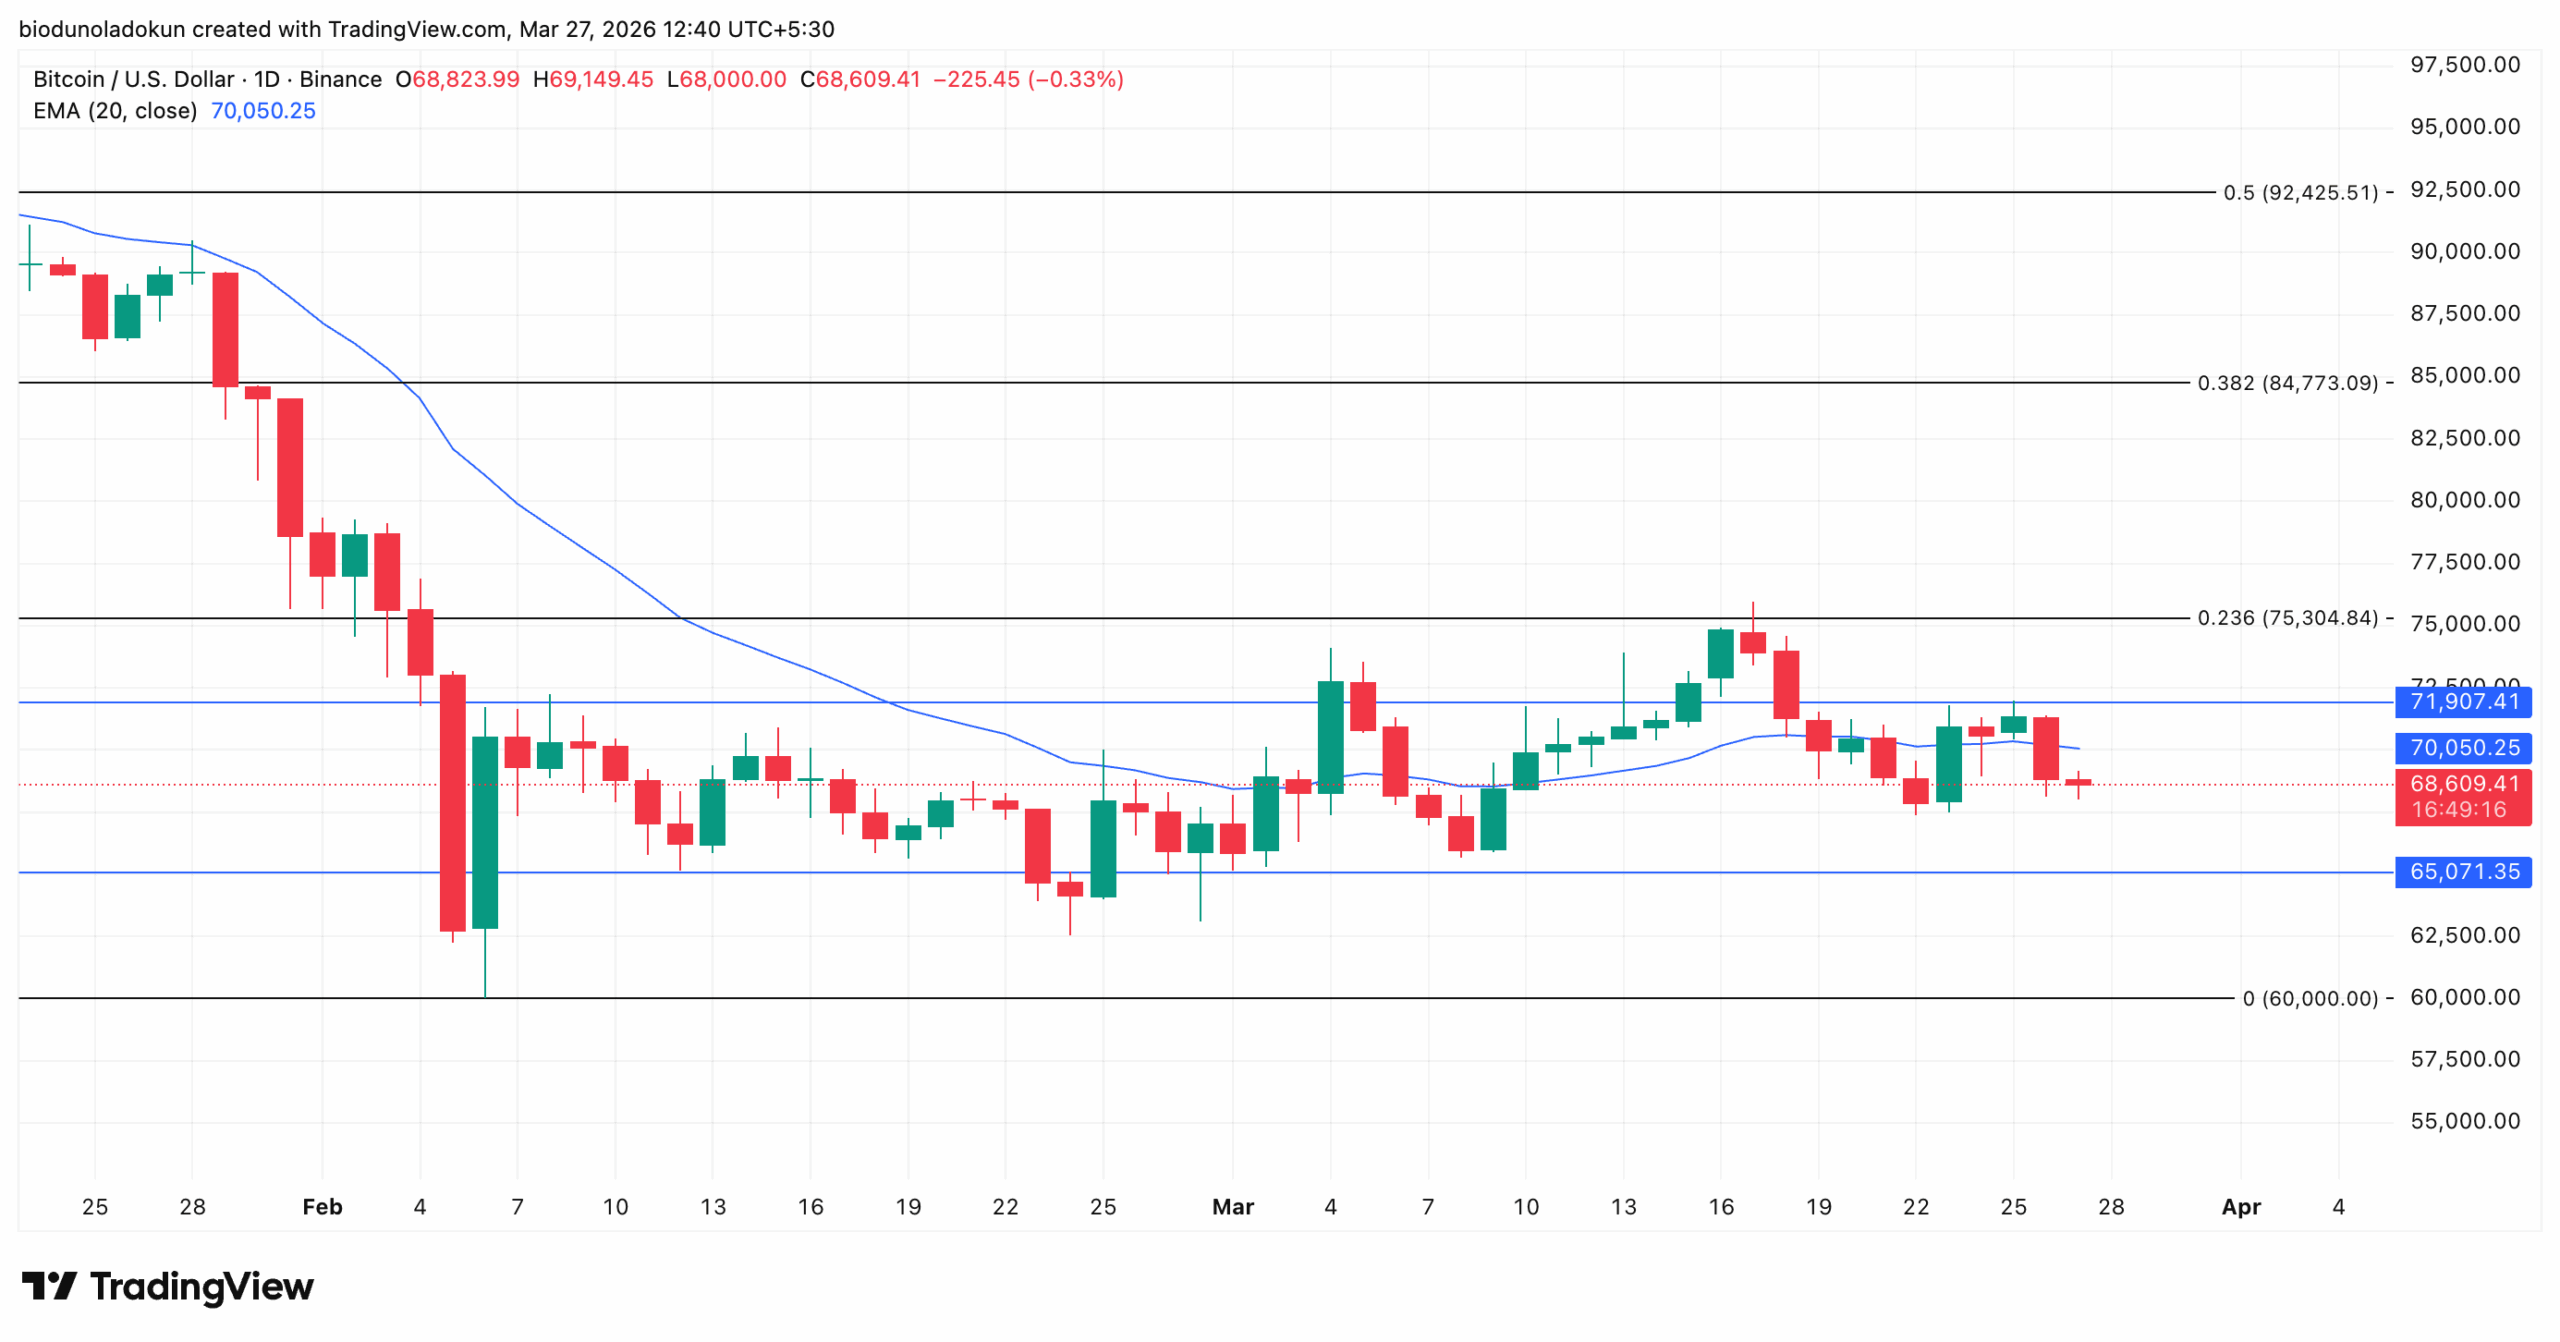
The news of MARA’s BTC sale yesterday sent Bitcoin closing below key resistance at $71,907 and the psychological $70,000 mark. With dwindling demand, the coin now trades at $68,669 and appears poised to fall lower.
Broader Miner Activity Raises Concern
The MARA sale does not appear to be an isolated event. A wider look at on-chain mining activity across the Bitcoin network reveals a general uptick in miner outflows — a trend that, if sustained, could translate into prolonged price headwinds as additional supply hits the market.
According to CryptoQuant, the coin’s Miners’ Position Index (MPI) has soared significantly over the past week, reaching a seven-day high of -0.71 at press time.
Bitcoin Miners’ Position Index | Credit: CryptoQuant
The MPI measures the ratio of miner outflows to their one-year moving average. A falling MPI signals that miners are accumulating or holding.
On the other hand, when it climbs like this, it suggests increased selling pressure from miners, indicating they may be offloading coins in anticipation of a market downturn or to fund rising operational costs.
Bitcoin’s Technical Picture Darkens
BTC’s 2% dip over the past day has pushed its price below its 20-day exponential moving average on the daily chart.
As of this writing, this key moving average, which once served as a support floor, now forms resistance above BTC at $70,050.
The 20-day EMA averages an asset’s price over the past 20 trading days, giving recent price changes greater weight. When an asset trades above its 20-day EMA, the market favors accumulation and is attempting to drive prices higher.
Conversely, when the price falls below this line, it signals that bears maintain control, and short-term sentiment is tilted toward the downside. This heightens the likelihood of a continued decline in BTC prices.
Moreover, readings from the coin’s Moving Average Convergence Divergence (MACD) reinforce the bearish outlook. The MACD line currently sits below the signal line while the histogram has flipped red and grown in size over the past two sessions, a sign that downside momentum is building.
An asset’s MACD indicator identifies trends and momentum in its price movement. It helps traders spot potential buy or sell signals through crossovers between the MACD and signal lines.
When the MACD line crosses above the signal line, it indicates bullish momentum, suggesting the asset’s price may continue to rise. Traders see this crossover as a buy signal and often increase demand as a result.
However, as with BTC, when an asset’s MACD line is below the signal line, and the histogram is expanding red, it indicates that bearish momentum is strengthening and that sellers are increasingly in control.
For Bitcoin, this raises the possibility of further downside if buyers fail to step in at current levels.
Bitcoin Risks $65,000 Support — But a Rally to $75,304 Remains Possible
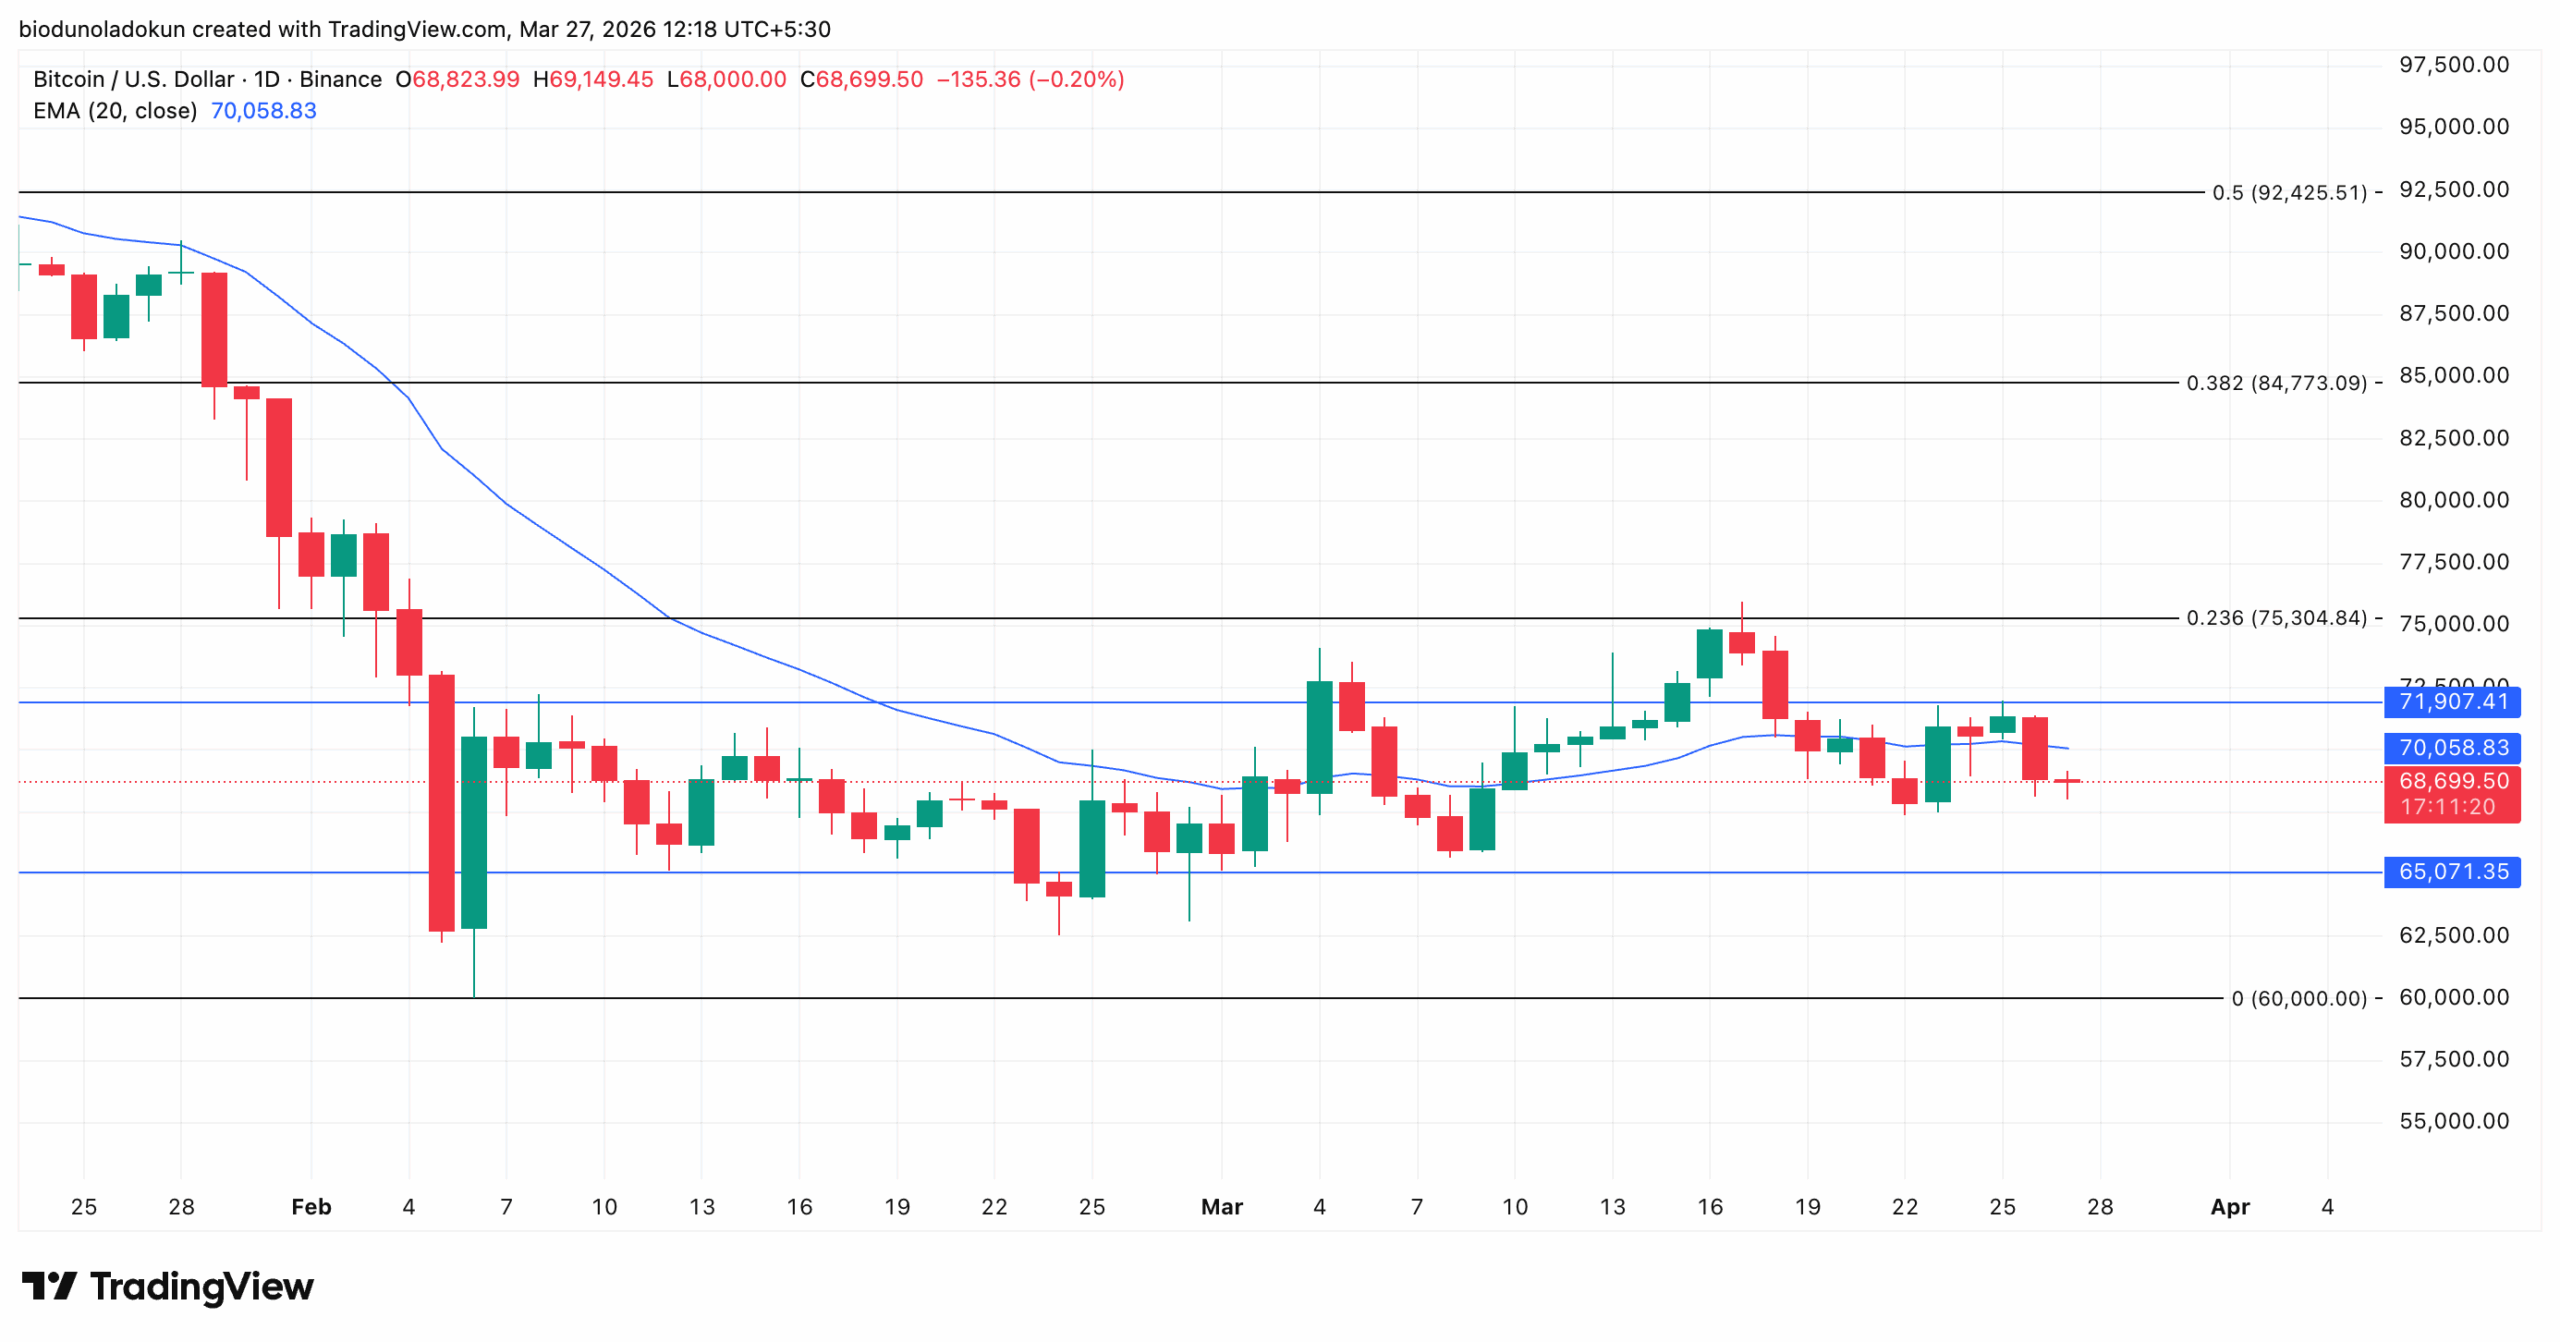
At press time, BTC trades at $68,699 below its 20-day EMA of $70,058 and well beneath the $71,907 resistance level.
With the coin already struggling at these levels, sustained miner selling and broader market pressure could push it down to the $65,071 support level.
Should bulls fail to defend that floor, the coin may fall to $60,000, a low last reached on February 6.
Conversely, if demand soars and Bitcoin closes above the 20-day EMA, it may breach the $71,907 resistance, opening the door to the 0.236 Fibonacci level at $75,304.
[You-may-like]
Disclaimer:
The information provided in this article is for informational purposes only. It is not intended to be, nor should it be construed as, financial advice. We do not make any warranties regarding the completeness, reliability, or accuracy of this information. All investments involve risk, and past performance does not guarantee future results. We recommend consulting a financial advisor before making any investment decisions.
Abiodun Oladokun is a Research Analyst at CCN, where he covers cryptocurrency markets with a focus on on-chain analysis, technical assessments, and emerging trends across decentralized finance (DeFi), real-world assets (RWA), artificial intelligence (AI), decentralized physical infrastructure networks (DePIN), Layer 2s, and meme coins.
Prior to CCN, he served as a Senior On-Chain Analyst at BeInCrypto, producing market reports spanning diverse crypto sectors.
Before that, he conducted technical analysis and market assessments of various altcoins at AMBCrypto, where he also contributed long-form quarterly research papers on DeFi, NFTs, DAOs, and scaling architectures, leveraging on-chain platforms including Messari, Santiment, DefiLlama, and Dune Analytics.
He began his crypto career as a research analyst at SixthSense DAO, developing blockchain forensic tools to trace the history of stolen assets.
Abiodun is a lawyer called to the Nigerian Bar and the founder of Ilé Ijó, a Lagos-based electronic dance music collective.