Is the gold bull run over? | Credit: Veronica Cestari
Share
Key Takeaways
Gold has recorded an 11% weekly decline, its sharpest seven-day drop since 1983.
Trump’s threat and Iran’s counterthreat seem to have played a role in the carnage.
Data shows that a notable gold recovery is unlikely despite analysts’ bullish bias.
Gold is supposed to surge when the world burns. That is the foundational premise of precious metals investing — the safe haven thesis that has held through decades of crises, conflicts, and economic collapses.
The Iran war, now entering its fourth week, should be gold’s defining moment. Instead, it is delivering one of the metal’s most confounding performances in recent memory.
Over the past seven days, Gold’s price has dropped 11%, posting its biggest weekly loss since 1983.
As a result, it has now crashed to its lowest level since Dec. 15, 2025. Why is this happening, and what could be next for gold?
Tether Gold (XAUT) Flashes Danger as Bearish Divergence Plays Out
Looking at the weekly chart, the warning signs were there, and now they’re materializing.
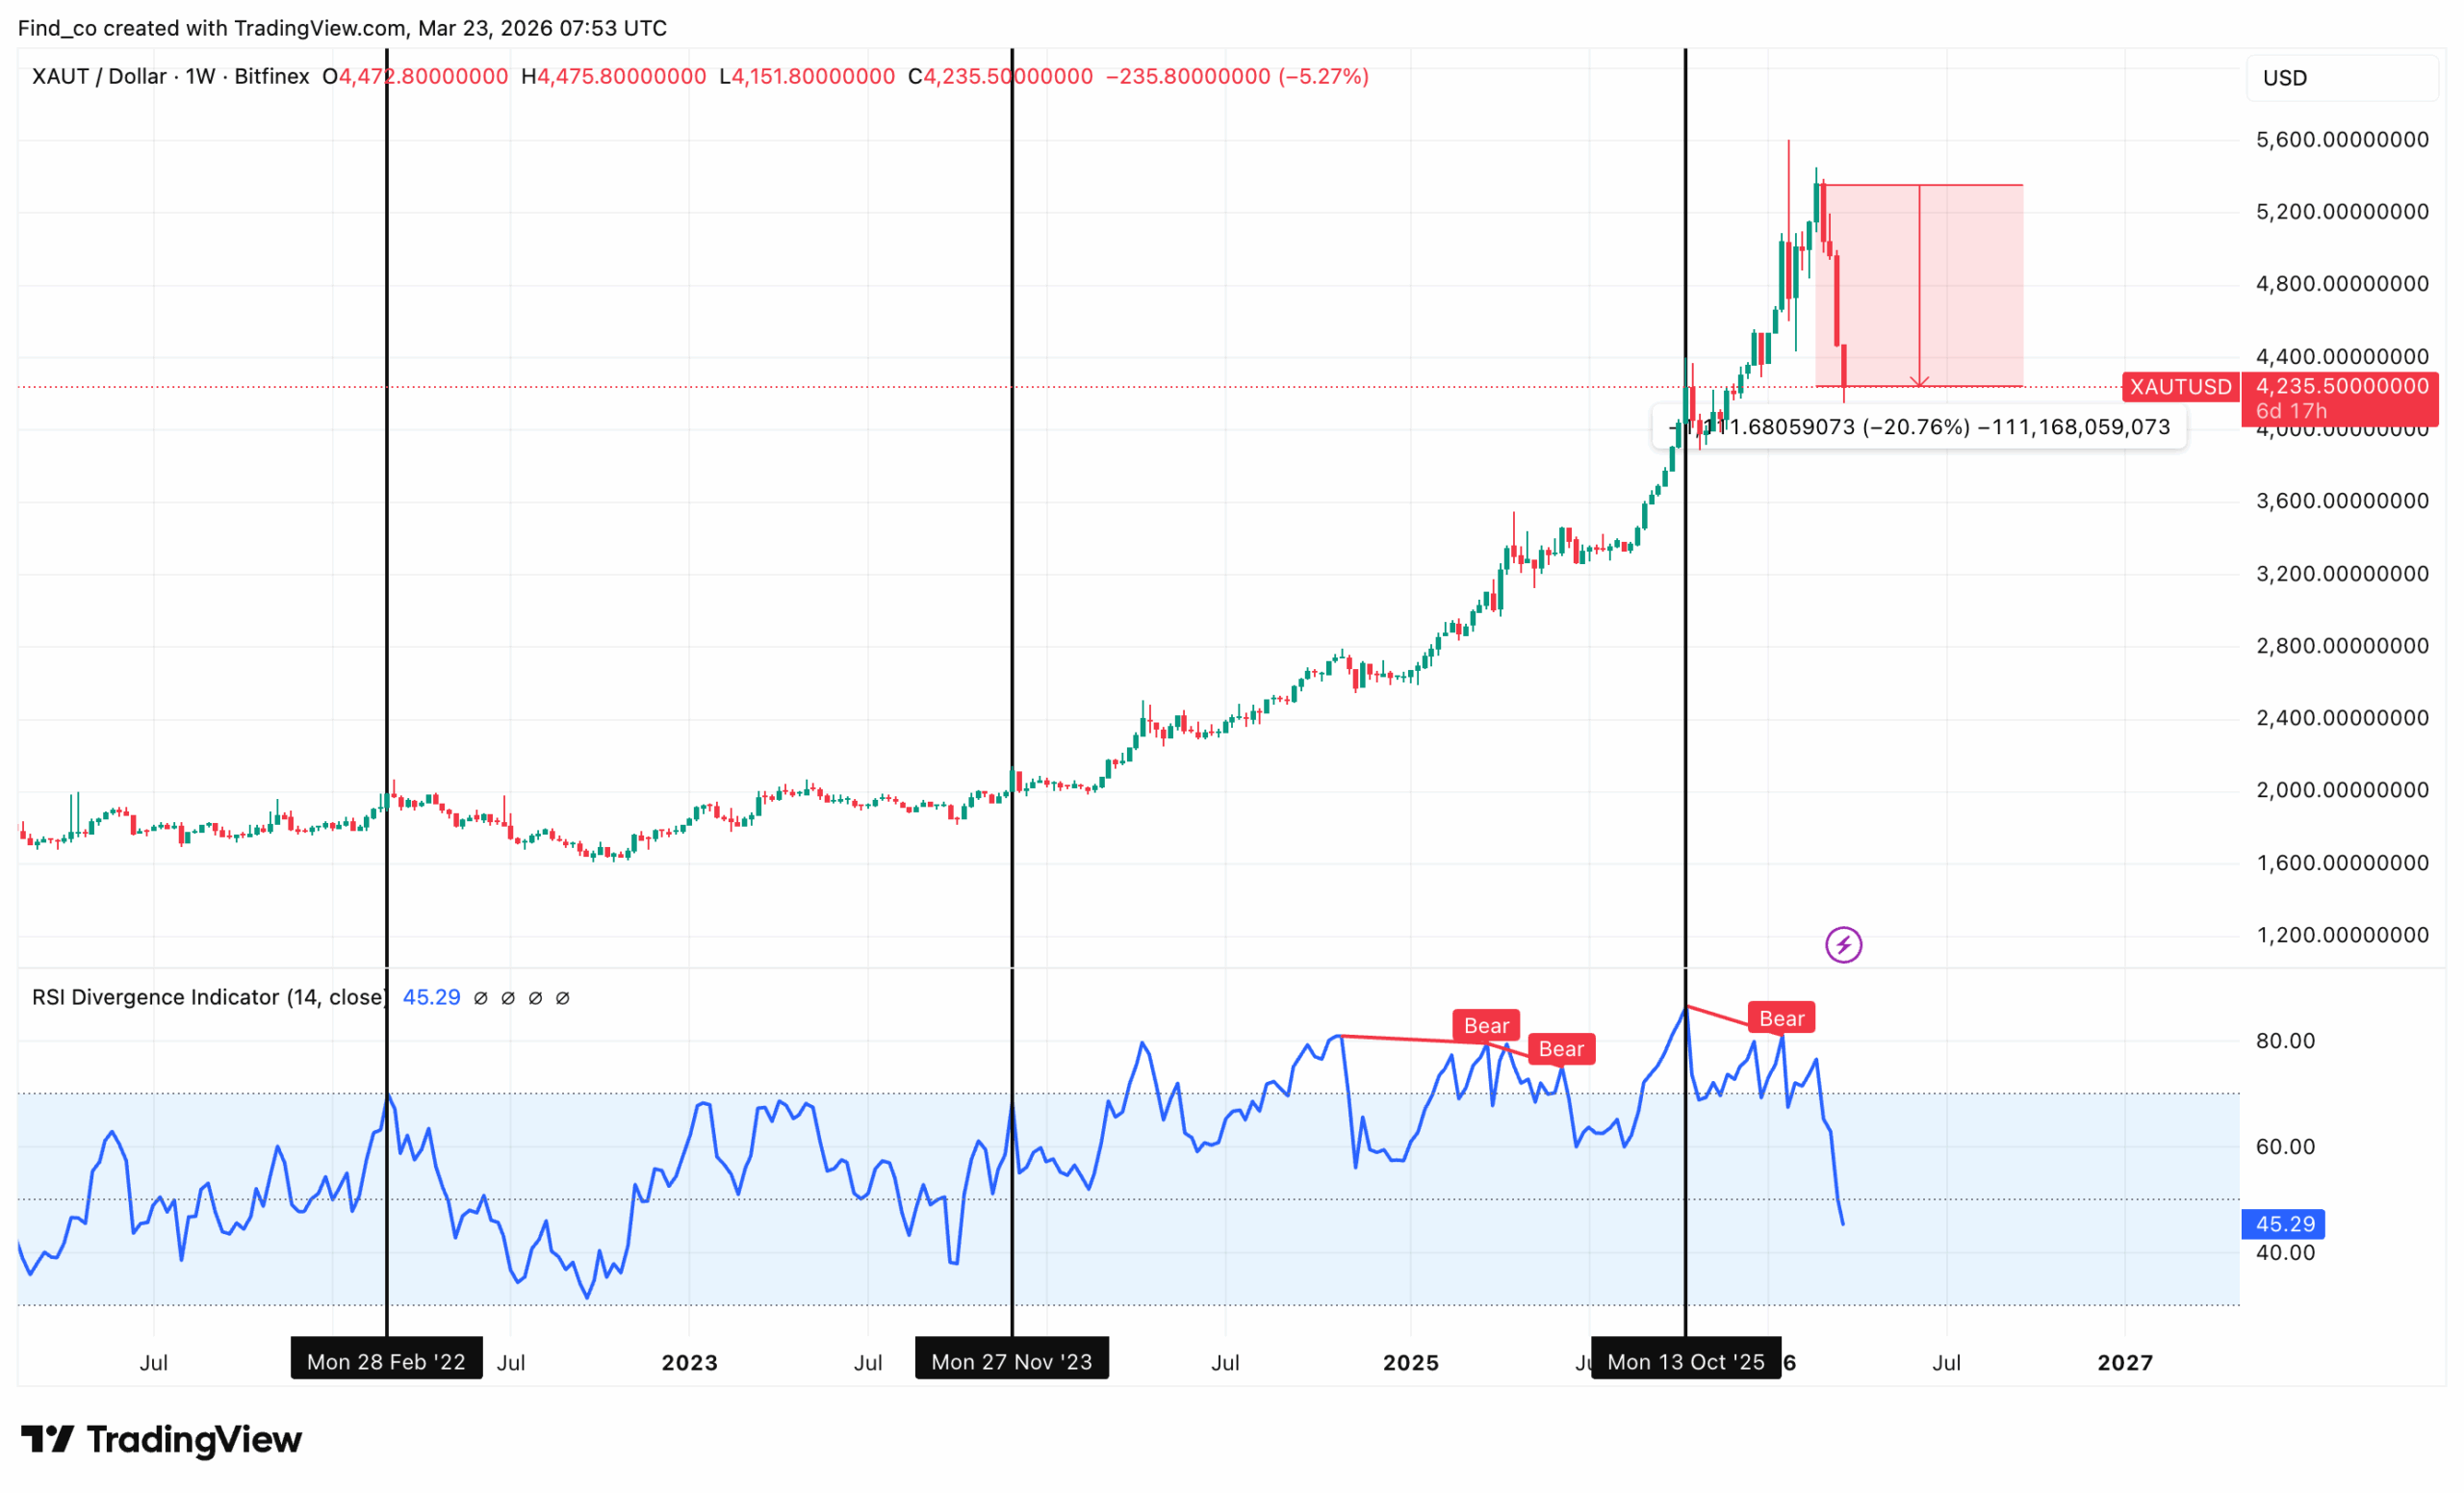
At press time, the XAUT/USD pair has tumbled 5.27% on the weekly chart, sliding to $4,235.
This was after it peaked near $5,500 just weeks ago.
However, while price was making higher highs, the RSI Divergence Indicator was flashing red. It printed two consecutive bearish divergence signals, indicating that the price rose, but momentum weakened.
Now the RSI has collapsed to 45.29, plunging from overbought levels above 80 in just a few weeks.
The projected correction zone, marked in red on the chart, points toward a potential decline into the $4,000 region if selling pressure persists.
Still, context matters. As shown below, the XAUT chart remains in a broadly bullish macro structure.
The long-term uptrend from 2022 remains technically intact. Furthermore, the horizontal dotted support near $4,200 may slow the bleed.
But until the RSI stabilizes and rises above 50, the path of least resistance points lower.
Geopolitical Tension Adds Salt to the Injury
But apart from the technical setup, the ongoing war between Iran, Israel, and the U.S. has also affected gold’s price.
On Saturday night, U.S. President Donald Trump threatened Iran in a Truth Social post, warning that the US would target the nation’s power plants if the Strait of Hormuz remained closed.
“If Iran doesn’t FULLY OPEN, WITHOUT THREAT, the Strait of Hormuz, within 48 HOURS, the United States of America will hit and obliterate their various POWER PLANTS, STARTING WITH THE BIGGEST ONE FIRST!” Trump posted.
Later on, Iran responded. Iran’s military declared it is ready to close the Strait of Hormuz indefinitely if Trump carries out the threat to bomb its power plants.
Furthermore, Iran’s Parliament Speaker Mohammad Bagher Ghalibaf warned that vital infrastructure and energy and oil infrastructure across the entire region will be considered legitimate targets and will be irreversibly destroyed should Iranian power plants be targeted.
“Immediately after the power plants and infrastructure in our country are targeted, the critical infrastructure, energy infrastructure, and oil facilities throughout the region will be considered legitimate targets and will be destroyed in an irreversible manner, and the price of oil will remain high for a long time,” Ghalibaf emphasized.
The scale of what is at stake is staggering. The IEA has characterised the situation as the greatest global energy and food security challenge in history.
Brent crude has surged nearly 50% to $112 a barrel since the start of the war. By Sunday, Brent crude had climbed further to about $114 per barrel as oil prices rose.
Against that backdrop, gold crashing to a three-month low defies every historical precedent. So what is actually happening?
4 Other Reasons Gold Is Falling
As mentioned earlier, increased selling pressure has contributed to the decline in gold prices. But there is more highlighted below:
The first force is the dollar’s counterintuitive strength. The US dollar has rebounded since the Iran war began, halting a months-long slide. For context, a stronger dollar makes gold, which is priced in dollars, relatively more expensive for international investors.
The second force is the interest rate implications of energy-driven inflation. Rising oil prices could lead to prolonged inflation and potentially higher interest rates as central banks struggle to contain the fallout from a closure of the Strait of Hormuz. Furthermore, the Federal Reserve’s decision to hold rates unchanged at 3.5% to 3.75%, citing elevated uncertainty from the war, reinforces the expectation that rate cuts are not imminent. Gold performs best in falling-rate environments. The current environment is precisely the opposite.
The third force is the paper market flush. Gold initially spiked from $5,296 to $5,423 on the Hormuz news, then reversed hard. This dynamic, where leveraged futures and ETF traders are squeezed by dollar strength and margin requirements, produces forced selling that overwhelms the physical market’s genuine safe haven demand. So, the gold price displayed on screens reflects paper market mechanics, not the physical demand that tells a different story.
The fourth force is the unwinding of an overextended pre-war rally. Gold gained 64% in 2025, its best year since 1979, and hit $5,000 an ounce for the first time in January. That extraordinary run attracted momentum traders, systematic hedge funds, and retail participants who were not committed, long-term gold holders. That money is not wedded to long-term gold positioning—and when the crisis produced unexpected headwinds rather than the straightforward safe-haven rally those participants expected, the exit was swift and disorderly.
Gold Price Outlook
In the short term, the daily chart offers more insight into how gold’s price might perform, as shown in the XAUT/USD chart again.
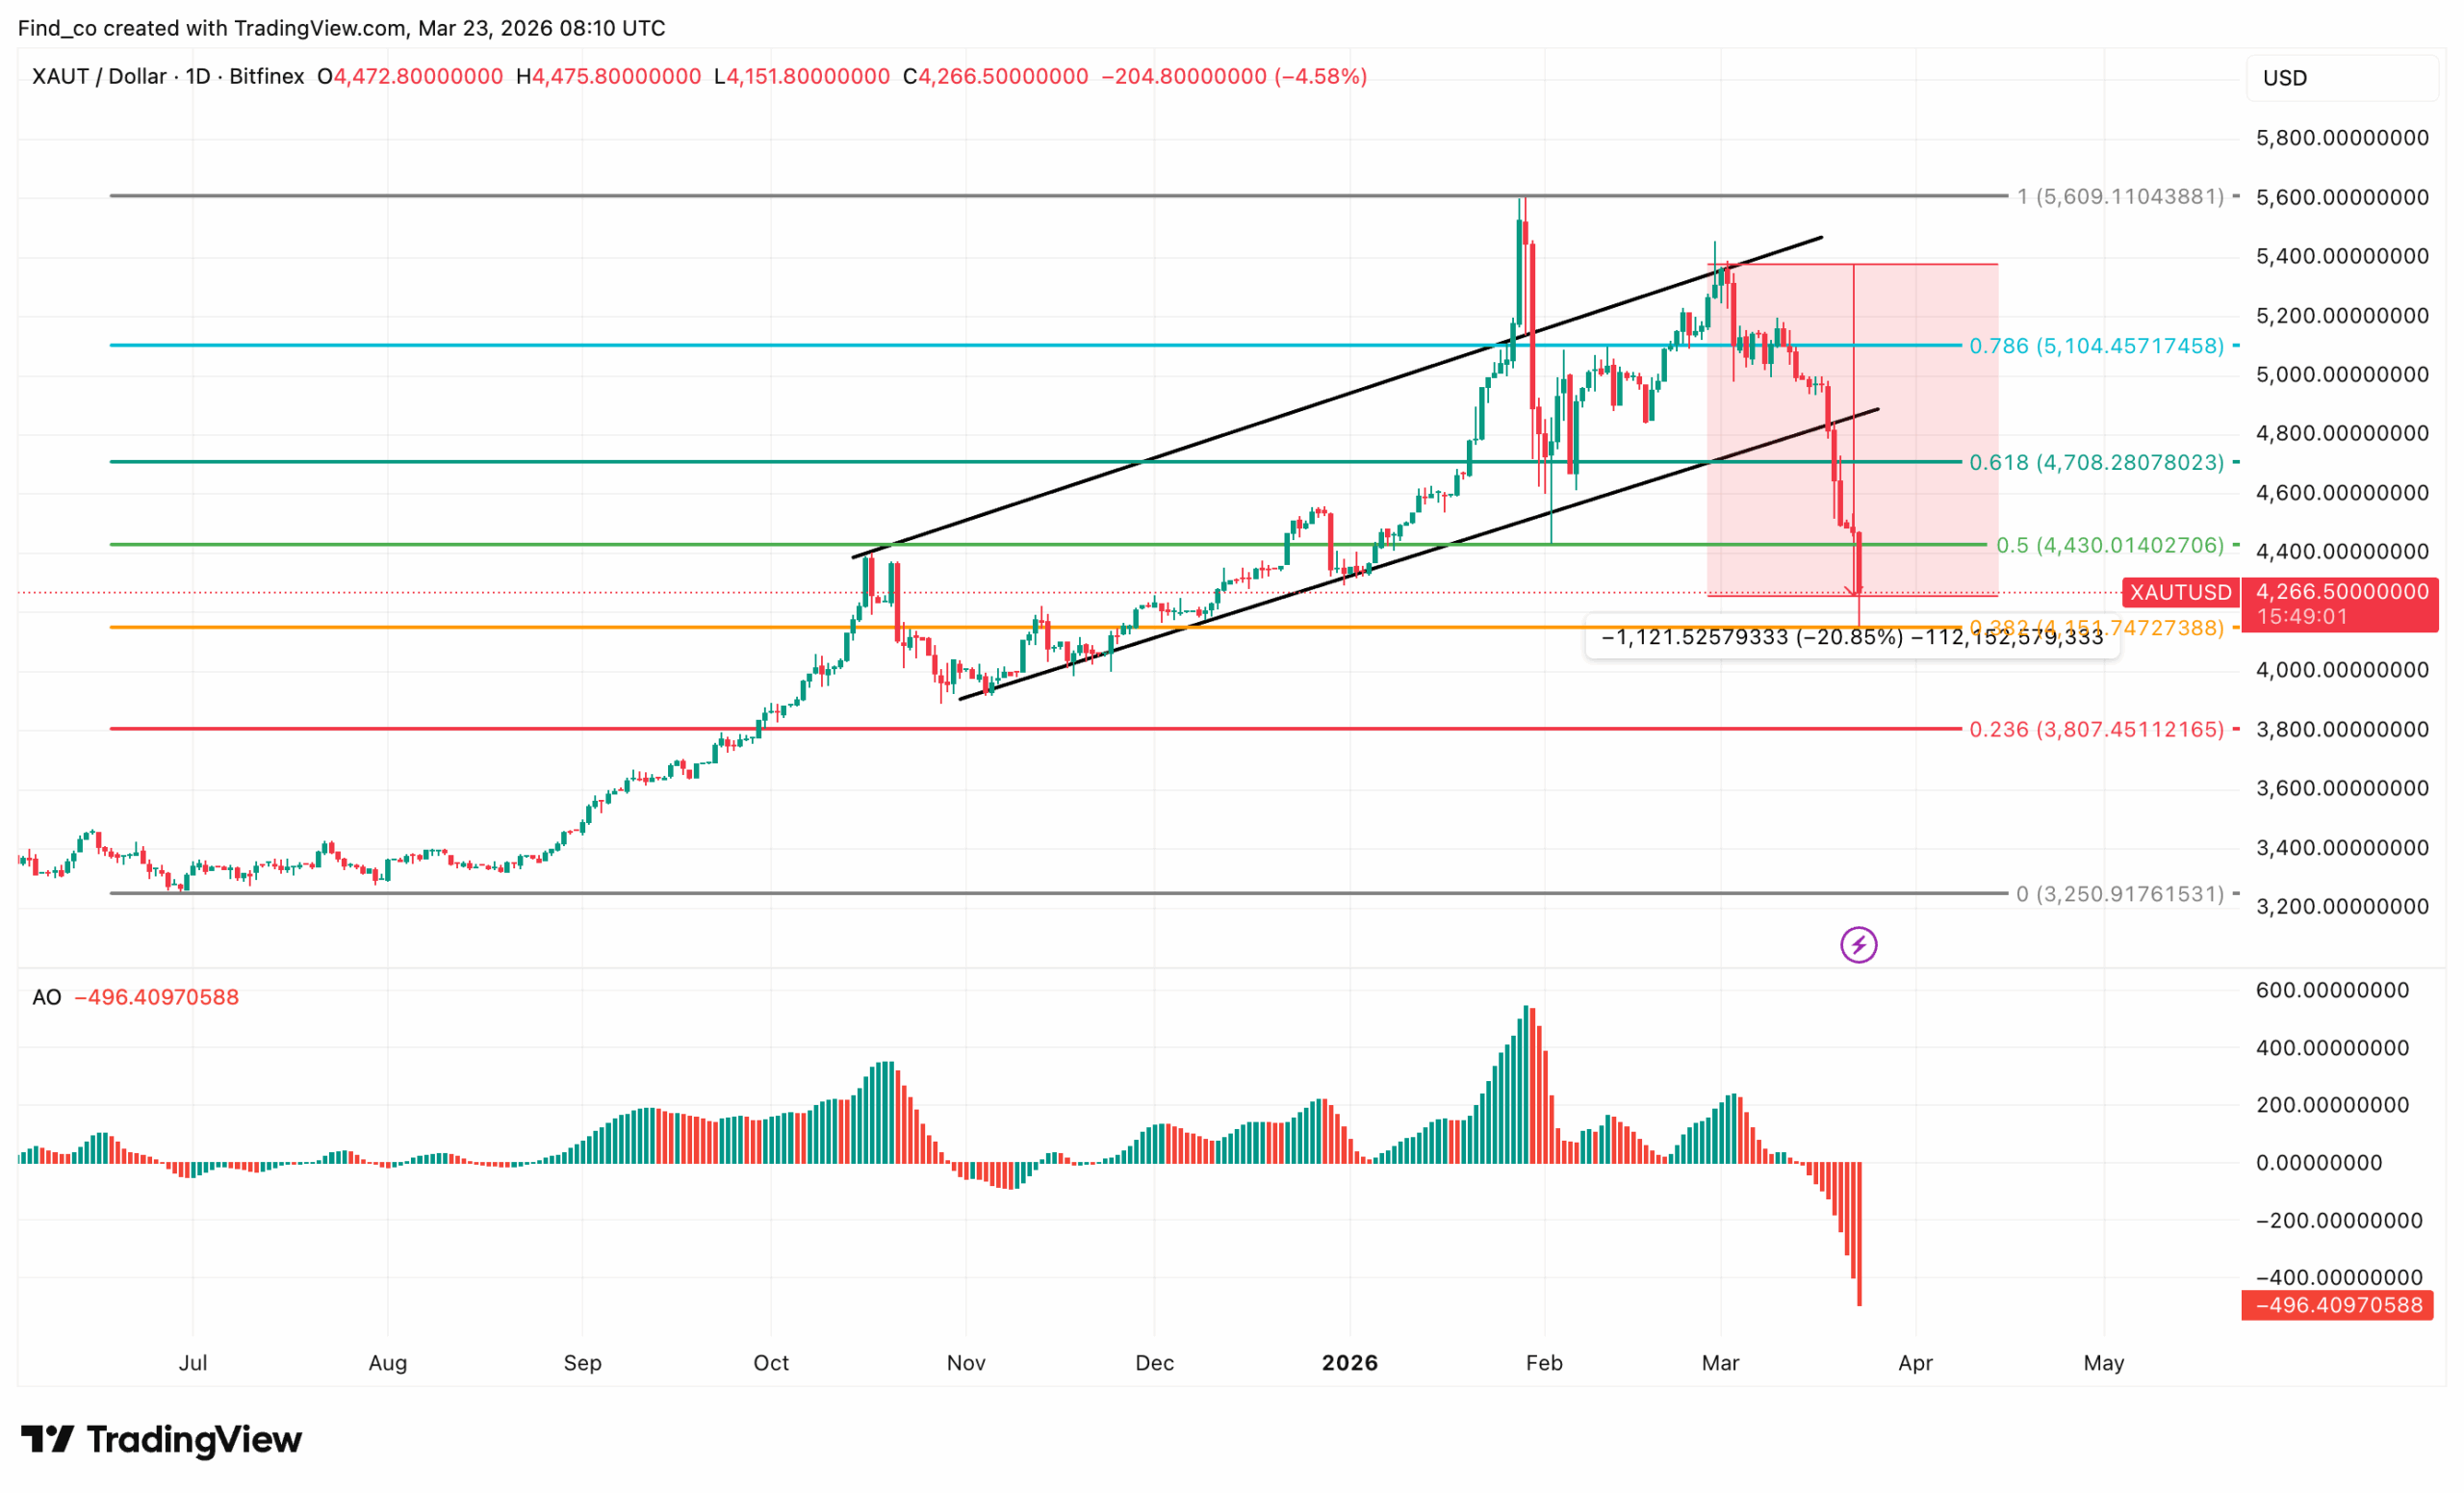
From the chart below, the structure has cracked. Gold’s price has shed 4.58% on the daily chart, while closing at $4,266.
After months of respecting a rising channel, the price has sliced below its lower trendline.
The channel had been a reliable guide since July 2025. During that period, the price repeatedly bounced off the lower boundary, rewarding patient bulls each time.
But the February peak near $5,609 marked the end of that story. Sellers overwhelmed buyers, and the channel gave way. A 20.85% drawdown is now on record.
The Fibonacci retracement levels now take centre stage. In addition, gold’s price has already broken below the 0.618 level at $4,708 and the 0.5 level at $4,430.
Both of these were former supporters who flipped to resistance. Currently, XAUT hovers just above the 0.382 level at $4,247, which represents the next critical battleground. Losing that level opens the door toward the 0.236 level at $3,807.
Meanwhile, Awesome Oscillator (AO) delivers an unambiguous verdict. At -496.41, it is printing its most negative reading in a long time.
This indicates that bears are firmly in control for now. Nevertheless, a relief bounce near $4,247 is plausible given how stretched the move has become.
Until the AO turns positive and price reclaims $4,430, any rally should be treated as a retracement within a downtrend.
Analysts Remain Bullish on Gold
Despite the extraordinary short-term pain, the institutional long-term thesis for gold remains firmly intact.
For instance, JP Morgan predicts prices will reach $6,300 per ounce by the end of 2026.
On the other hand, Deutsche Bank is standing by a $6,000 year-end target. Those targets reflect the view that the current paper market is flush and that the dollar-driven headwind is strong.
Besides, Economist Peter Schiff has opined that the decline in gold’s price is nothing to worry about.
According to him, gold does not need a falling interest rate to recover, even if it could gain from it.
“Selling gold because rising inflation will keep the Fed from cutting interest rates, when rates are already too low, makes no sense. Falling real rates are bullish for gold. It’s the stock market that needs rate cuts. That’s why it makes no sense that stocks are down so little,” Schiff said.
Disclaimer:
The information provided in this article is for informational purposes only. It is not intended to be, nor should it be construed as, financial advice. We do not make any warranties regarding the completeness, reliability, or accuracy of this information. All investments involve risk, and past performance does not guarantee future results. We recommend consulting a financial advisor before making any investment decisions.
Victor Olanrewaju is a crypto analyst and reporter at CCN with deep roots in on-chain research and technical analysis. His crypto journey began in 2017, but it was the 2020 Uniswap airdrop that sparked a full-time pivot into the space.
With a foundation in copywriting, Victor honed his craft creating high-converting content for leading crypto brokers — most notably an XRP price prediction that ranked #1 on Google during the 2021 bull run.
He later joined AMBCrypto in 2022, where he combined storytelling with technical and on-chain analysis to cover key market narratives.
In 2024, he expanded his expertise at BeInCrypto, collaborating with analysts and using tools like Glassnode, Santiment, and IntoTheBlock to break down Bitcoin and altcoin trends.
At CCN, Victor covers the top cryptocurrencies, memecoins, macro shifts, blending real-time insights with deep-dive metrics.
He holds a Bachelor’s degree in Physics from the University of Ibadan, equipping him to simplify complex data for a wide audience. Follow his work or connect on LinkedIn or X.