ETH is down over 10% with rising sell-side pressure hinting at further declines.
Institutional conviction is waning, with falling CMF and BBP readings reinforcing the bearish case.
ETH’s NUPL has entered capitulation territory — a zone that has historically preceded market bottoms and bullish reversals.
Leading altcoin Ethereum is down by double digits over the past seven days, with bearish signals pointing to further declines.
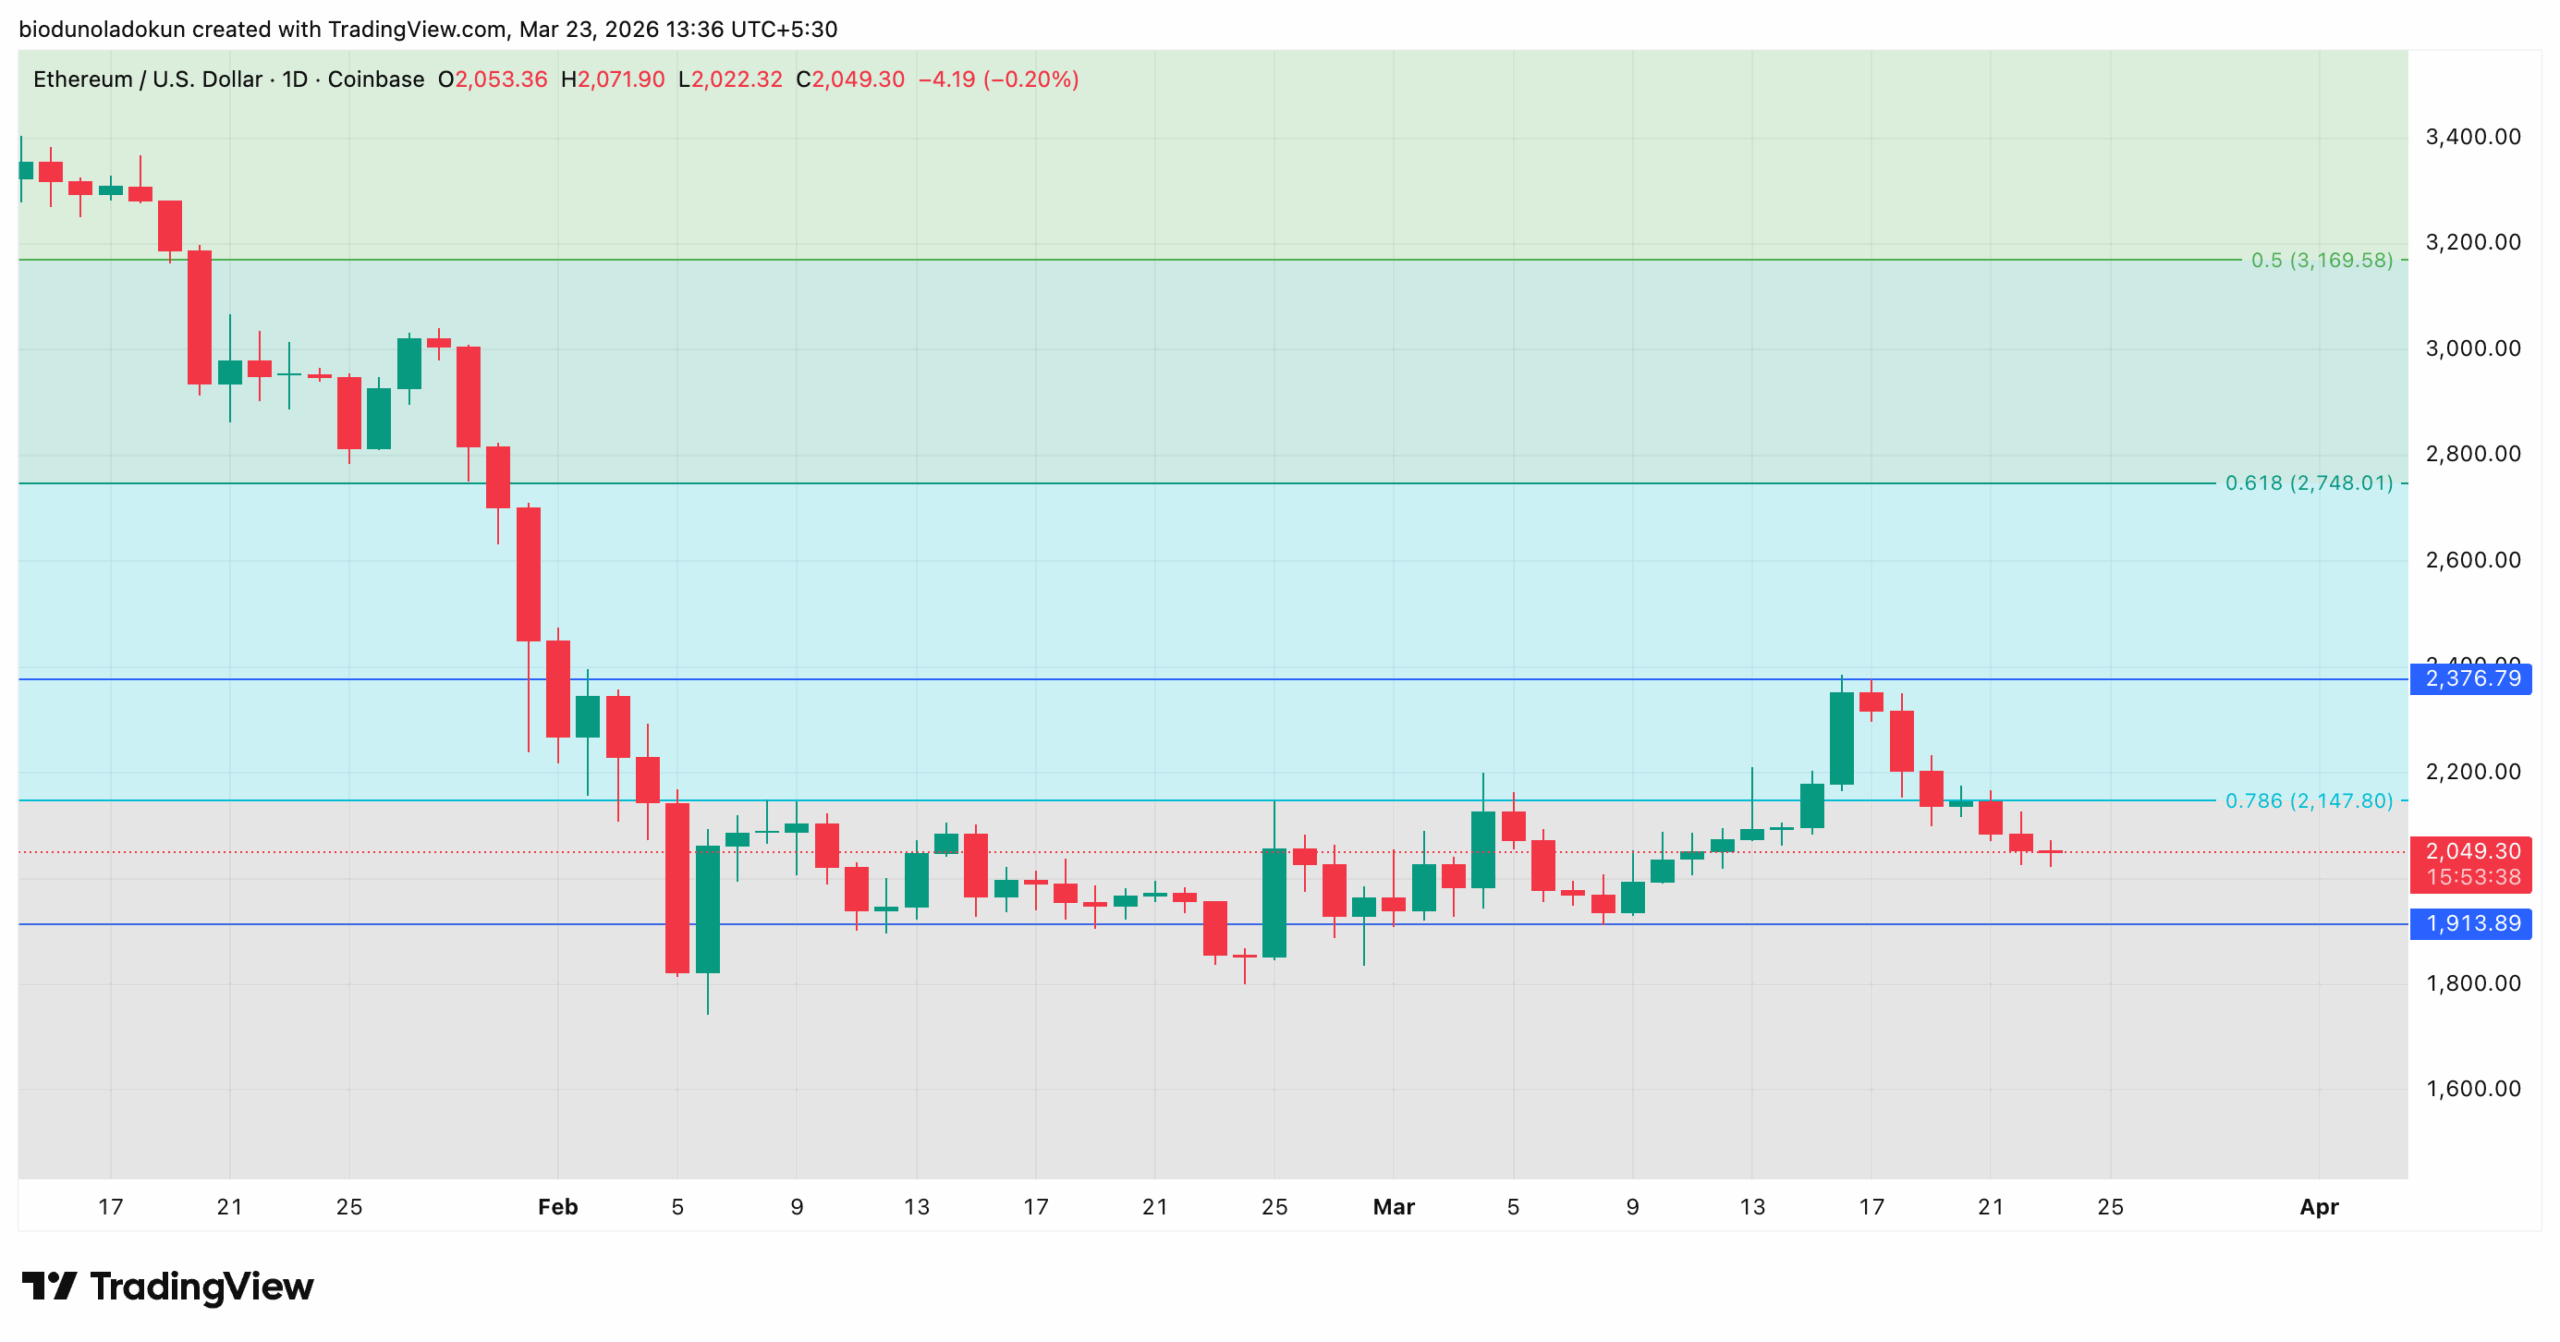
Since hitting an intraday high of $2,386 on March 16, ETH’s price has trended lower, as sentiment among key market participants continues to deteriorate.
At press time, the leading altcoin is down 2% on the day, while its trading volume has surged nearly 20% in the same window, reflecting the weak buying activity.
Institutional Investors Pull Back
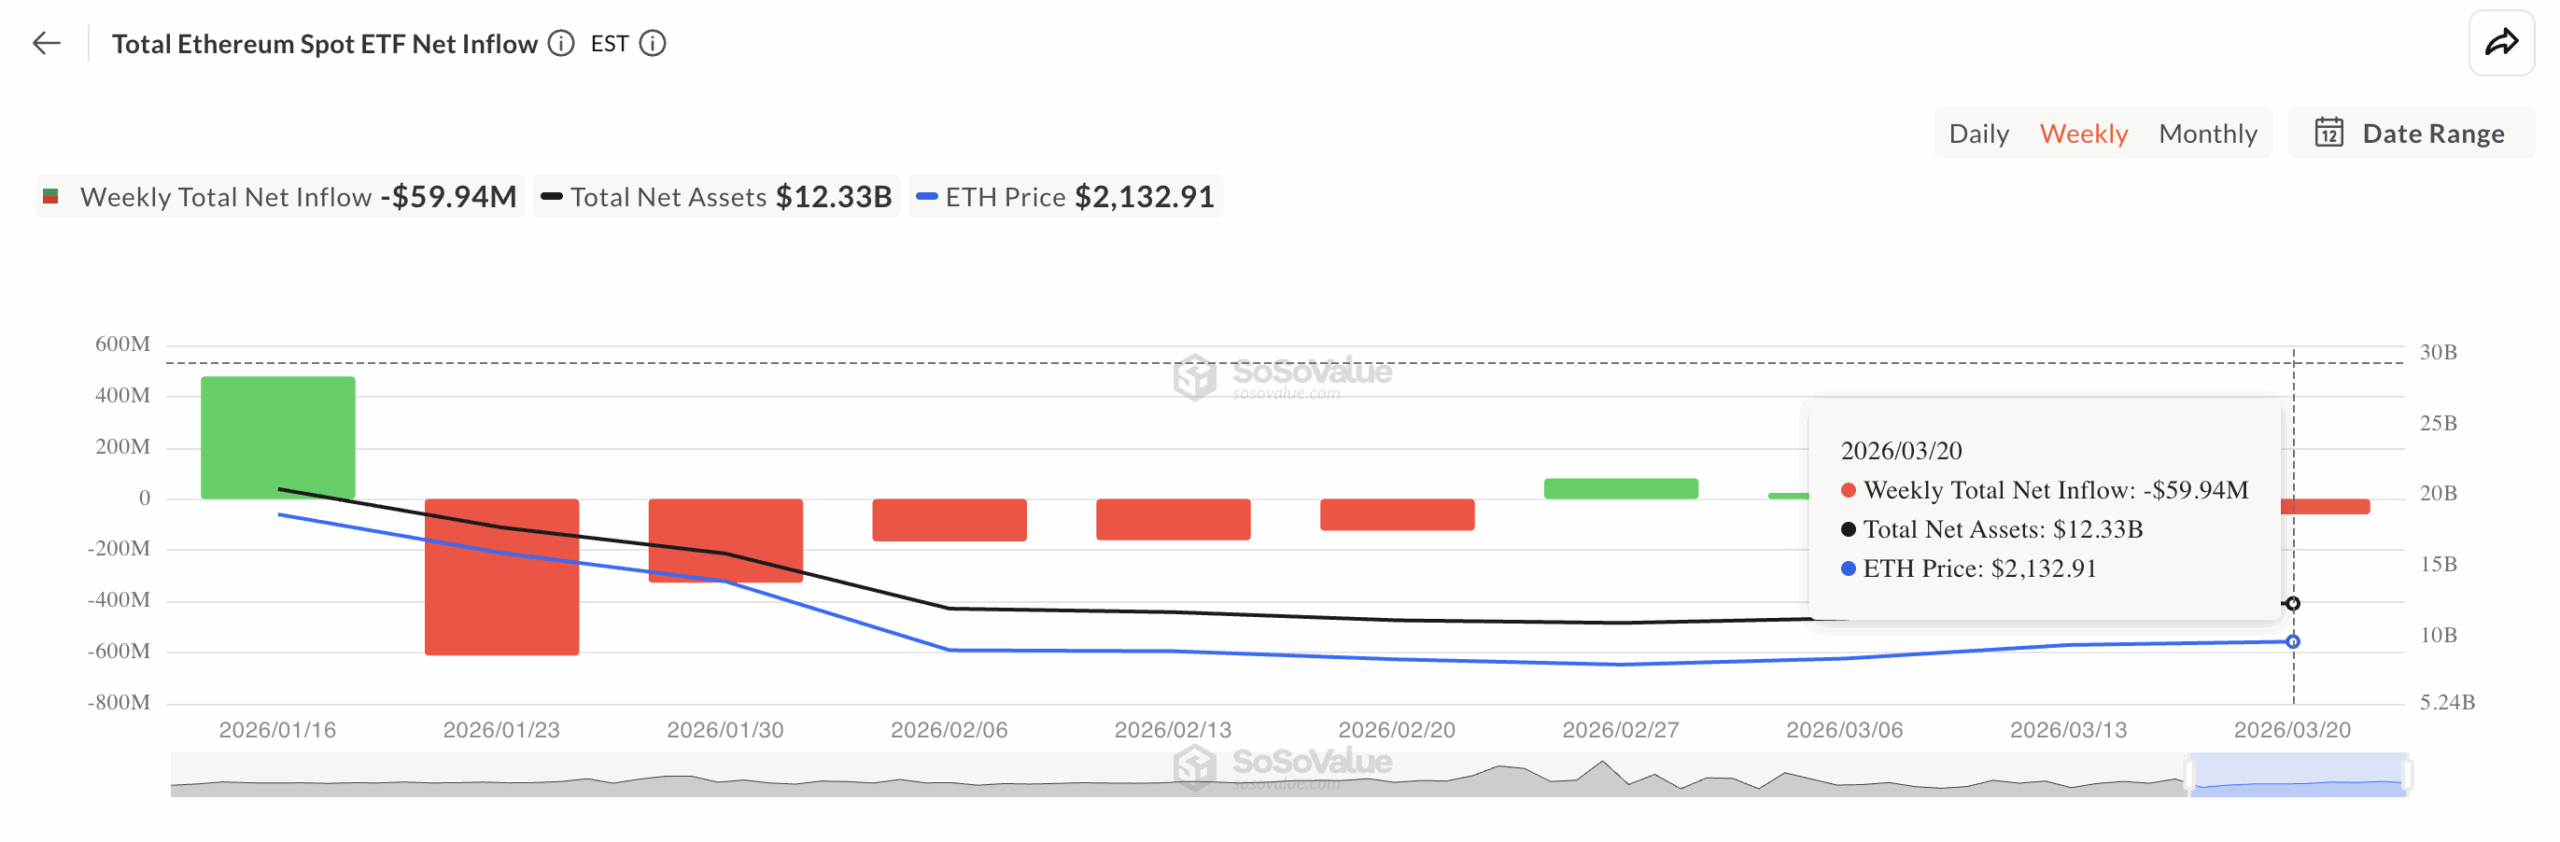
Spot Ethereum ETF holders spent the entire last week withdrawing capital from the funds, signaling that institutional appetite for ETH exposure remains subdued.
According to SoSoValue data, between March 16 and March 20, these funds recorded a net outflow of $60 million.
Total Ethereum Spot ETF Net Inflow | Credit: SoSoValue
The sustained withdrawal is a critical indicator of where sentiment lies among these investors.
ETF outflows reflect a deliberate pullback by institutional investors who are either putting capital elsewhere or hedging against further downside.
Unlike retail traders who often react impulsively to short-term price moves, institutional ETF participants operate with more conviction.
So when they exit like this, it signals caution regarding the asset’s near-term outlook.
Key Momentum Indicators Flash Red
Moreover, readings from ETH’s one-day chart reflect the decline in spot market participation.
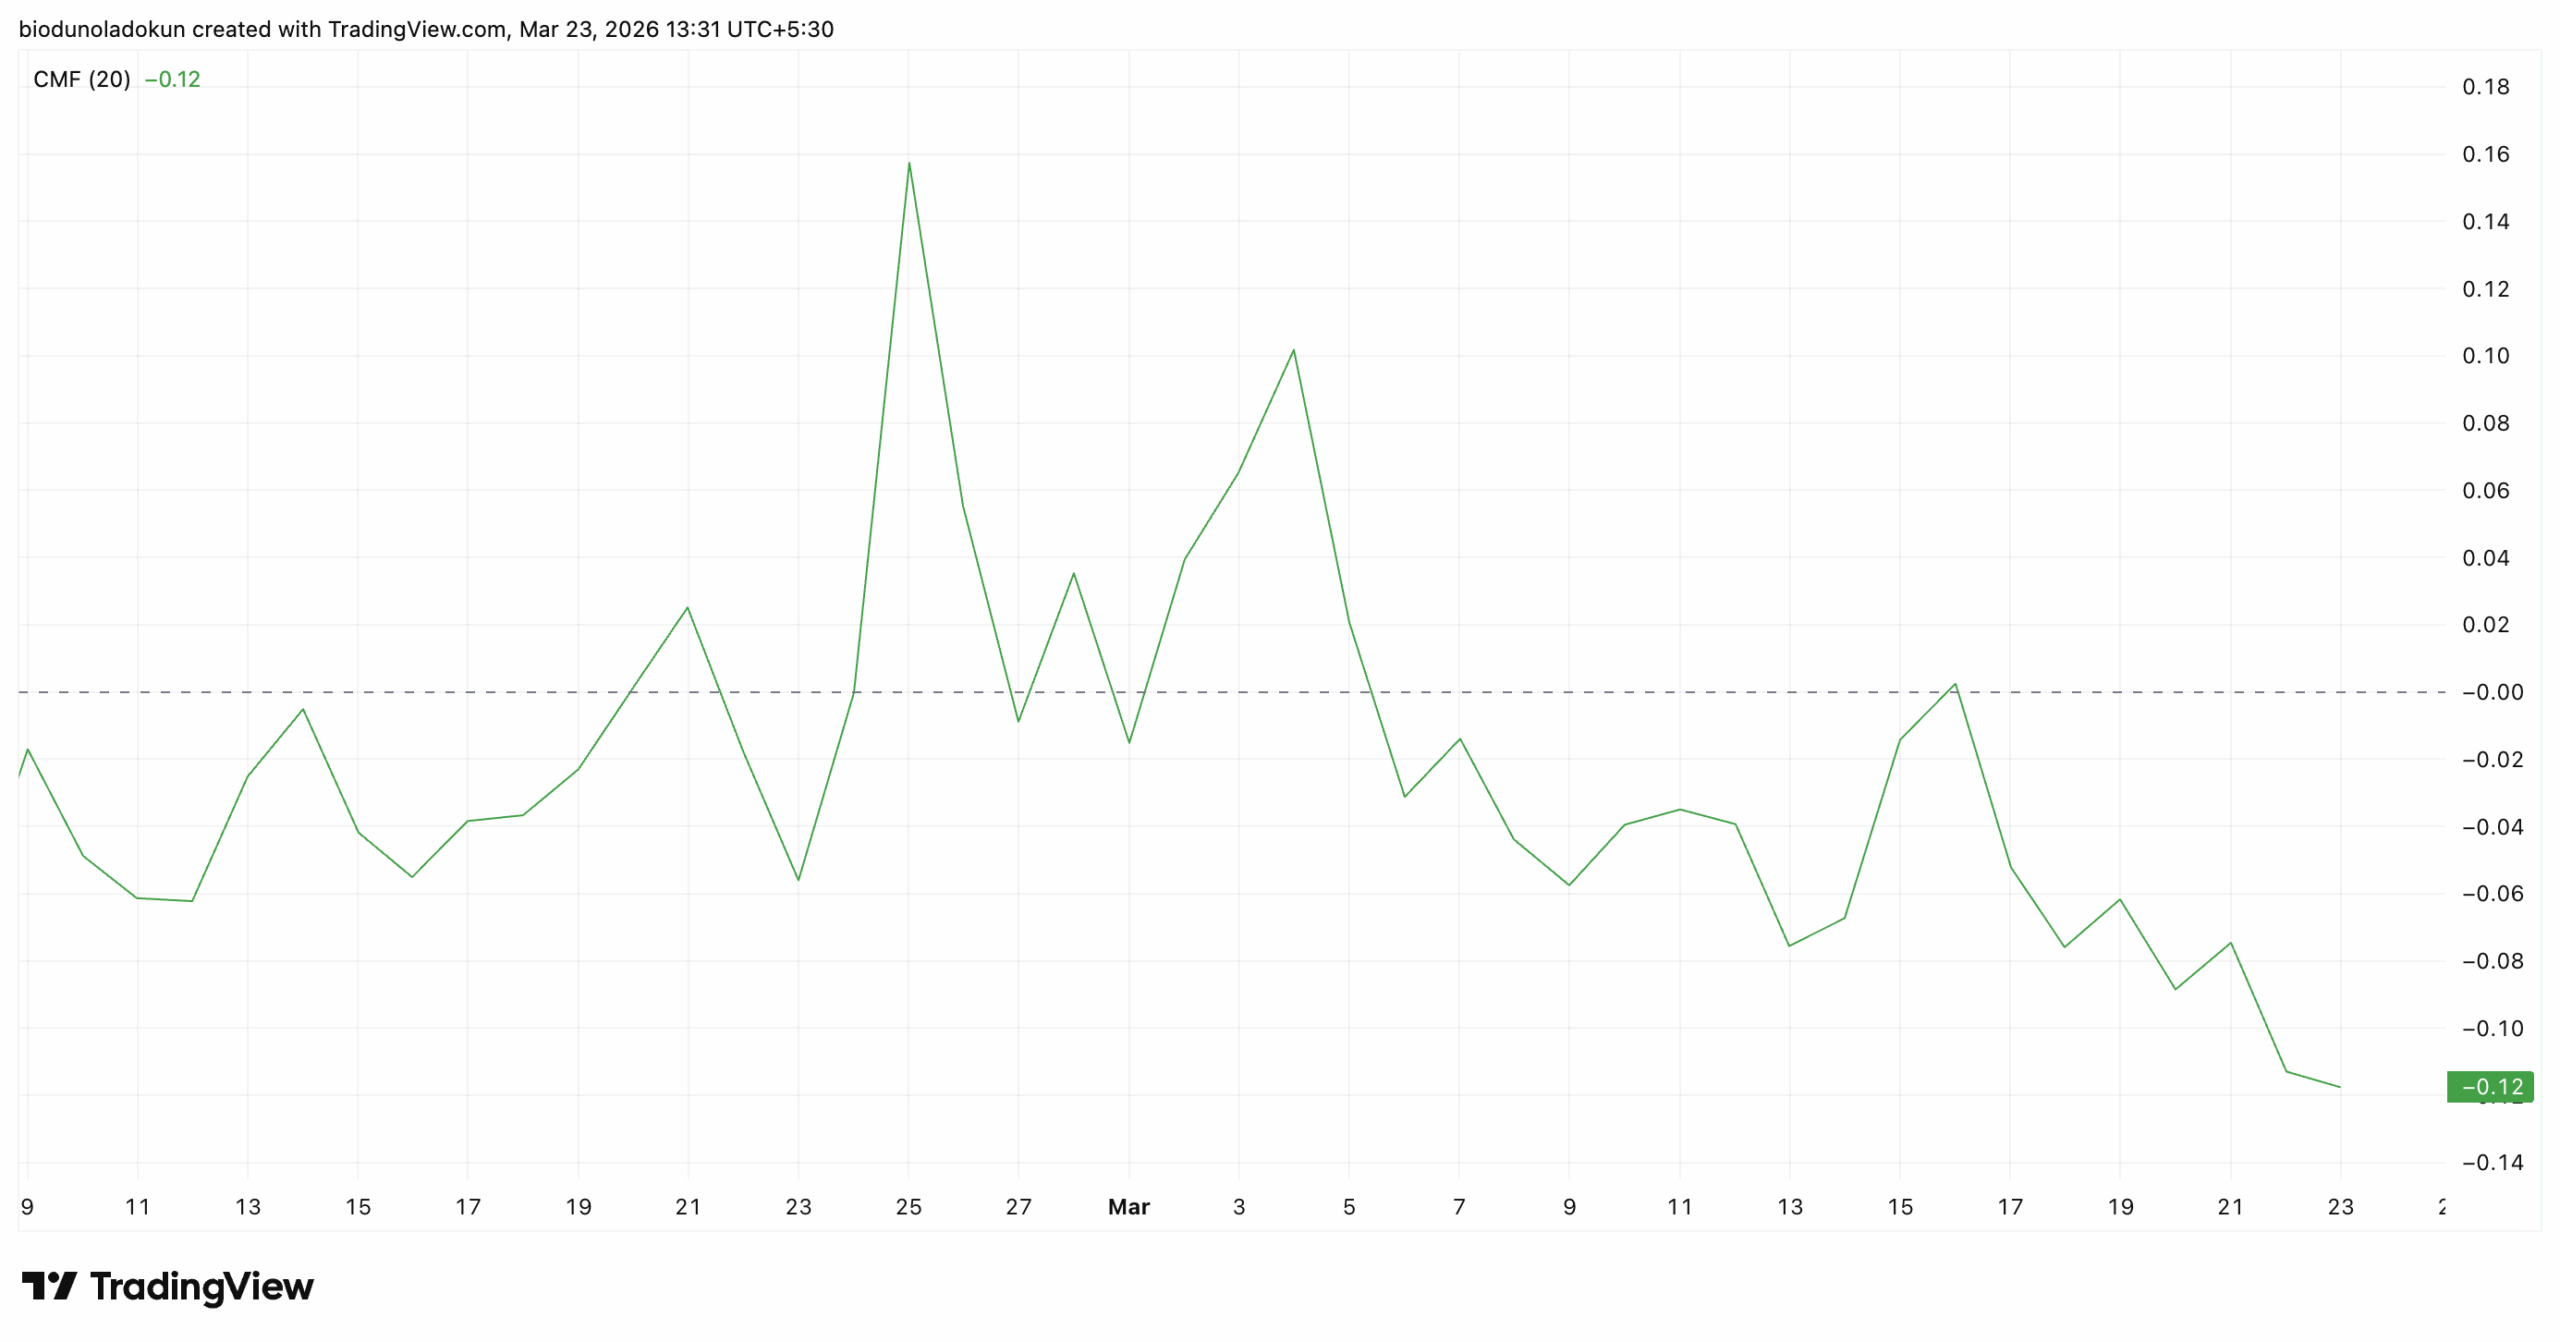
ETH’s price drop over the past week has been accompanied by a falling Chaikin Money Flow (CMF) indicator, which has now crossed below the zero line.
At press time, this key momentum indicator — which measures the flow of capital into and out of an asset — sits at -0.12 and continues to trend lower.
A negative CMF reading like this generally means that sellers are in control of the market and buyers lack the conviction to absorb the supply.
When it is negative during a period of price decline, it confirms that selling pressure is dominant. This adds to ETH’s downside risk.
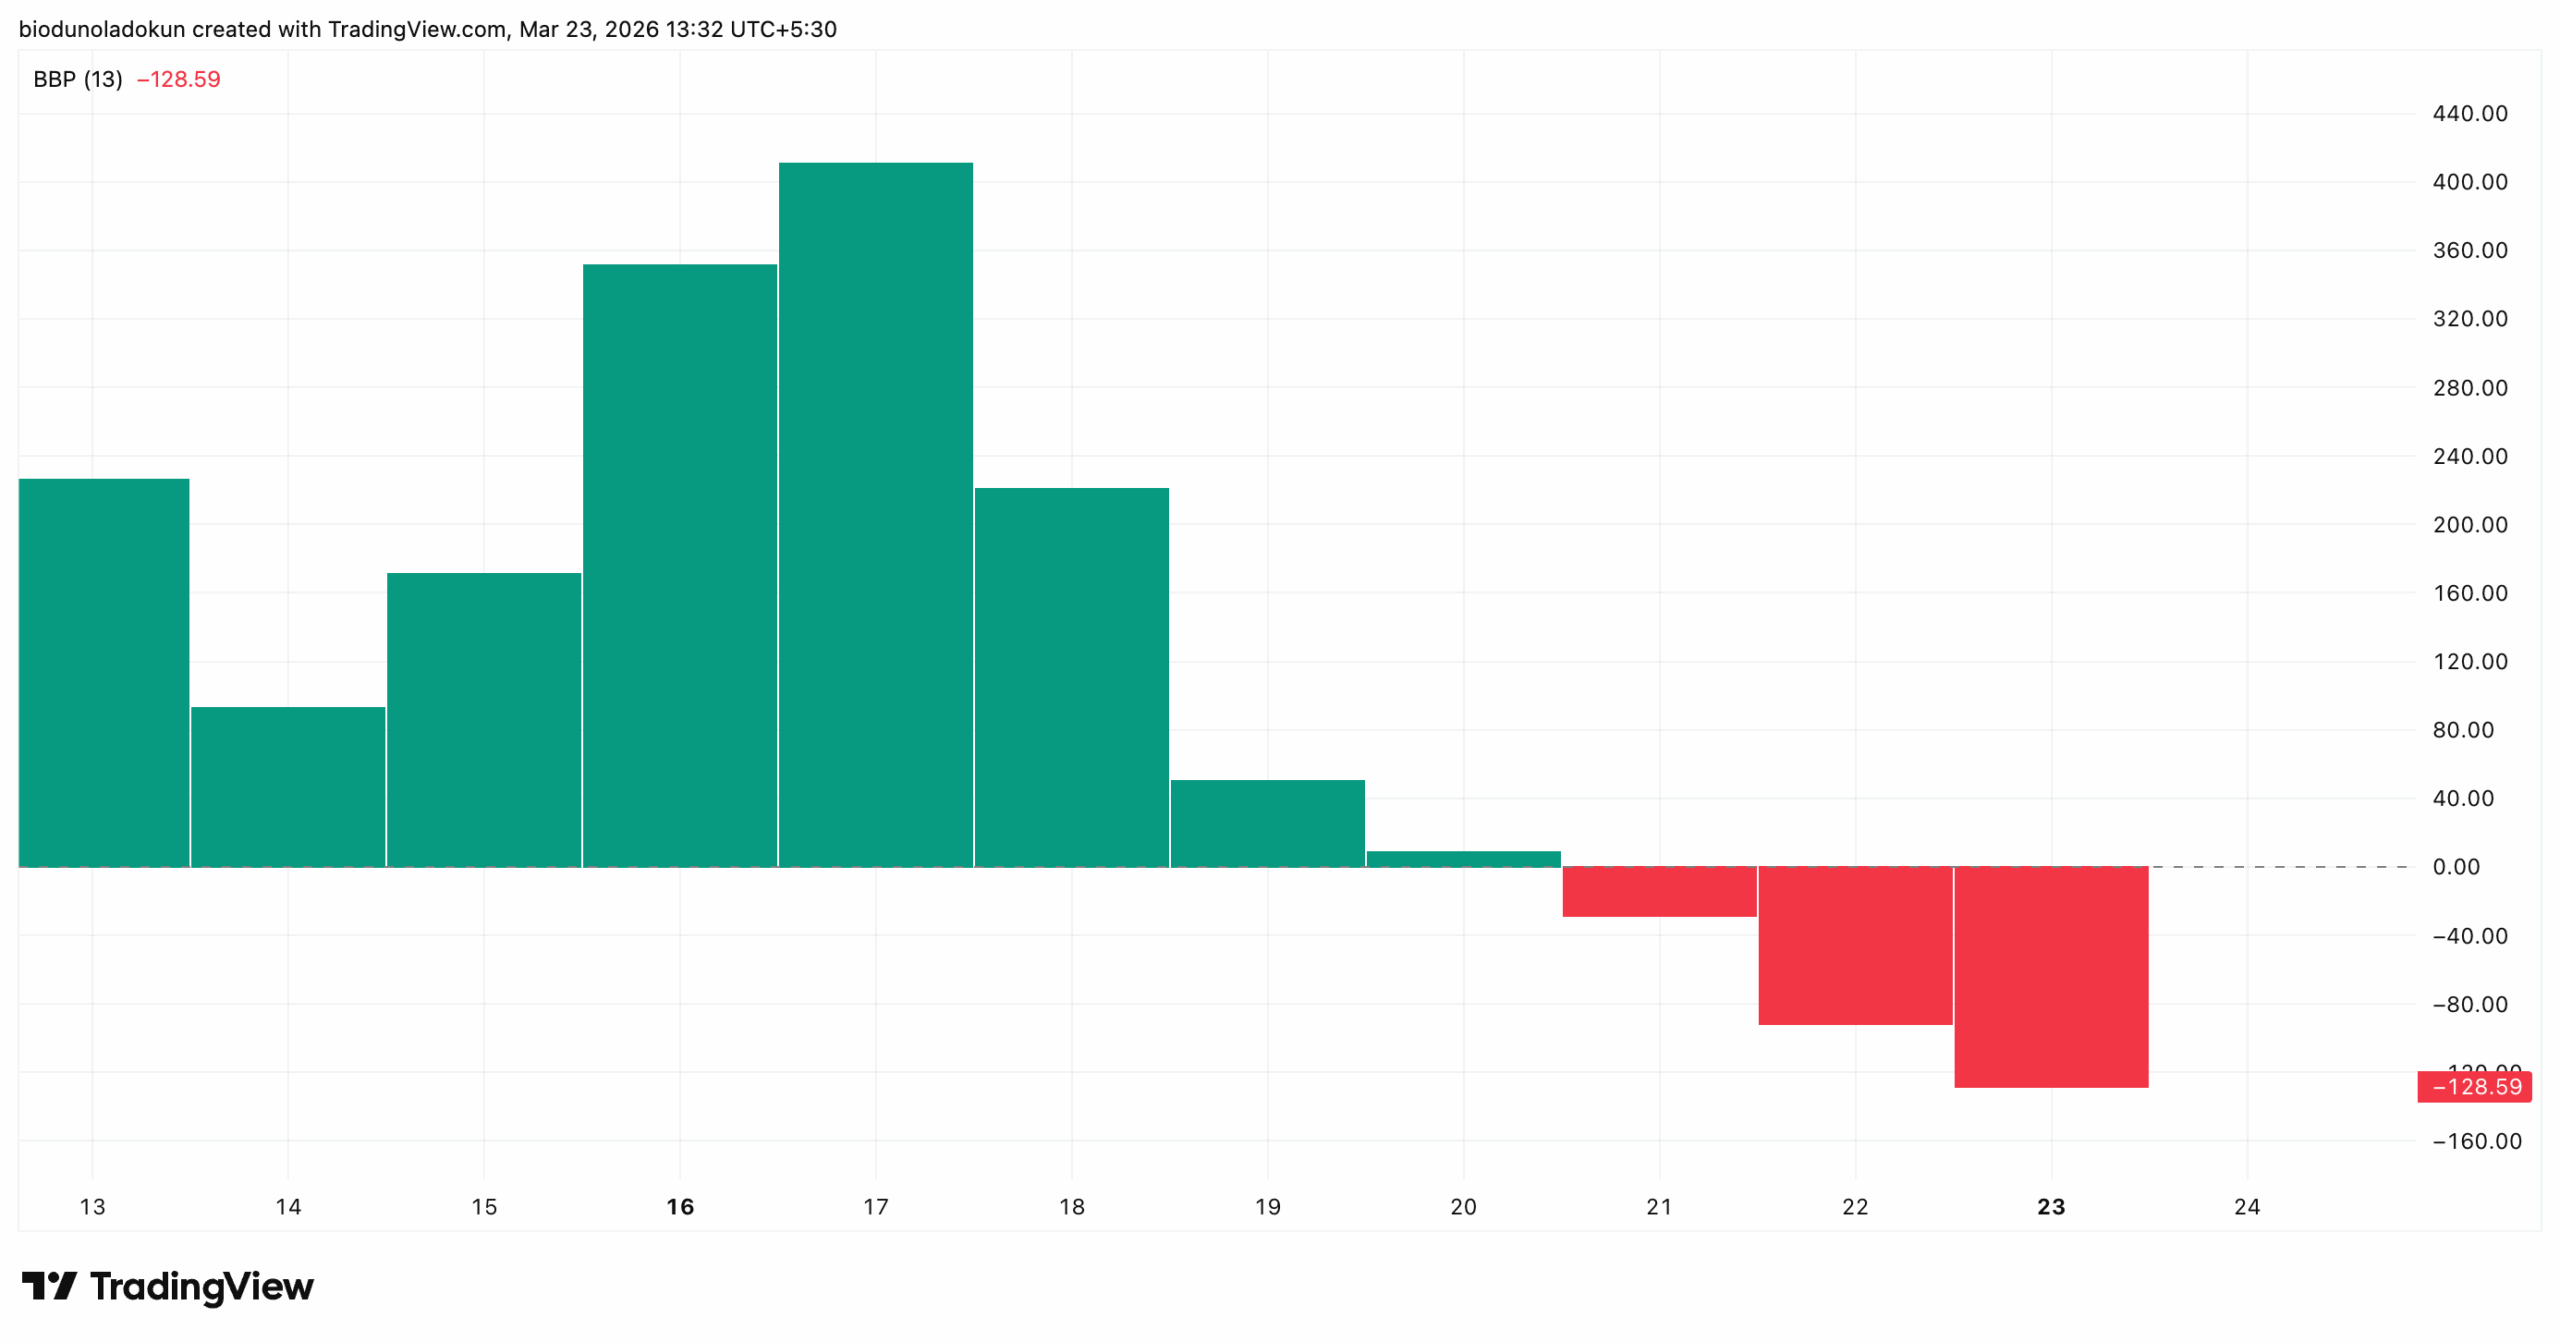
Moreover, readings from ETH’s Bull Bear Power (BBP) support this outlook. The BBP indicator measures the balance of power between buyers and sellers, with positive values indicating the bulls are in control and negative values indicating the bears have the upper hand.
At press time, ETH’s BBP sits at -128.59. Also, its red bars have grown in size over the past three sessions, suggesting bearish pressure is intensifying.
While spot market participants are experiencing significant sell-offs, a key on-chain metric suggests a price bottom may be near, potentially triggering an upward reversal in ETH’s price.
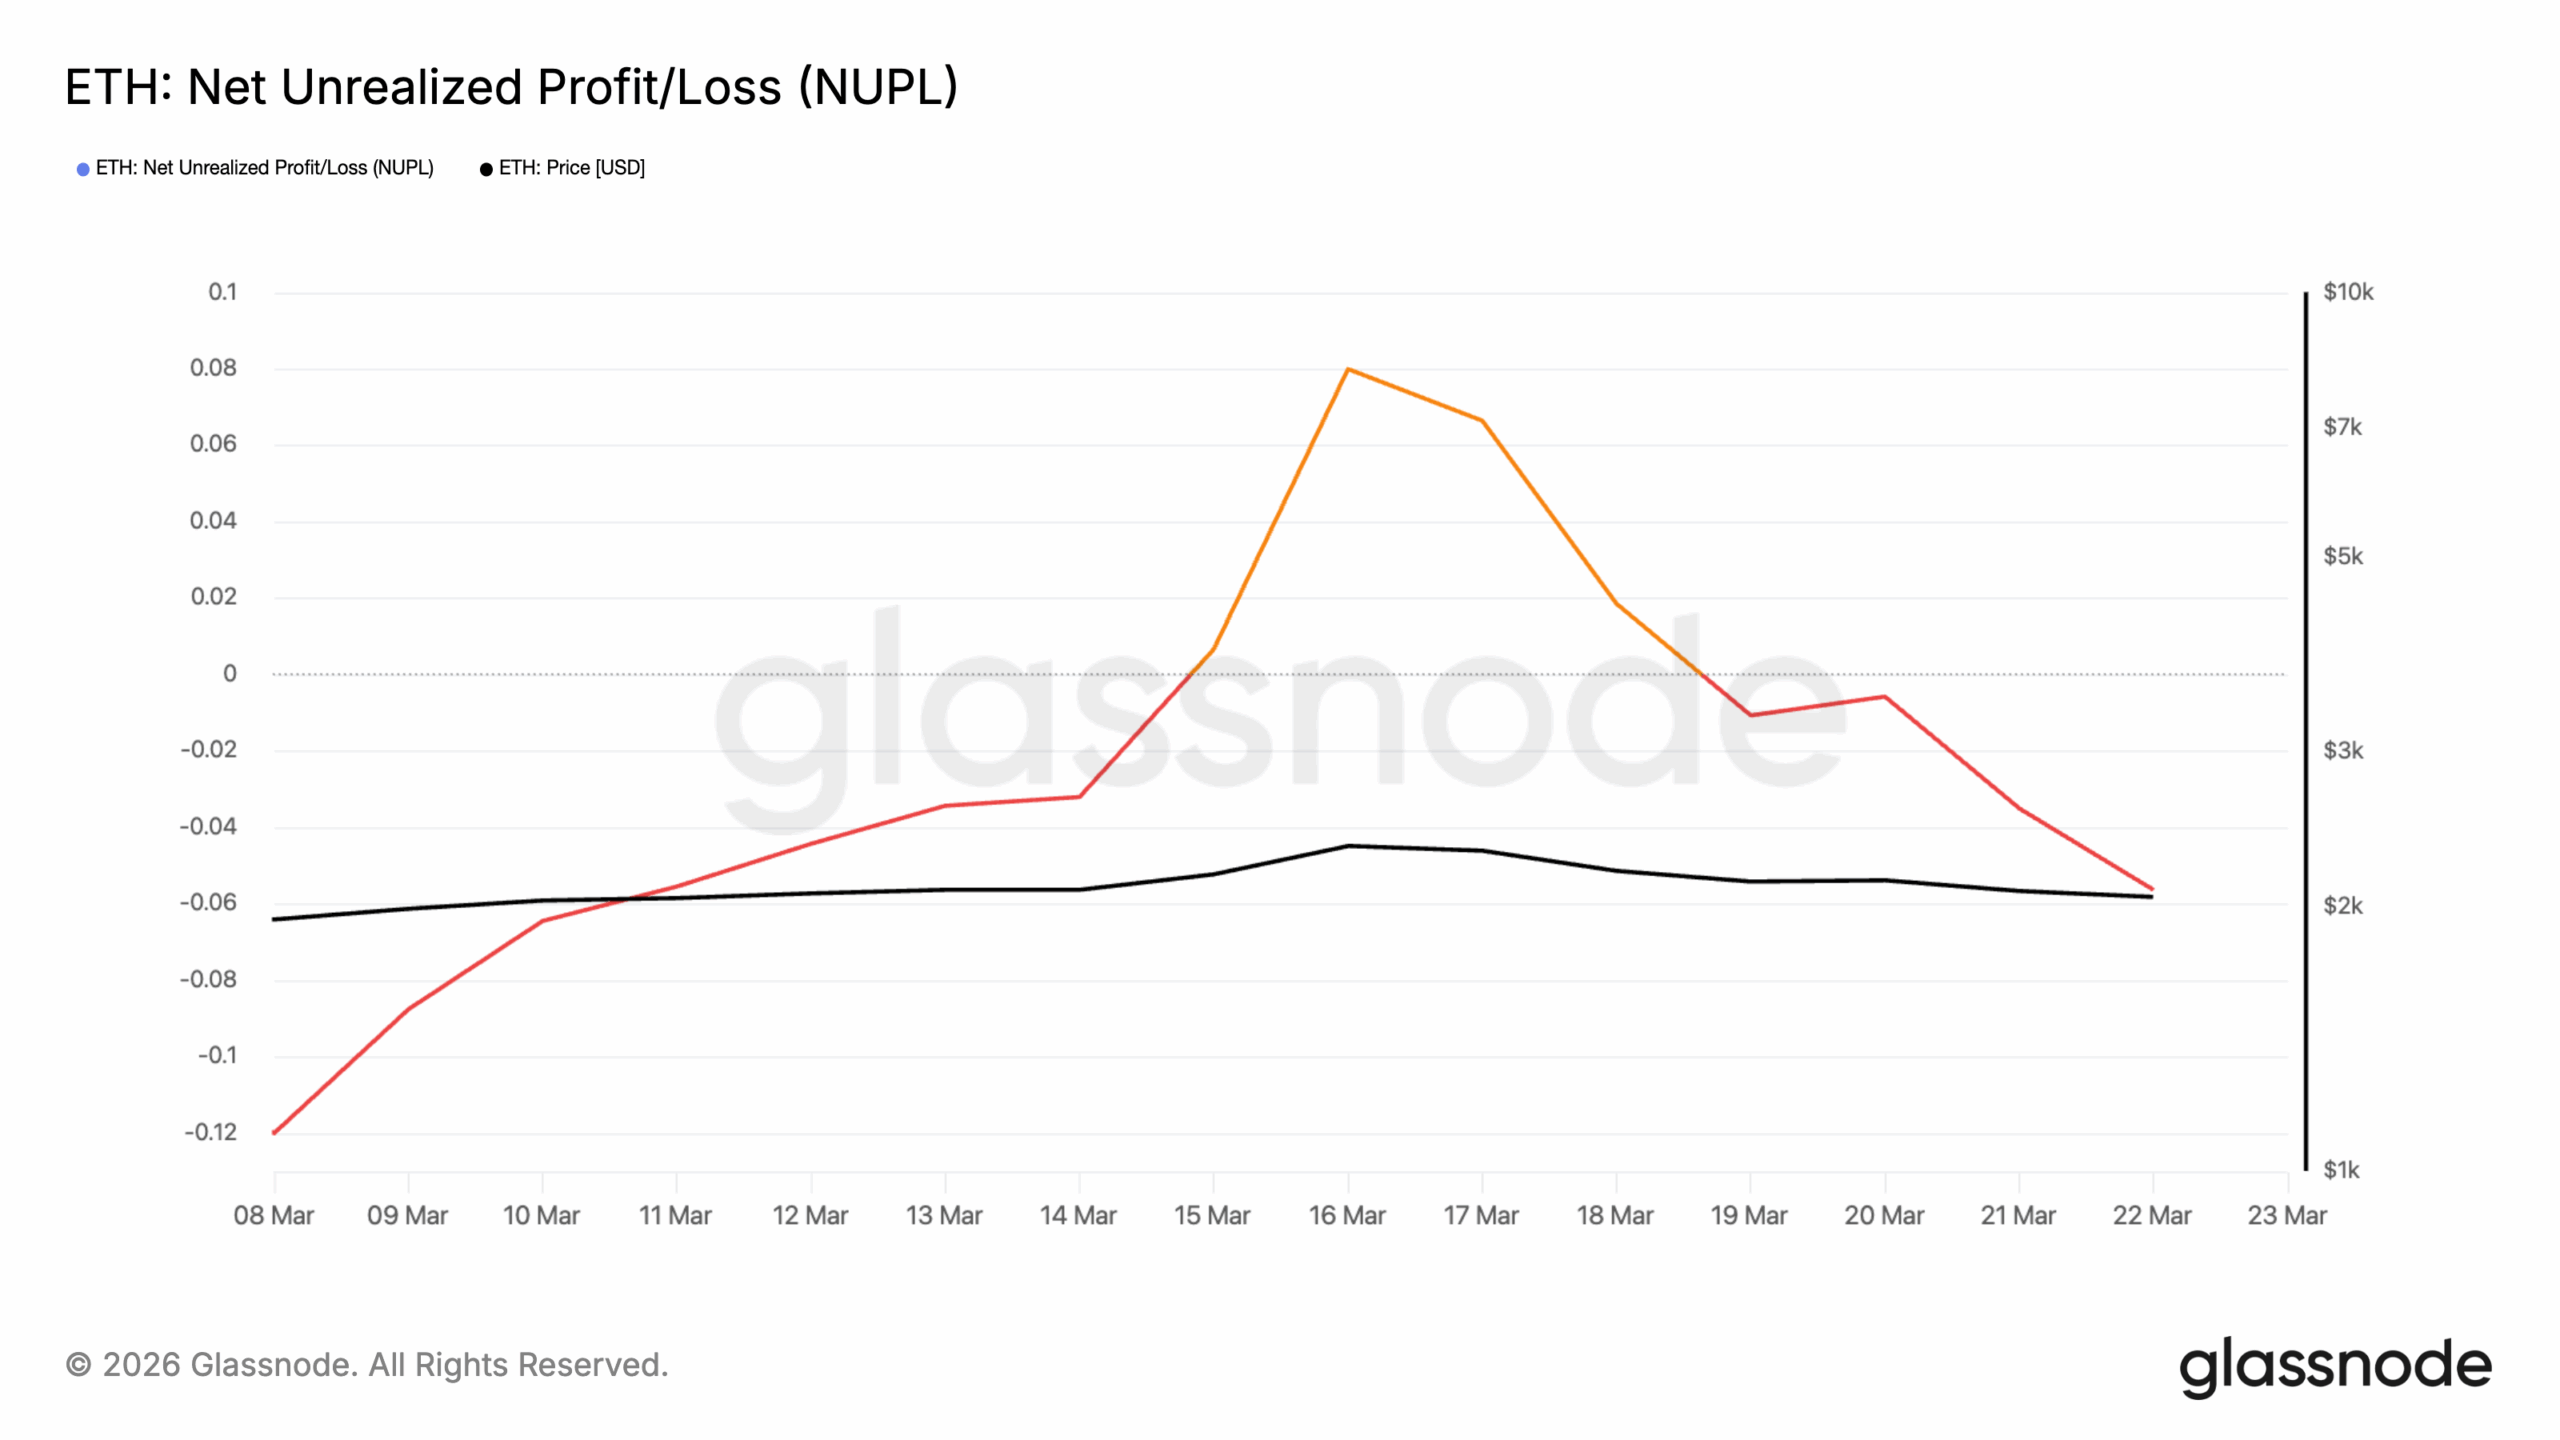
This is the coin’s Net Unrealized Profit/Loss (NUPL) metric, which measures the aggregate unrealized profit or loss held across all ETH market participants relative to market capitalization.
According to Glassnode, ETH’s Net Unrealized Profit/Loss (NUPL) metric has slipped to -0.05. This is its lowest in 12 days and is at a level broadly classified as capitulation territory.
When NUPL turns negative, it means the average coin holder is currently sitting at an unrealized loss on their position, which could potentially worsen the downward pressure on the token’s price if they sell.
However, historically, capitulations like this are observed near market bottoms and often signal a bullish reversal.
This is because at this stage, the cohort most likely to panic-sell (short-term holders) has often already exited, reducing the pool of remaining sellers and creating the conditions that may strengthen market sentiments.
The Two Levels That Will Define Ethereum’s Next Major Move
The daily chart shows ETH trading at $2,045. The altcoin moves in a narrow band between a support floor at $1,913 and a resistance at $2,147, a level ETH has failed to close above since March 20.
If spot selloffs intensify, a close below the $1,913 floor is possible. Should this happen, it could open the door to a move toward the psychological $1,800 level, and in a prolonged bear scenario, as deep as the Fibonacci extension at $1,383.
Conversely, reclaiming $2,147 would be the first sign that bulls are attempting to reassert control.
With NUPL signalling a market entering capitulation, “weak hands” will soon exit, making way for “diamond hands” that can trigger a bullish trend reversal and push the coin past $2,147.
A close above $2,147 could push ETH’s price toward $2,376l. But this can only happen if new demand is sustained.
[You-may-like]
Disclaimer:
The information provided in this article is for informational purposes only. It is not intended to be, nor should it be construed as, financial advice. We do not make any warranties regarding the completeness, reliability, or accuracy of this information. All investments involve risk, and past performance does not guarantee future results. We recommend consulting a financial advisor before making any investment decisions.
Abiodun Oladokun is a Research Analyst at CCN, where he covers cryptocurrency markets with a focus on on-chain analysis, technical assessments, and emerging trends across decentralized finance (DeFi), real-world assets (RWA), artificial intelligence (AI), decentralized physical infrastructure networks (DePIN), Layer 2s, and meme coins.
Prior to CCN, he served as a Senior On-Chain Analyst at BeInCrypto, producing market reports spanning diverse crypto sectors.
Before that, he conducted technical analysis and market assessments of various altcoins at AMBCrypto, where he also contributed long-form quarterly research papers on DeFi, NFTs, DAOs, and scaling architectures, leveraging on-chain platforms including Messari, Santiment, DefiLlama, and Dune Analytics.
He began his crypto career as a research analyst at SixthSense DAO, developing blockchain forensic tools to trace the history of stolen assets.
Abiodun is a lawyer called to the Nigerian Bar and the founder of Ilé Ijó, a Lagos-based electronic dance music collective.