Solana seems ready to erase major losses | Credit: Hameem Sarwar
Share
Key Takeaways
Solana’s price has broken above the resistance line of a megaphone pattern on the 4-hour chart.
Spot volume has recovered slightly after declining sharply during the previous month.
Technical indicators suggest a potential price recovery for Solana toward $111.
Solana’s (SOL) bulls have successfully defended the altcoin from falling below $85.
At the time of writing, SOL has increased by 6.50% over the last 24 hours, trading above $90.
However, it does not seem like Solana’s price is ready to give up its recent gains. In this analysis, CCN explains why SOL has not found it relatively easy to stop a potential breakout above $100.
Solana Forms Megaphone Pattern Amid Bullish Crossover
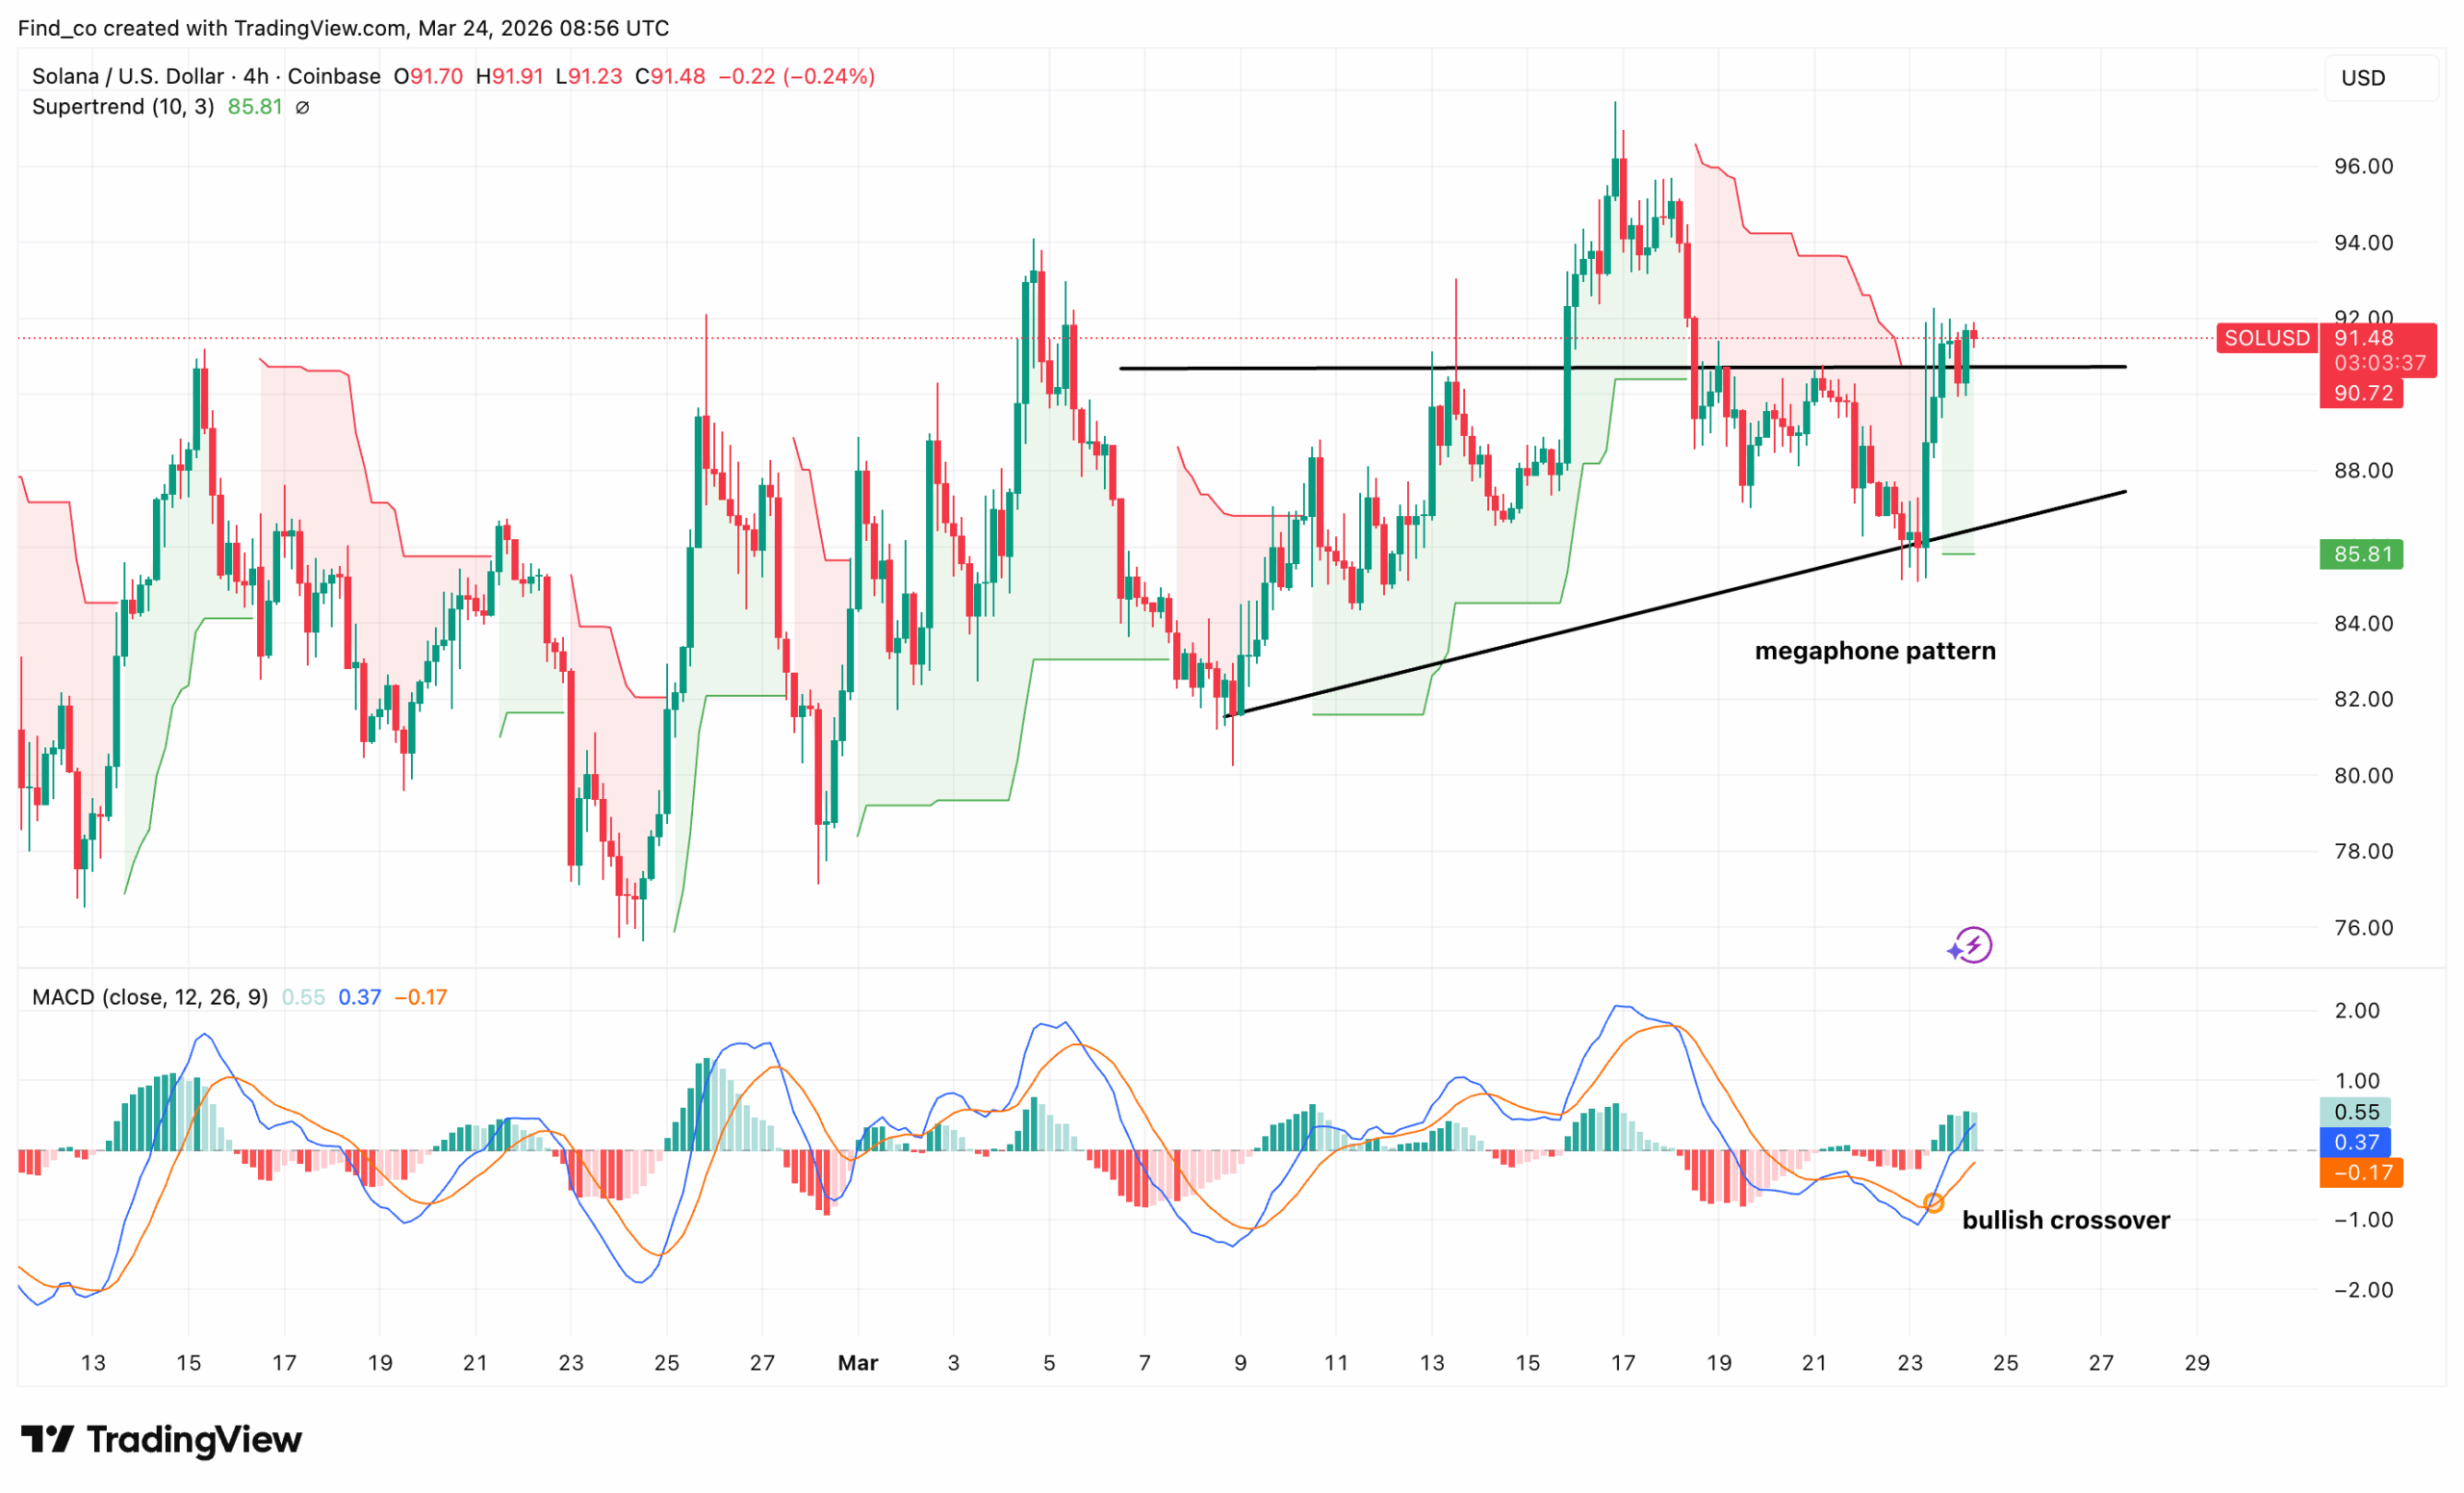
On the 4-hour chart, Solana trades at $91.48. But beneath that, two powerful technical developments are competing for control.
The dominant price structure is a megaphone pattern. For context, this formation is characterized by expanding price swings between a rising lower trendline and a flat-to-rising upper boundary near $91.
However, megaphone patterns signal indecision and growing volatility. Each swing grows larger than the last, reflecting a market where bulls and bears fight with increasing aggression.
Currently, Solana’s price sits right at the upper boundary of the megaphone, having bounced from the rising lower trendline near $85 just days ago.
That bounce was swift, as the altcoin added $7 to its price in just a few candles. The Supertrend indicator at $85.81 has flipped green, confirming that short-term trend momentum now favours buyers.
Furthermore, the MACD delivers the most encouraging signal. A fresh bullish crossover has just printed at deeply negative levels, with the MACD line at 0.55 crossing above the signal line at 0.37. The histogram is turning green and expanding.
Historically, MACD crossovers from such oversold depths tend to precede sustained moves higher.
However, the megaphone’s upper boundary near $92 must break. Repeated failures at this level have defined the pattern.
But if SOL’s price closes above $92 targets the recent highs near $96.
Fundamentals Begin to Change Trend
Despite the price pressure, Solana’s DeFi activity has gone quiet, but not completely dark.
This DEX volume chart, covering January through late March 2026, captures a dramatic shift in on-chain activity that reveals broader trends in market confidence and the turbulence gripping crypto markets.
January was extraordinary. Daily DEX volumes on Solana surged consistently between $3 billion and $5 billion.
That period represented peak engagement. Net flows, shown by the purple bars on the right axis, were also regularly positive, confirming that capital was actively entering the ecosystem.
Then came the collapse. After Feb. 14, volumes fell off a cliff, dropping from multi-billion-dollar sessions to as low as $400 million to $800 million per day.
That’s a decline of roughly 70% from peak activity. The timing aligns with the broader crypto market drawdown triggered by geopolitical shock and risk-off sentiment.
However, March has brought a modest recovery. Volumes have stabilised between $1 billion and $2 billion — healthier than the February trough but still far below January highs.
More encouragingly, two significant net flow spikes occurred around March 4 and March 20, suggesting that institutional or large-wallet capital briefly re-engaged at those levels.
Should these inflows continue to rise, Solana’s price will likely move closer to $120
SOL Price Prediction
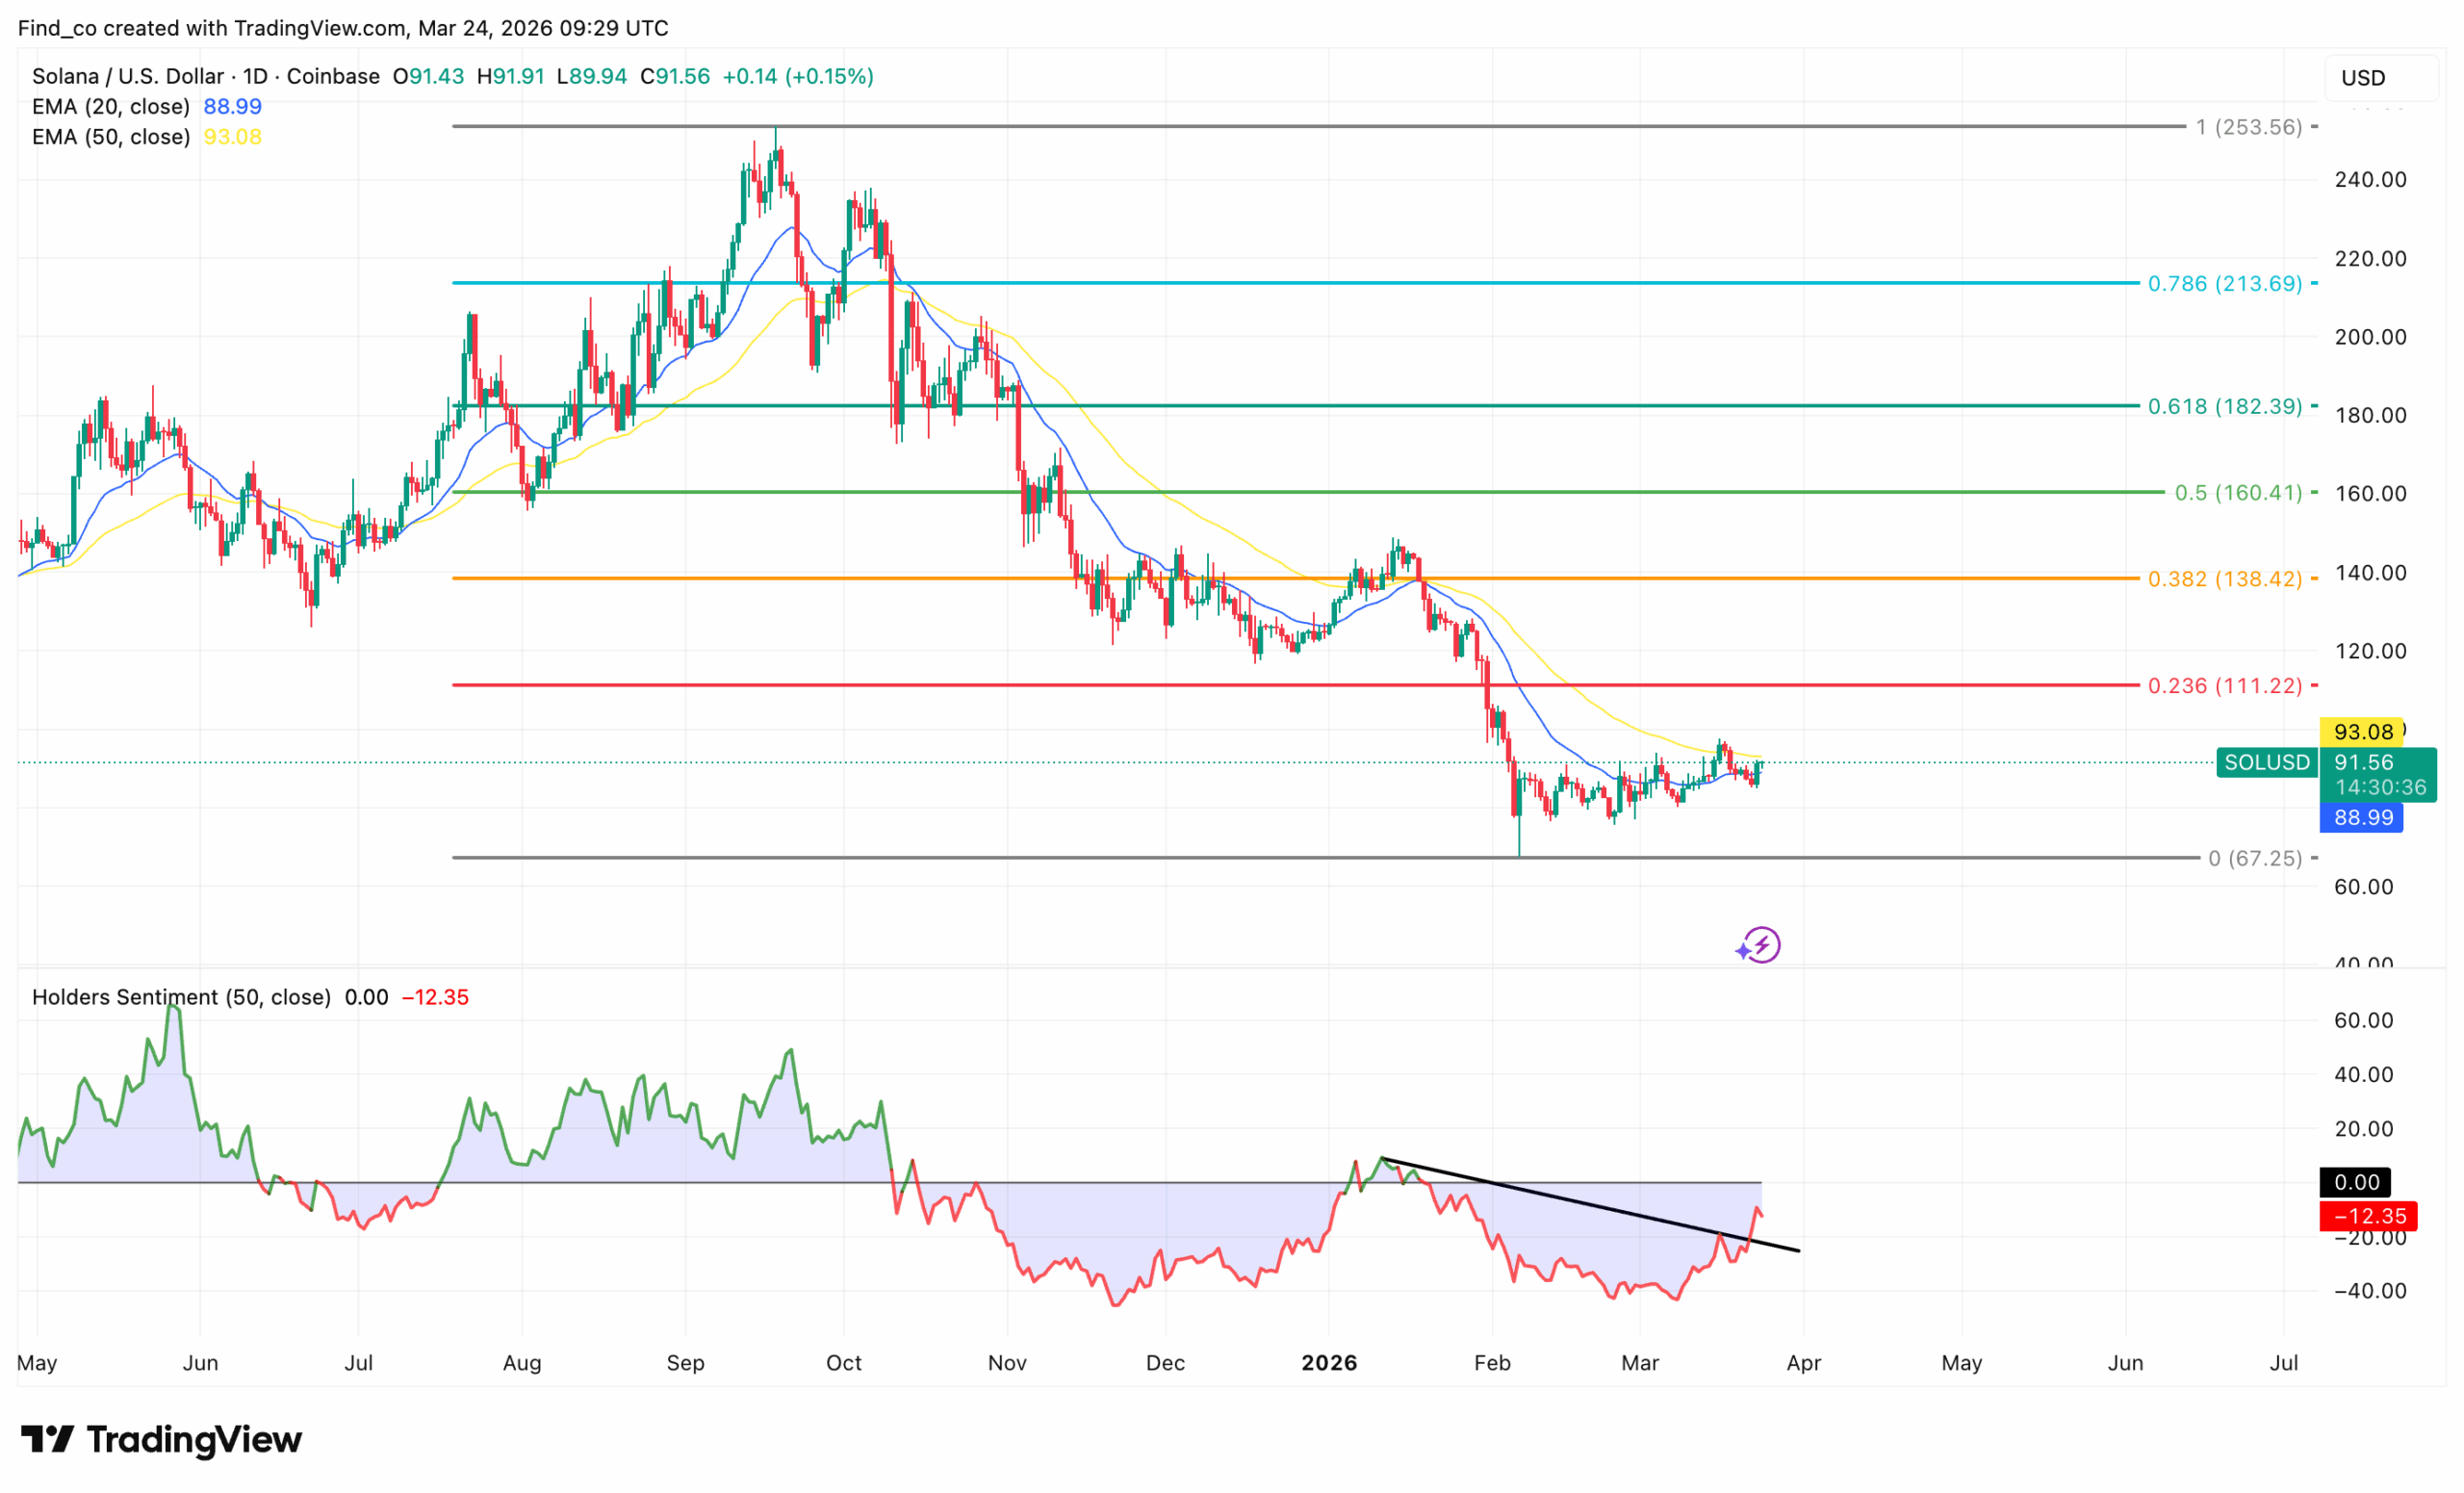
On the daily chart at Coinbase, Solana’s price is slowly setting up a bullish structure. However, the bigger story lies in the sentiment indicator below, which is flashing a potentially important divergence signal.
The price history is brutal and well-documented. SOL peaked near $253 in October 2025, then endured a relentless decline through November and into February 2026, bottoming near $67.25.
That’s a drawdown of over 73%. The collapse sliced through every Fibonacci support level in sequence, eventually landing below the 0.236 level at $111.22.
Currently, Solana’s price hovers between its two EMAs — the 20 EMA at $88.99 and the 50 EMA at $93.08.
Price is sandwiched between these two levels, and the 50 EMA is acting as immediate resistance. A close above $93.08 would flip it from resistance to support and mark a significant short-term technical improvement.
The Holders Sentiment indicator delivers the most compelling signal. Since February, the indicator has been printing a clear bullish divergence.
That divergence suggests holders are growing less pessimistic despite weak SOL price action. Historically, that kind of quiet sentiment recovery precedes price recovery.
Nevertheless, the Fibonacci roadmap reveals how much work remains. Reclaiming $111.22, then $138.42, and ultimately $160 represents the staircase the bulls must climb.
For now, holding above $88 is the immediate priority.
Disclaimer:
The information provided in this article is for informational purposes only. It is not intended to be, nor should it be construed as, financial advice. We do not make any warranties regarding the completeness, reliability, or accuracy of this information. All investments involve risk, and past performance does not guarantee future results. We recommend consulting a financial advisor before making any investment decisions.
Victor Olanrewaju is a crypto analyst and reporter at CCN with deep roots in on-chain research and technical analysis. His crypto journey began in 2017, but it was the 2020 Uniswap airdrop that sparked a full-time pivot into the space.
With a foundation in copywriting, Victor honed his craft creating high-converting content for leading crypto brokers — most notably an XRP price prediction that ranked #1 on Google during the 2021 bull run.
He later joined AMBCrypto in 2022, where he combined storytelling with technical and on-chain analysis to cover key market narratives.
In 2024, he expanded his expertise at BeInCrypto, collaborating with analysts and using tools like Glassnode, Santiment, and IntoTheBlock to break down Bitcoin and altcoin trends.
At CCN, Victor covers the top cryptocurrencies, memecoins, macro shifts, blending real-time insights with deep-dive metrics.
He holds a Bachelor’s degree in Physics from the University of Ibadan, equipping him to simplify complex data for a wide audience. Follow his work or connect on LinkedIn or X.