Macro pressure remains dominant ahead of today’s Consumer Price Index (CPI) outcome.
On-chain flows confirm it. Nearly 3.8 million LINK moved onto exchanges this week, creating persistent sell-side pressure that easily overwhelmed modest ETF inflows.
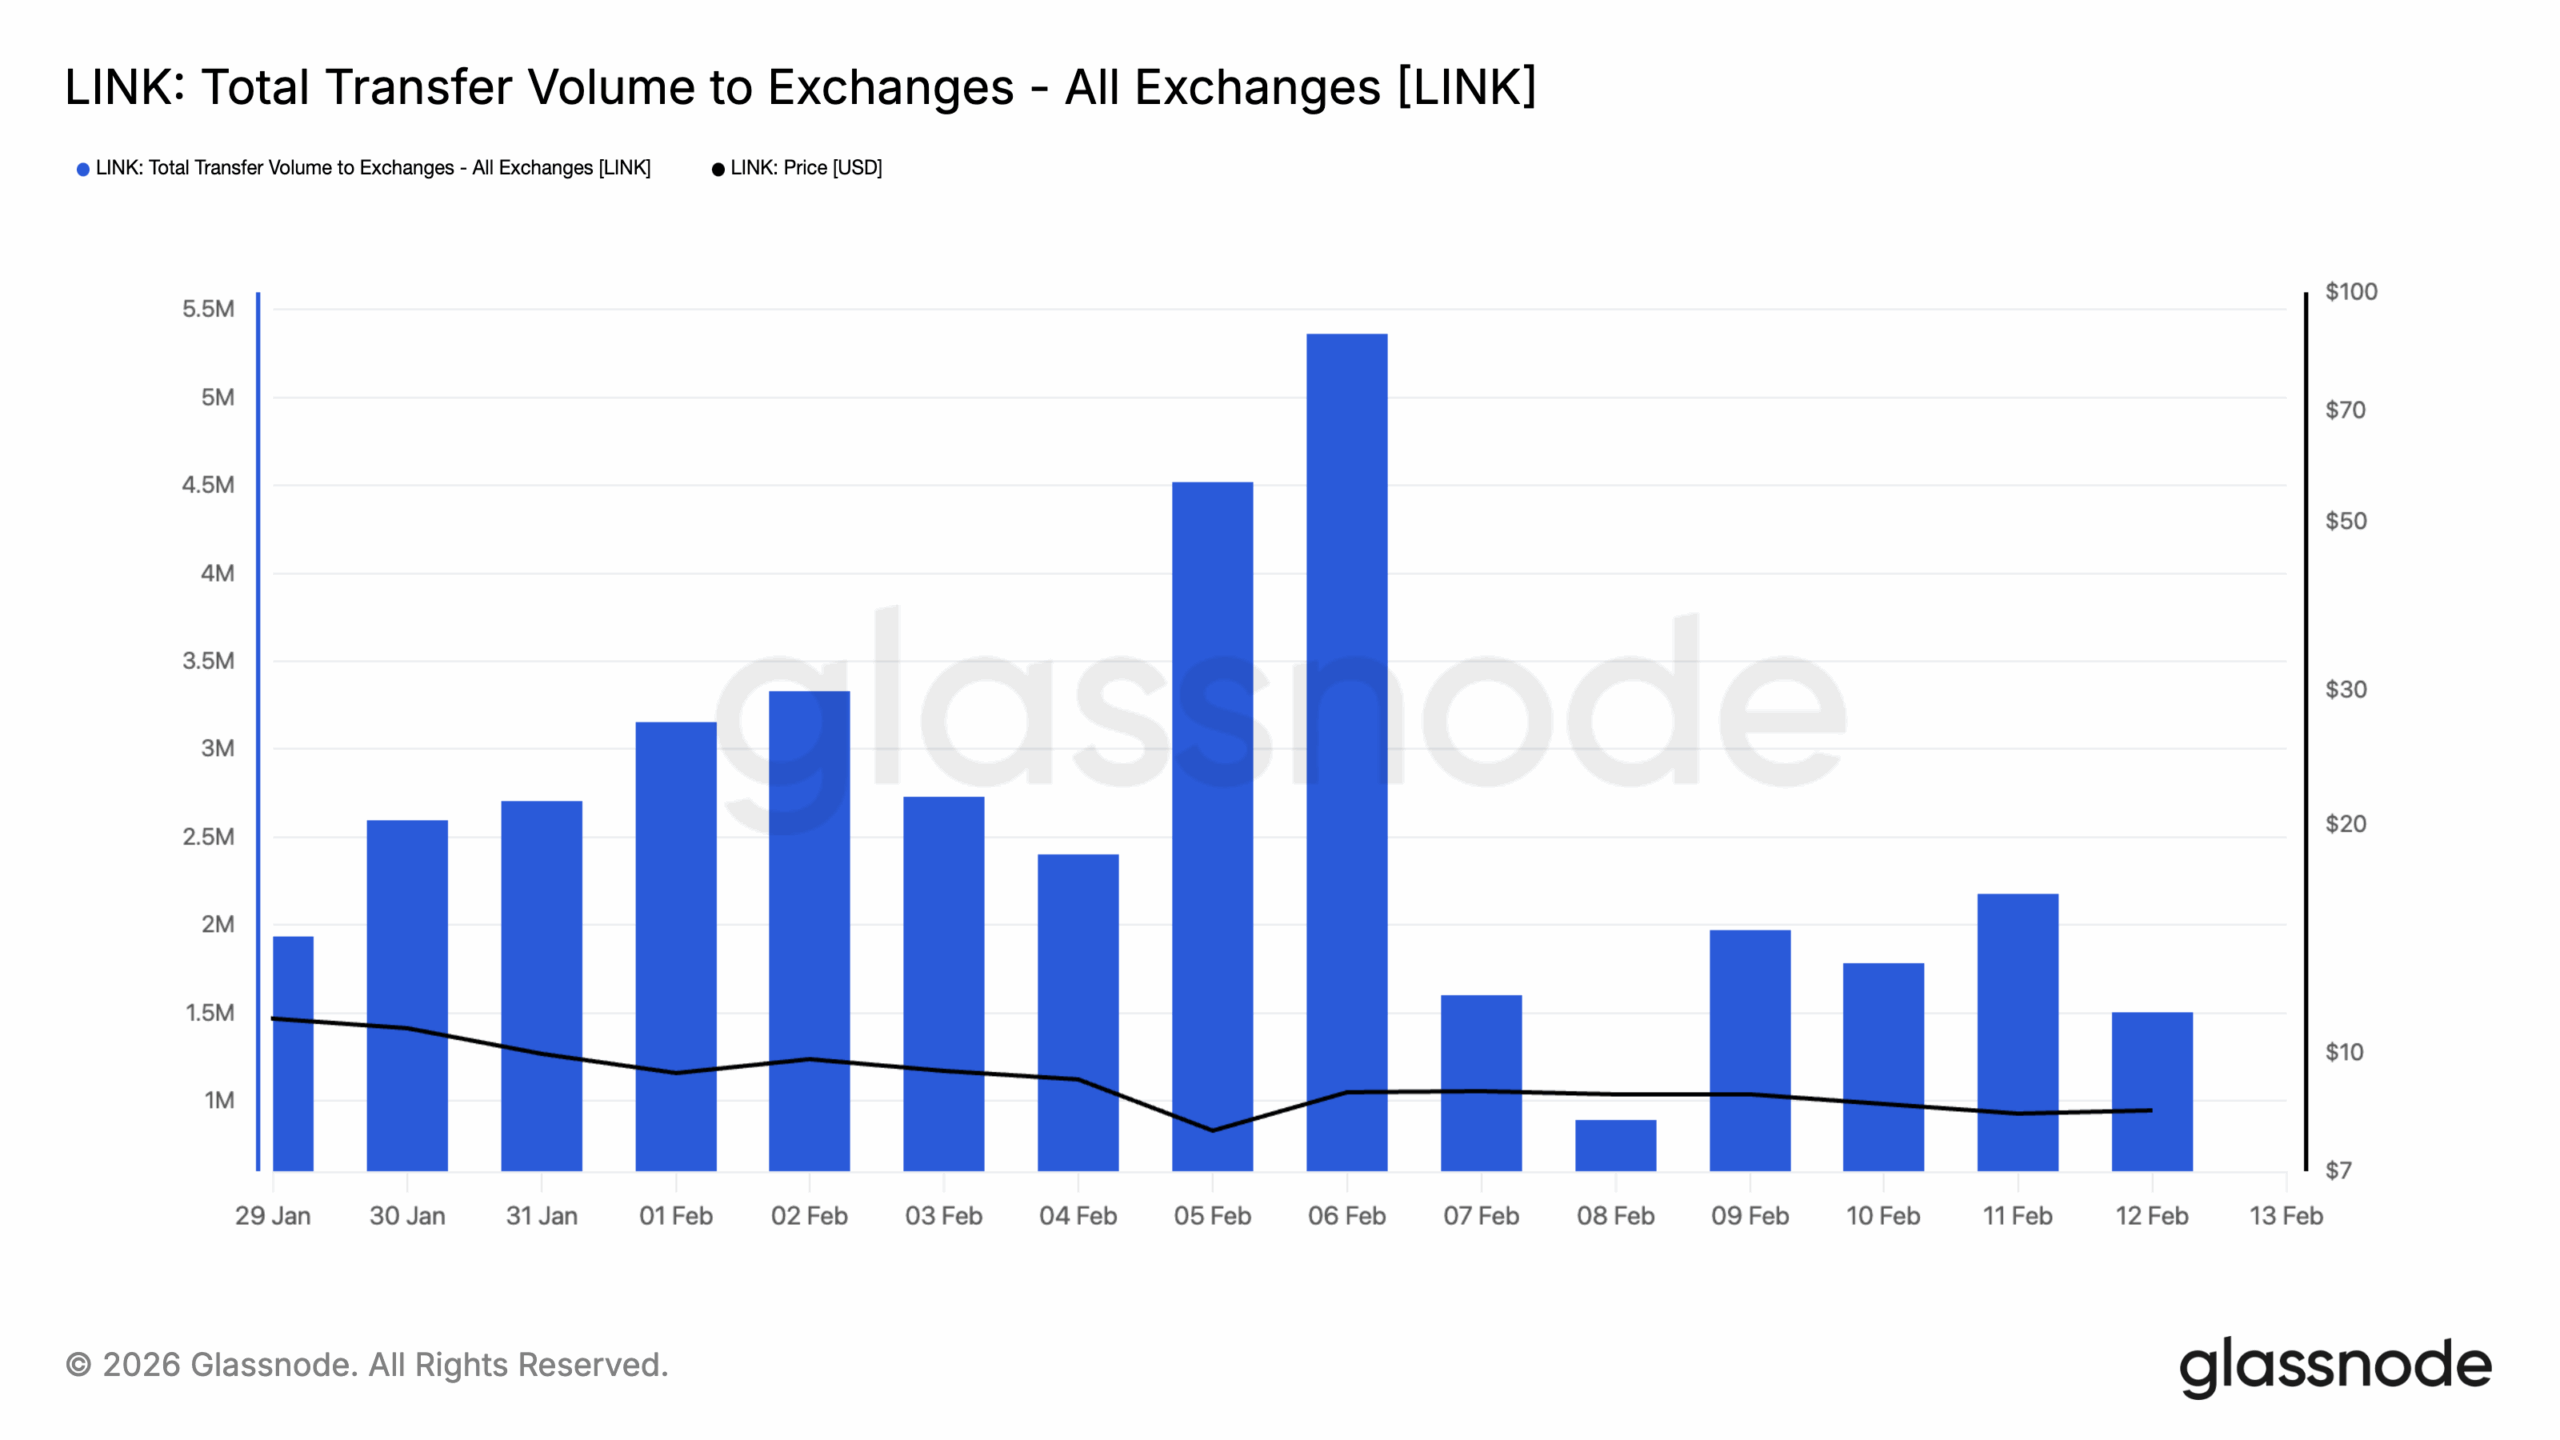
LINK’s total transfer volume to exchanges shows two clear spikes on Feb. 5 and Feb. 6, with inflows jumping above 4.5 million and then above 5 million, respectively.
Leading into those spikes, inflows had already been trending higher from late January into early February, while prices were gradually weakening.
After Feb. 6, exchange inflows dropped, with Feb. 8 marking a notably low transfer day.
Chainlink’s price stabilized slightly during that period, which aligns with reduced immediate sell pressure. However, inflows picked up modestly again from February 9 to 11.
Overall, the data suggests the heavy distribution event likely drove the altcoin’s price. Should this trend persist, Chainlink’s price might struggle to break out.
The Paradox: Fundamentals at All-Time Highs
What makes the current setup frustrating for long-term holders is the divergence between price and progress.
CME LINK Futures launched on Feb 9, opening institutional access.
Ondo Finance selected Chainlink for RWA pricing infrastructure.
Robinhood tapped Chainlink to support its new Layer 2 network.
CCIP adoption continues to expand.
Yet these wins have not translated into positive price action for Chainlink. But at the same time, it might not surprise those who have experienced several market cycles.
For context, this is what value-price divergence looks like in a bear market.
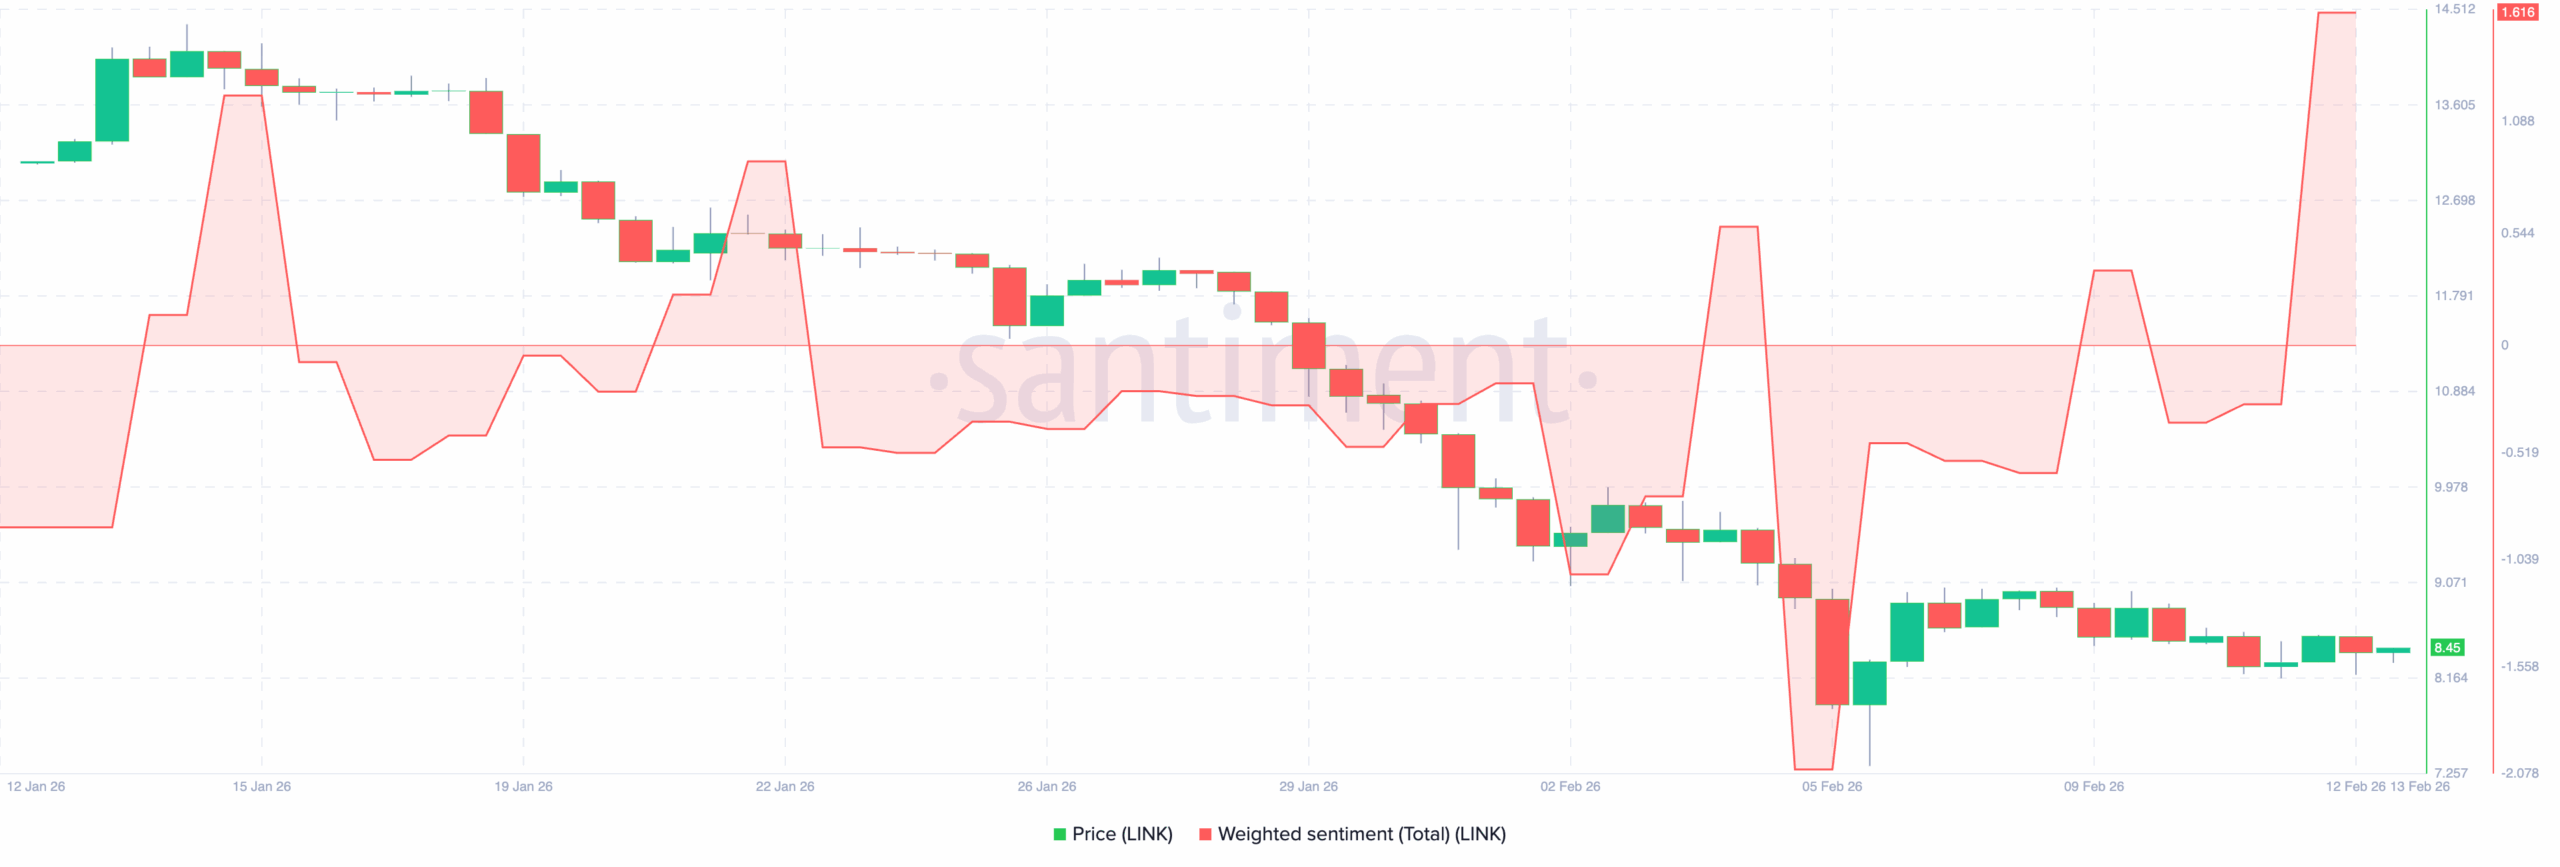
Apart from this, LINK’s weighted sentiment has flipped positive in the most recent reading, spiking to one of the highest levels in 2026.
However, the price still remains compressed around the $8.50 area. This is notable because it follows a prolonged downtrend from mid-January, during which sentiment oscillated but failed to sustain bullish momentum.
The most extreme negative sentiment reading occurred around Feb. 5, aligning with the local price low near the $8 zone.
However, since then, Chainlink’s price has moved only sideways to slightly up, while sentiment has surged aggressively higher again.
When sentiment spikes while price is still structurally weak and below prior breakdown levels, it can sometimes signal short-term optimism returning too early.
So, if LINK’s price fails to break above nearby resistance, that would reinforce the broader bearish structure.
On the other hand, if this sentiment expansion is followed by a strong move reclaiming lost levels, it could mark the early stages of a reversal. But for now, it looks unlikely.
Chainlink Price Prediction: No Bounce Here
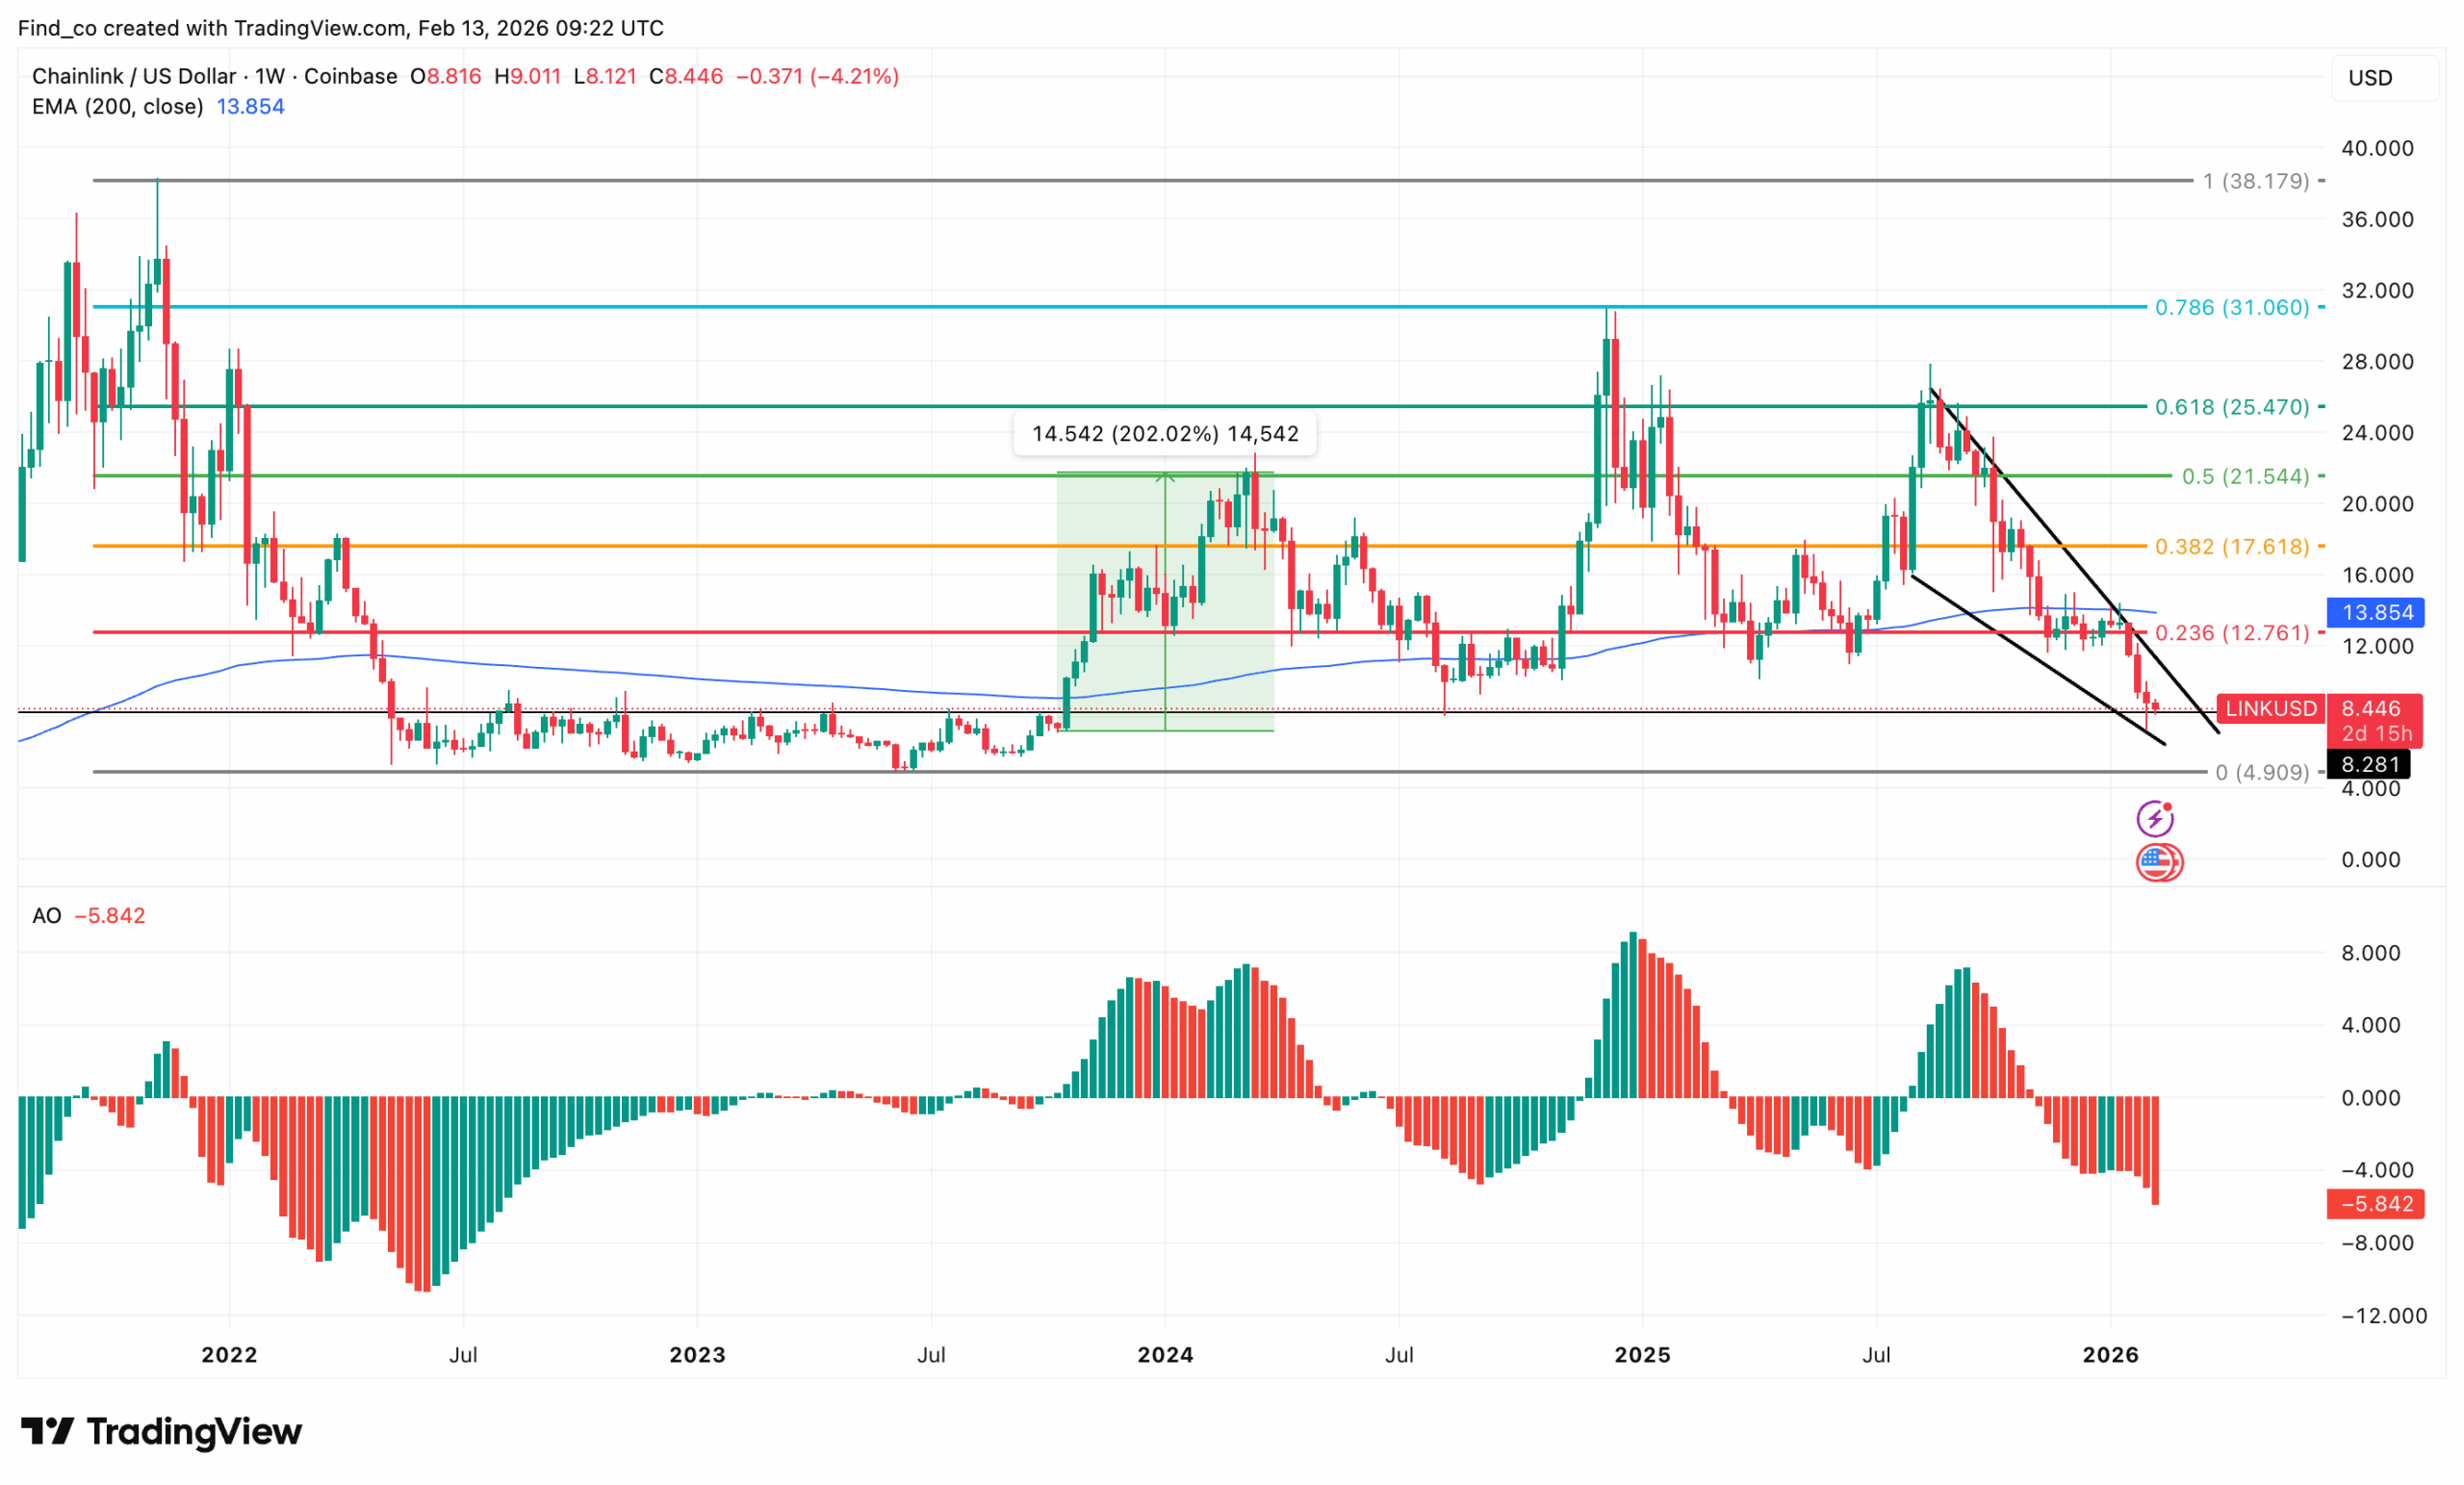
On the weekly timeframe, Chainlink’s price remains in a macro downtrend and is currently trading around $8.40 after losing the 0.236 Fibonacci level near $12.76.
The rejection from the $25.47 region (0.618) marked a major lower high, and the price has since followed a well-defined descending channel, with consistent lower highs and lower lows.
The recent breakdown toward the $8 area confirms continued structural weakness rather than a confirmed bottom.
Price is also trading well below the 200-week EMA, which sits around $13.85. That moving average is now acting as dynamic resistance.
Until LINK can reclaim and hold above that level on a weekly closing basis, any bounce is technically just a relief rally within a broader bearish structure.
The next major horizontal support lies near $4.90, which aligns with prior-cycle lows.
Disclaimer:
The information provided in this article is for informational purposes only. It is not intended to be, nor should it be construed as, financial advice. We do not make any warranties regarding the completeness, reliability, or accuracy of this information. All investments involve risk, and past performance does not guarantee future results. We recommend consulting a financial advisor before making any investment decisions.
Victor Olanrewaju is a crypto analyst and reporter at CCN with deep roots in on-chain research and technical analysis. His crypto journey began in 2017, but it was the 2020 Uniswap airdrop that sparked a full-time pivot into the space.
With a foundation in copywriting, Victor honed his craft creating high-converting content for leading crypto brokers — most notably an XRP price prediction that ranked #1 on Google during the 2021 bull run.
He later joined AMBCrypto in 2022, where he combined storytelling with technical and on-chain analysis to cover key market narratives.
In 2024, he expanded his expertise at BeInCrypto, collaborating with analysts and using tools like Glassnode, Santiment, and IntoTheBlock to break down Bitcoin and altcoin trends.
At CCN, Victor covers the top cryptocurrencies, memecoins, macro shifts, blending real-time insights with deep-dive metrics.
He holds a Bachelor’s degree in Physics from the University of Ibadan, equipping him to simplify complex data for a wide audience. Follow his work or connect on LinkedIn or X.