Solana's price is unlikely to trade higher in the short term | Credit: Hameem Sarwar
Share
Key Takeaways
Sellers continue to defend the upper boundary, while price holds between $76 support and sub-$100 resistance.
Momentum is weakening as bearish signals build: the CMF has turned negative, and the AO is printing red bars.
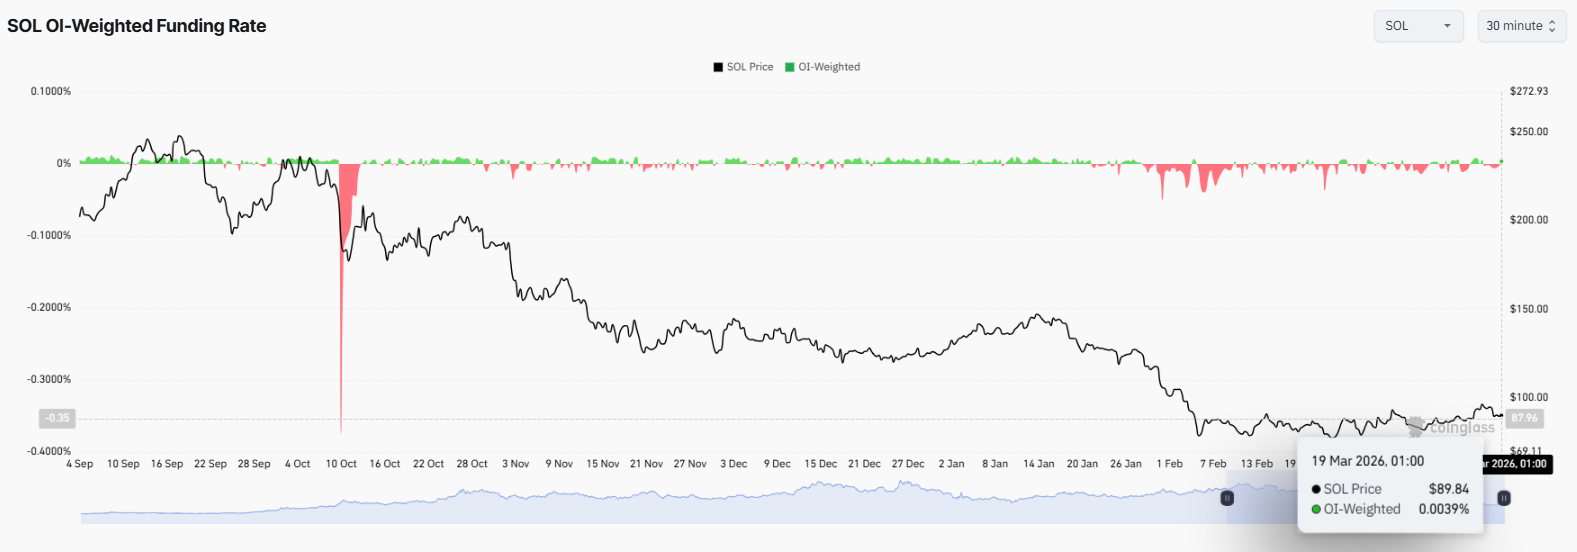
Although the funding rate has flipped positive, SOL’s price is stabilizing above key demand levels.
Solana (SOL) looked ready to break out. Instead, it pulled back.
The rejection of amounts below $100 is becoming the norm rather than the exception. At the same time, weakening momentum is adding pressure.
So, the big question now is whether SOL’s price can recover or remain stuck below resistance.
Solana Sellers Gain Control
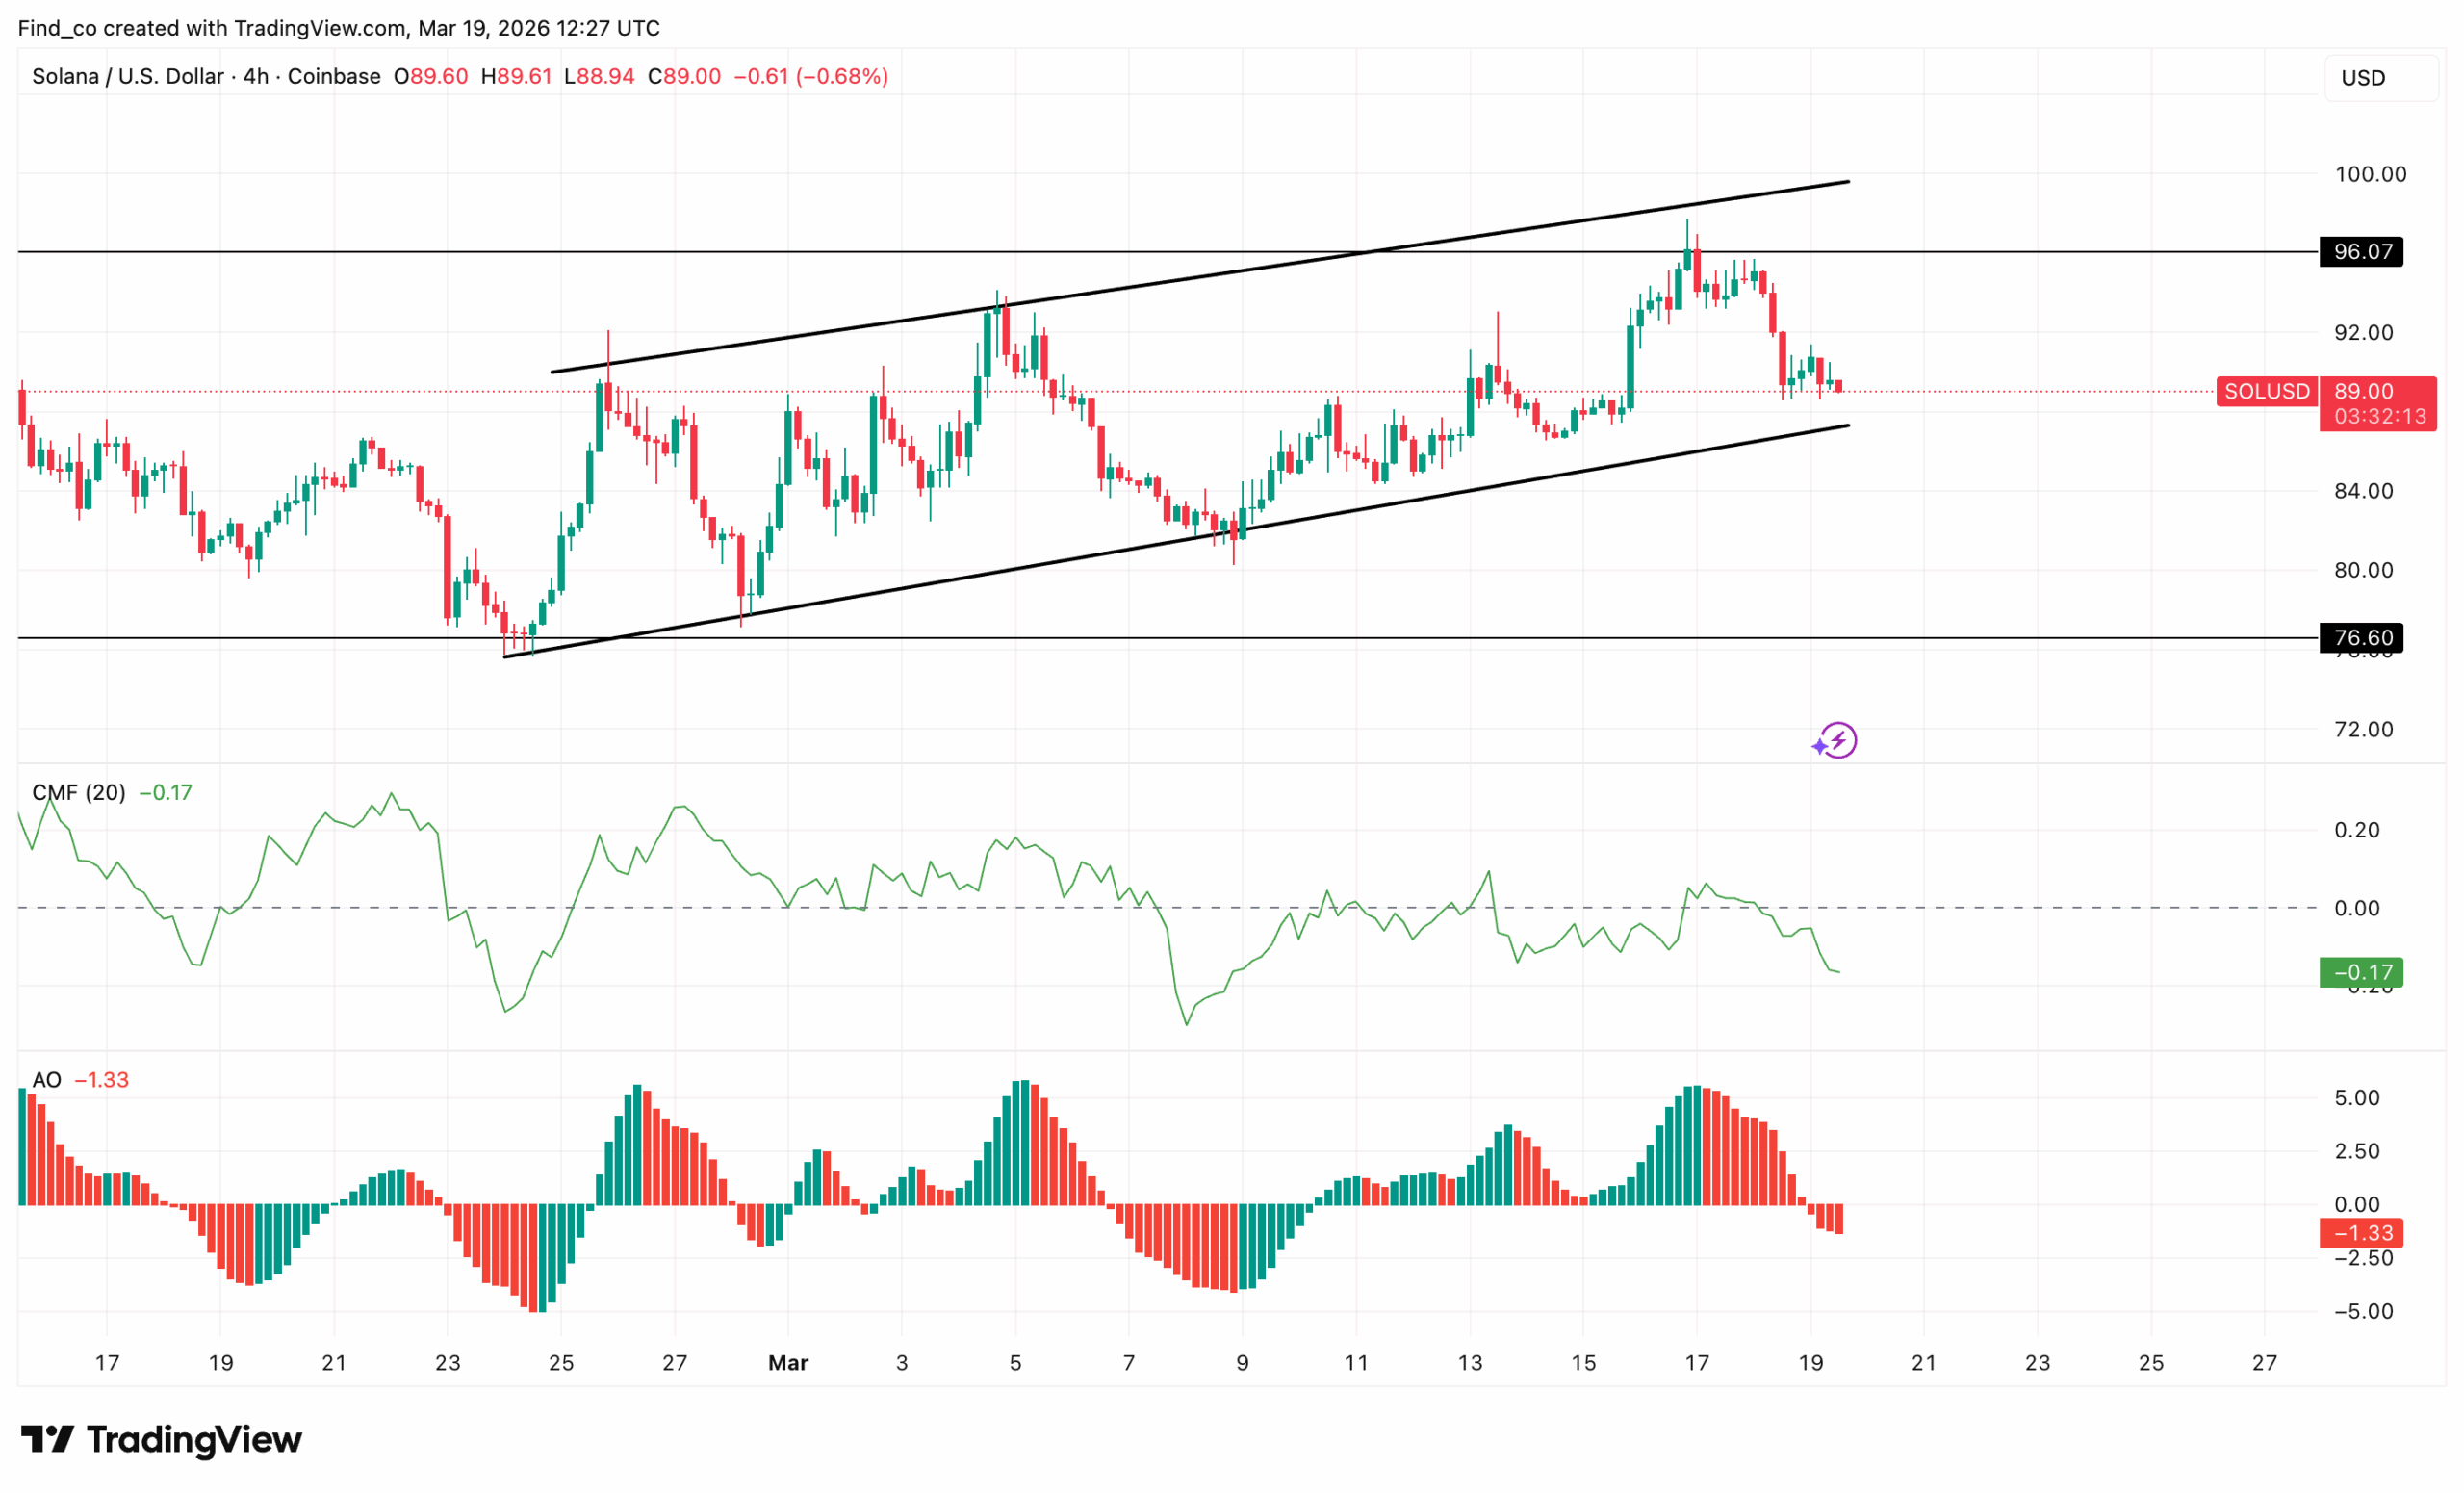
On the 4-hour chart, SOL is showing signs of exhaustion after failing to extend its recent rally toward the $100 psychological level.
Although the broader structure remains intact, short-term momentum is clearly fading.
First, price action confirms a range-bound structure. Solana’s price continues to trade between a well-defined support near $76 and resistance just below $100.
Recently, the asset pushed into the upper boundary but failed to break through. Instead, sellers stepped in, forcing a rejection and dragging the price back toward $90.
However, rejection is not the only concern.
Momentum indicators are now aligning with the bearish case.
The Chaikin Money Flow (CMF) has slipped into negative territory, currently around -0.15. This signals capital outflows and suggests that buying pressure is weakening.
At the same time, the Awesome Oscillator (AO) has flipped red and is printing declining histogram bars.
This shift indicates that bullish momentum is fading and sellers are gradually taking control.
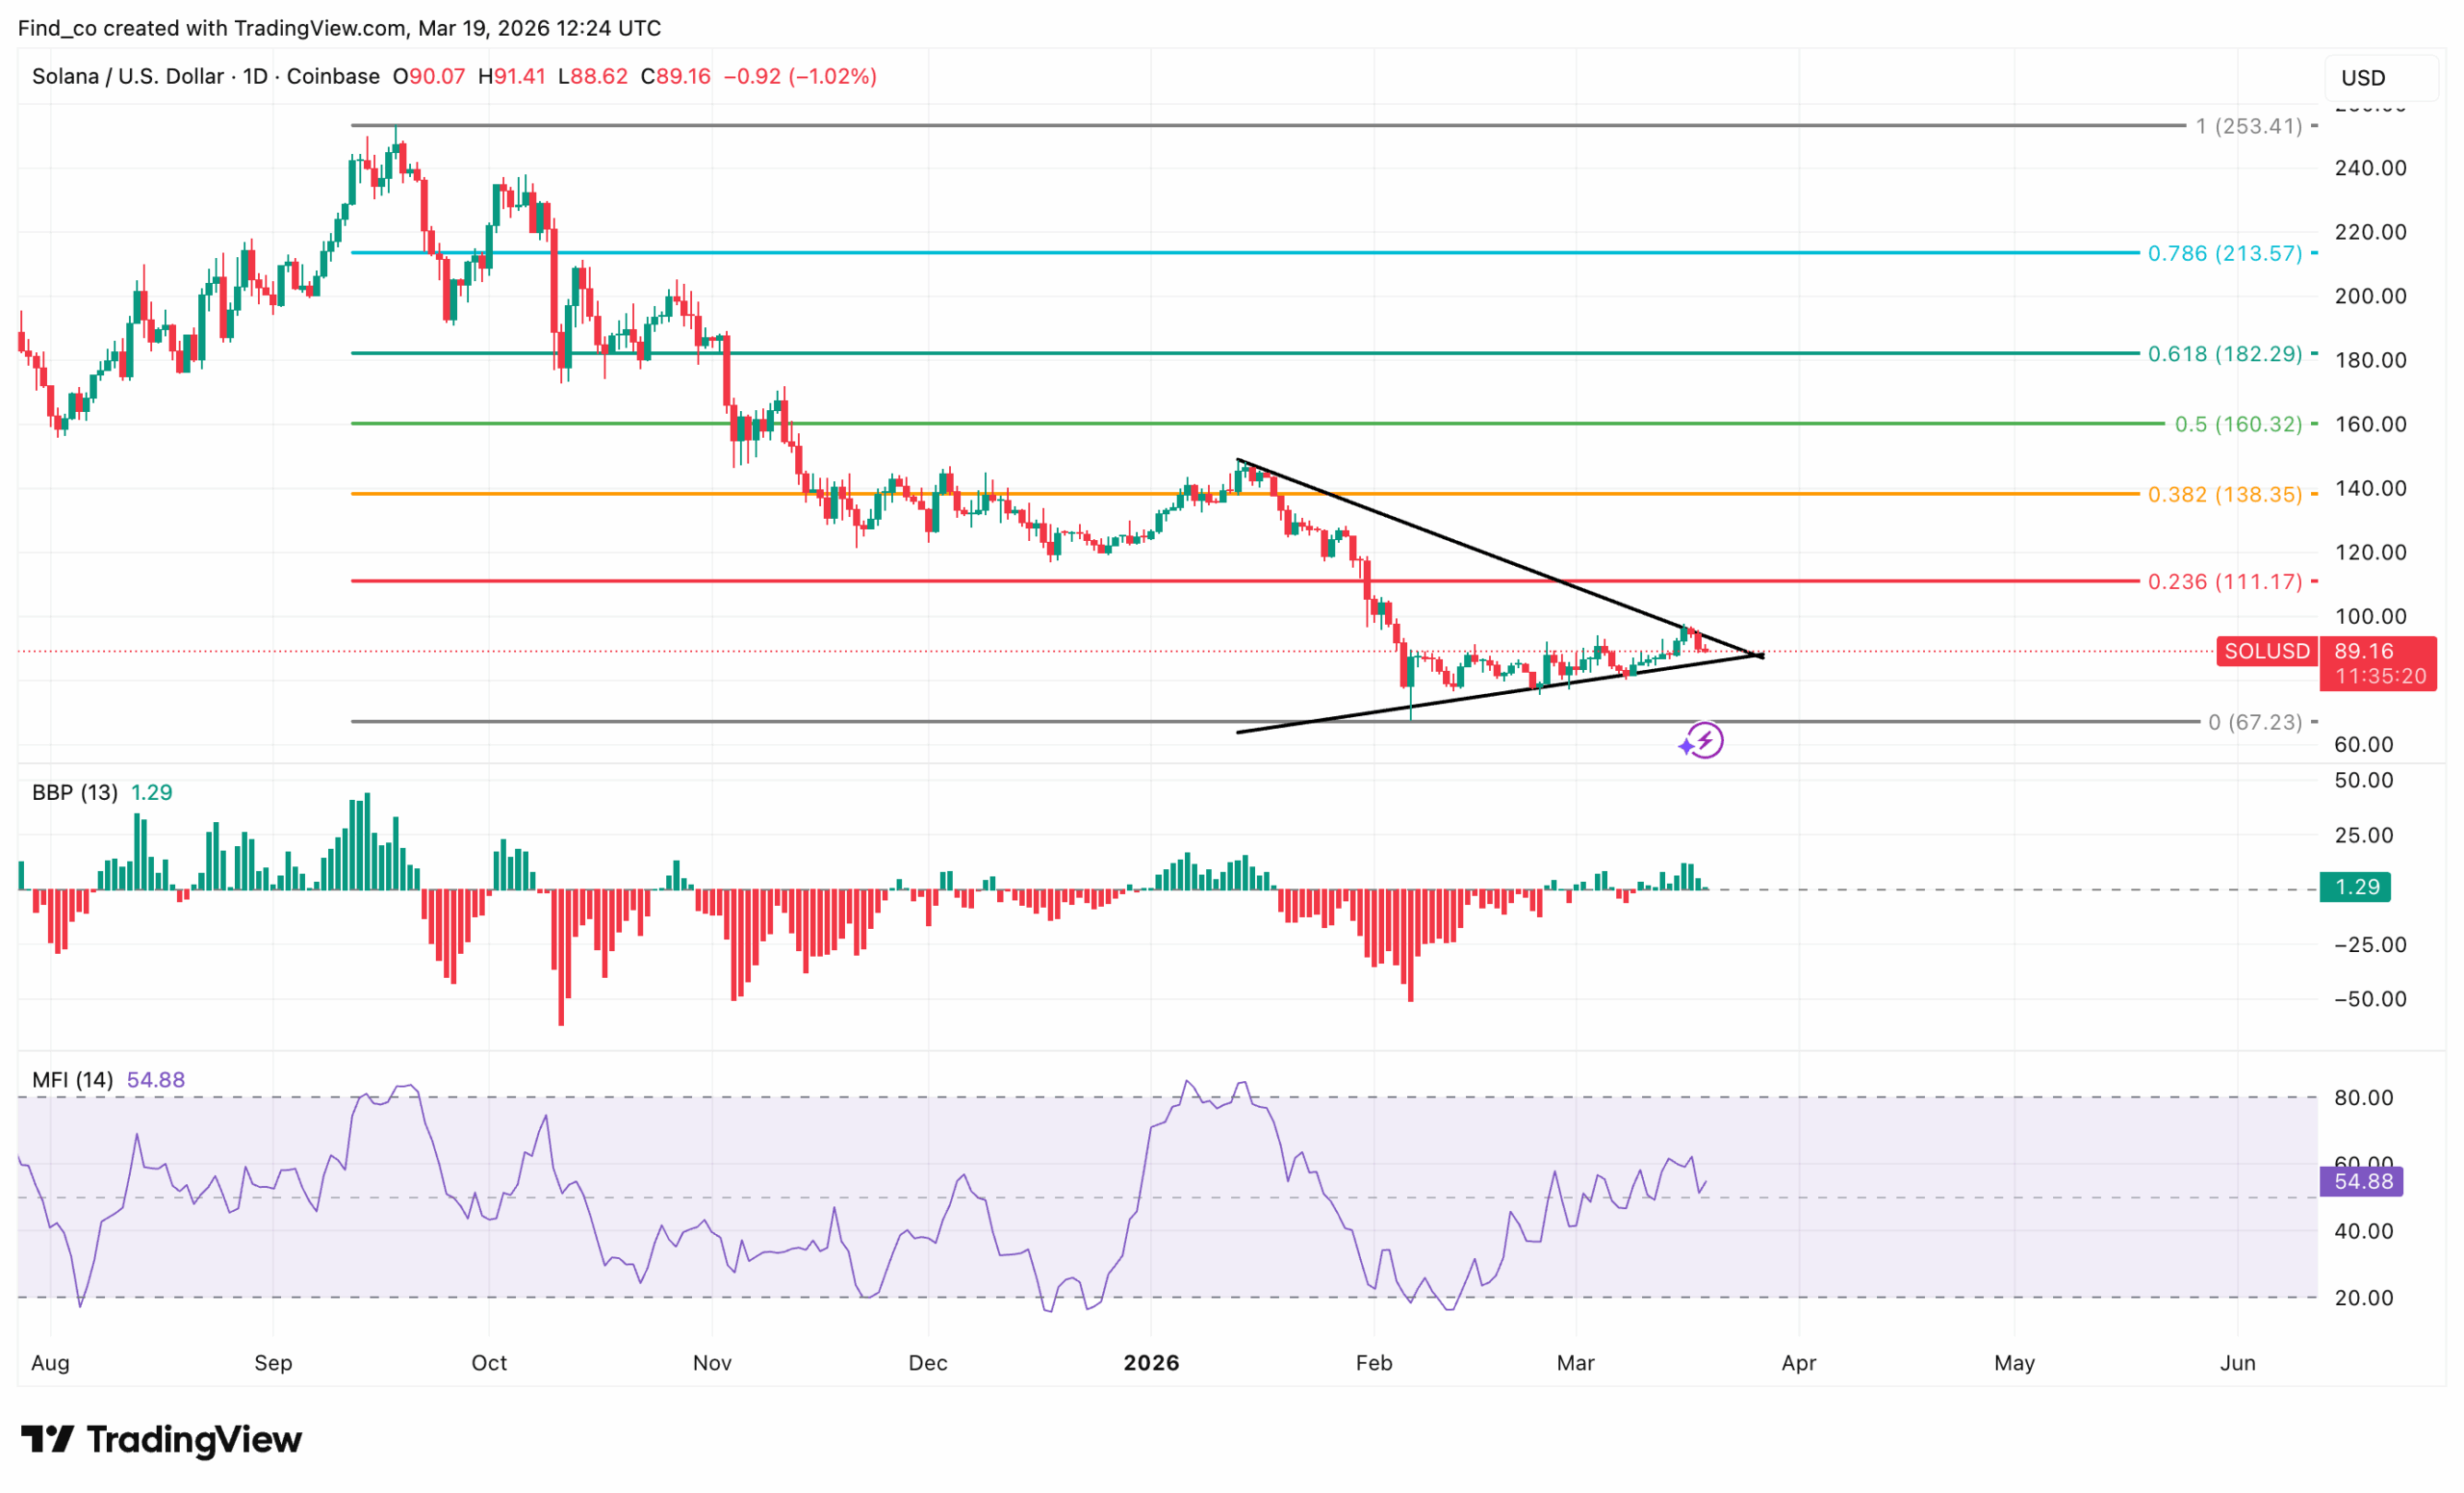
Solana (SOL) shows tentative stabilization after recent lows, trading near $89.90.
Price continues to consolidate above the $67.47 demand zone, signaling cautious recovery, while selling pressure from the prior downtrend appears to be easing.
Price has formed a shallow consolidation range, indicating buyers are slowly stepping in at discounted levels.
Although Solana’s price has broken above the short-term descending trendline, momentum remains moderate, suggesting a gradual rather than aggressive recovery.
Indicators reflect mixed signals. The Bull Bear Power (BBP) is slightly positive at 1.07, signaling mild buying pressure, while the Money Flow Index (MFI) sits at 55.02, just above neutral.
Both suggest cautious accumulation, though neither confirms a strong trend reversal yet.
Resistance near $112 (0.236 Fib) and $139.71 (0.382 Fib) remains critical. Solana’s price needs to reclaim these levels to accelerate a bullish move.
Disclaimer:
The information provided in this article is for informational purposes only. It is not intended to be, nor should it be construed as, financial advice. We do not make any warranties regarding the completeness, reliability, or accuracy of this information. All investments involve risk, and past performance does not guarantee future results. We recommend consulting a financial advisor before making any investment decisions.
Victor Olanrewaju is a crypto analyst and reporter at CCN with deep roots in on-chain research and technical analysis. His crypto journey began in 2017, but it was the 2020 Uniswap airdrop that sparked a full-time pivot into the space.
With a foundation in copywriting, Victor honed his craft creating high-converting content for leading crypto brokers — most notably an XRP price prediction that ranked #1 on Google during the 2021 bull run.
He later joined AMBCrypto in 2022, where he combined storytelling with technical and on-chain analysis to cover key market narratives.
In 2024, he expanded his expertise at BeInCrypto, collaborating with analysts and using tools like Glassnode, Santiment, and IntoTheBlock to break down Bitcoin and altcoin trends.
At CCN, Victor covers the top cryptocurrencies, memecoins, macro shifts, blending real-time insights with deep-dive metrics.
He holds a Bachelor’s degree in Physics from the University of Ibadan, equipping him to simplify complex data for a wide audience. Follow his work or connect on LinkedIn or X.