Here is why Solana's price might remain range-bound | Credit: Hameem Sarwar
Share
Key Takeaways
On the 4-hour chart, SOL has successfully broken out of a small descending channel.
However, the Supertrend line is around $94, suggesting SOL faces key resistance.
A breakout above $95 targets $110, but failure to break resistance could drive consolidation.
Solana (SOL) has been one of the most-watched assets in the crypto market this cycle. But the altcoin’s inability to breach $90 is raising fresh questions about where Solana’s price goes from here.
After a rejection near that key price zone, SOL appears to be stabilizing.
However, this does not imply that the altcoin will break out soon. In this a
Why $90 Is a Critical Level for Solana
The $90 region is not just a round number. It represents a historically significant resistance zone where previous rallies have stalled and where a large concentration of unfilled sell orders and underwater positions converge.
For SOL to mount a sustainable recovery, it must do more than briefly touch $90; it needs to break above it convincingly with strong volume and hold that level as new support.
So far, the market has not cooperated.
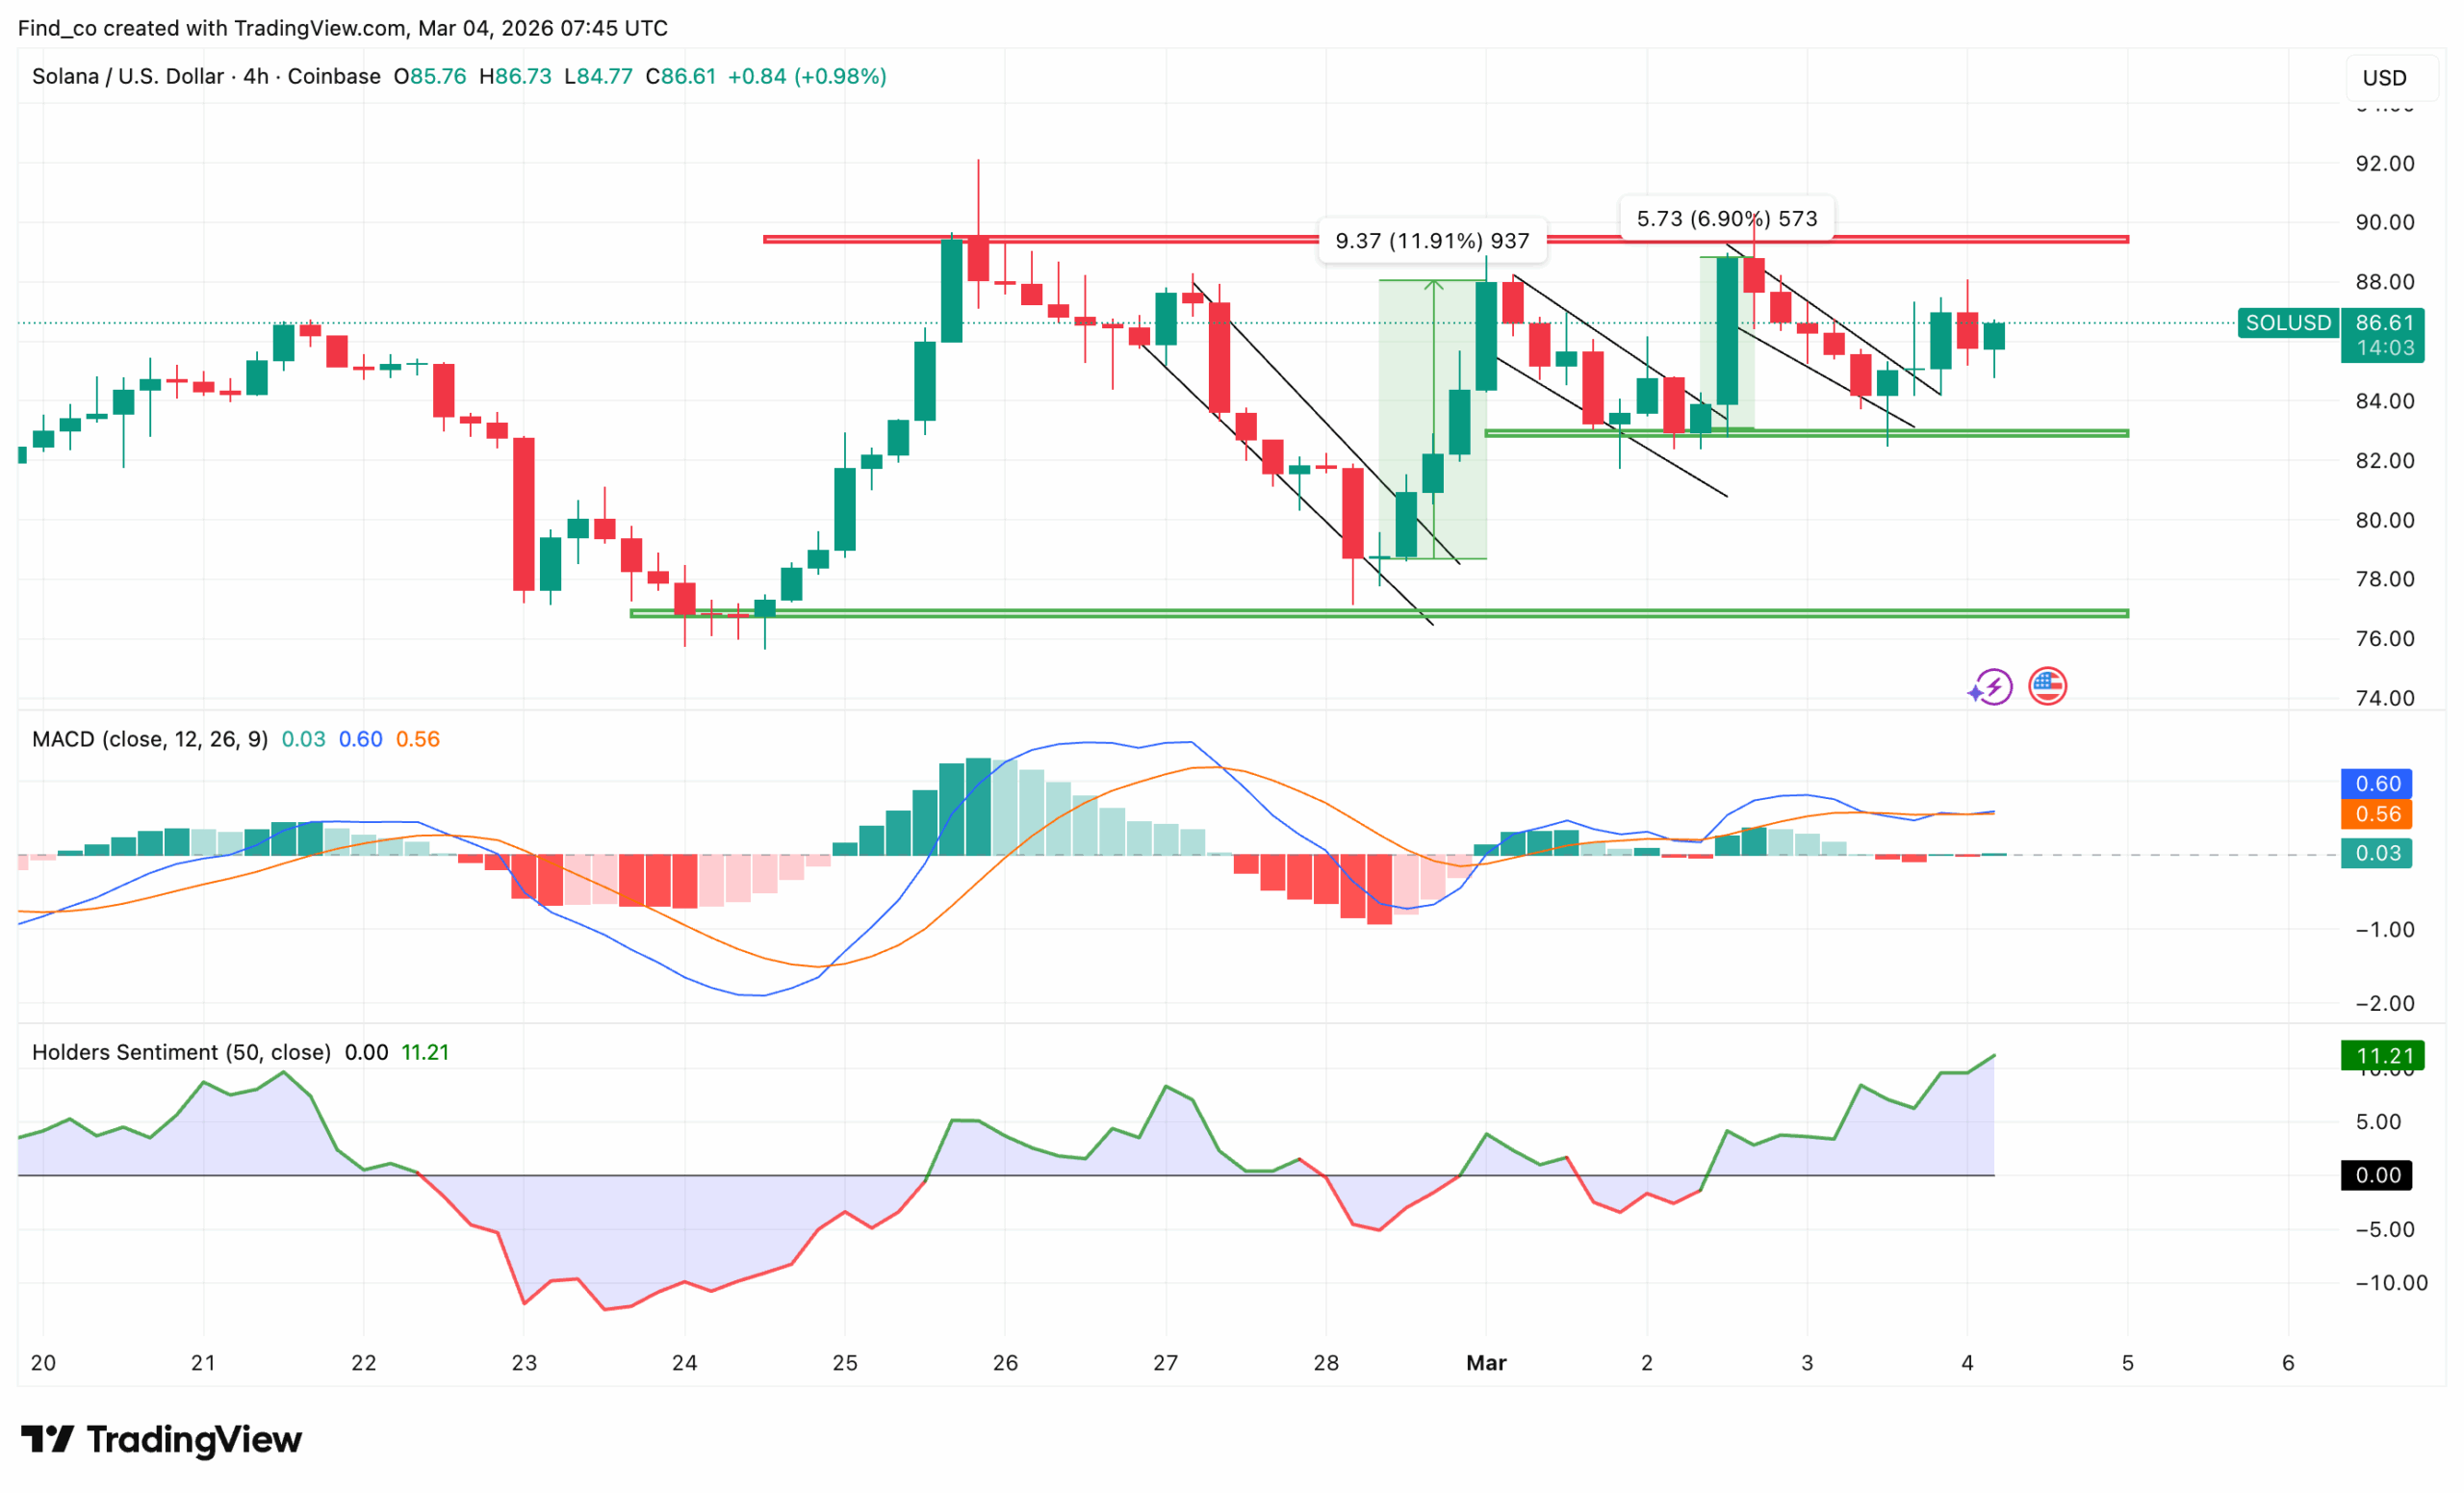
On the 4-hour chart, Solana’s price is approaching a key resistance zone after recovering from the recent pullback.
As shown below, SOL is currently trading around $87 and pushing back toward the major resistance band near $90.
Looking closely, the small descending channel that formed after the previous rejection has already broken to the upside. This indicates that momentum could be shifting back to the bulls.
If SOL can close above $90, it would invalidate the current range
Furthermore, the MACD is holding above the signal line and flattening near positive territory, while holders’ sentiment has turned positive again, indicating improving market participation.
As long as Solana’s price holds the $83 support area on pullbacks, the structure favors another attempt at breaking the $90 resistance.
However, repeated rejection from that level could keep SOL trapped in the current consolidation range a bit longer.
3 Scenarios Holders Should Prepare For
Scenario 1 (Bullish Breakout): If Bitcoin stabilizes and overall market sentiment improves, SOL’s price could attempt to breach $90 again. A confirmed daily close above $92 to $95 would represent a significant breakthrough, opening the door toward $110.
Scenario 2 (Range-Bound Consolidation): The more immediately likely outcome is that SOL enters a period of sideways trading between $75 and $90. Consolidation after a rejection is not inherently bearish. However, it can lay the groundwork for a stronger breakout attempt.
Scenario 3 (Deeper Correction): If broader crypto markets deteriorate or Bitcoin’s price breaks key support levels, Solana’s price could pull back toward the $70 support zone. However, a break below $65 would meaningfully change the near-term technical picture.
SOL Price Outlook: Trend Uncertain
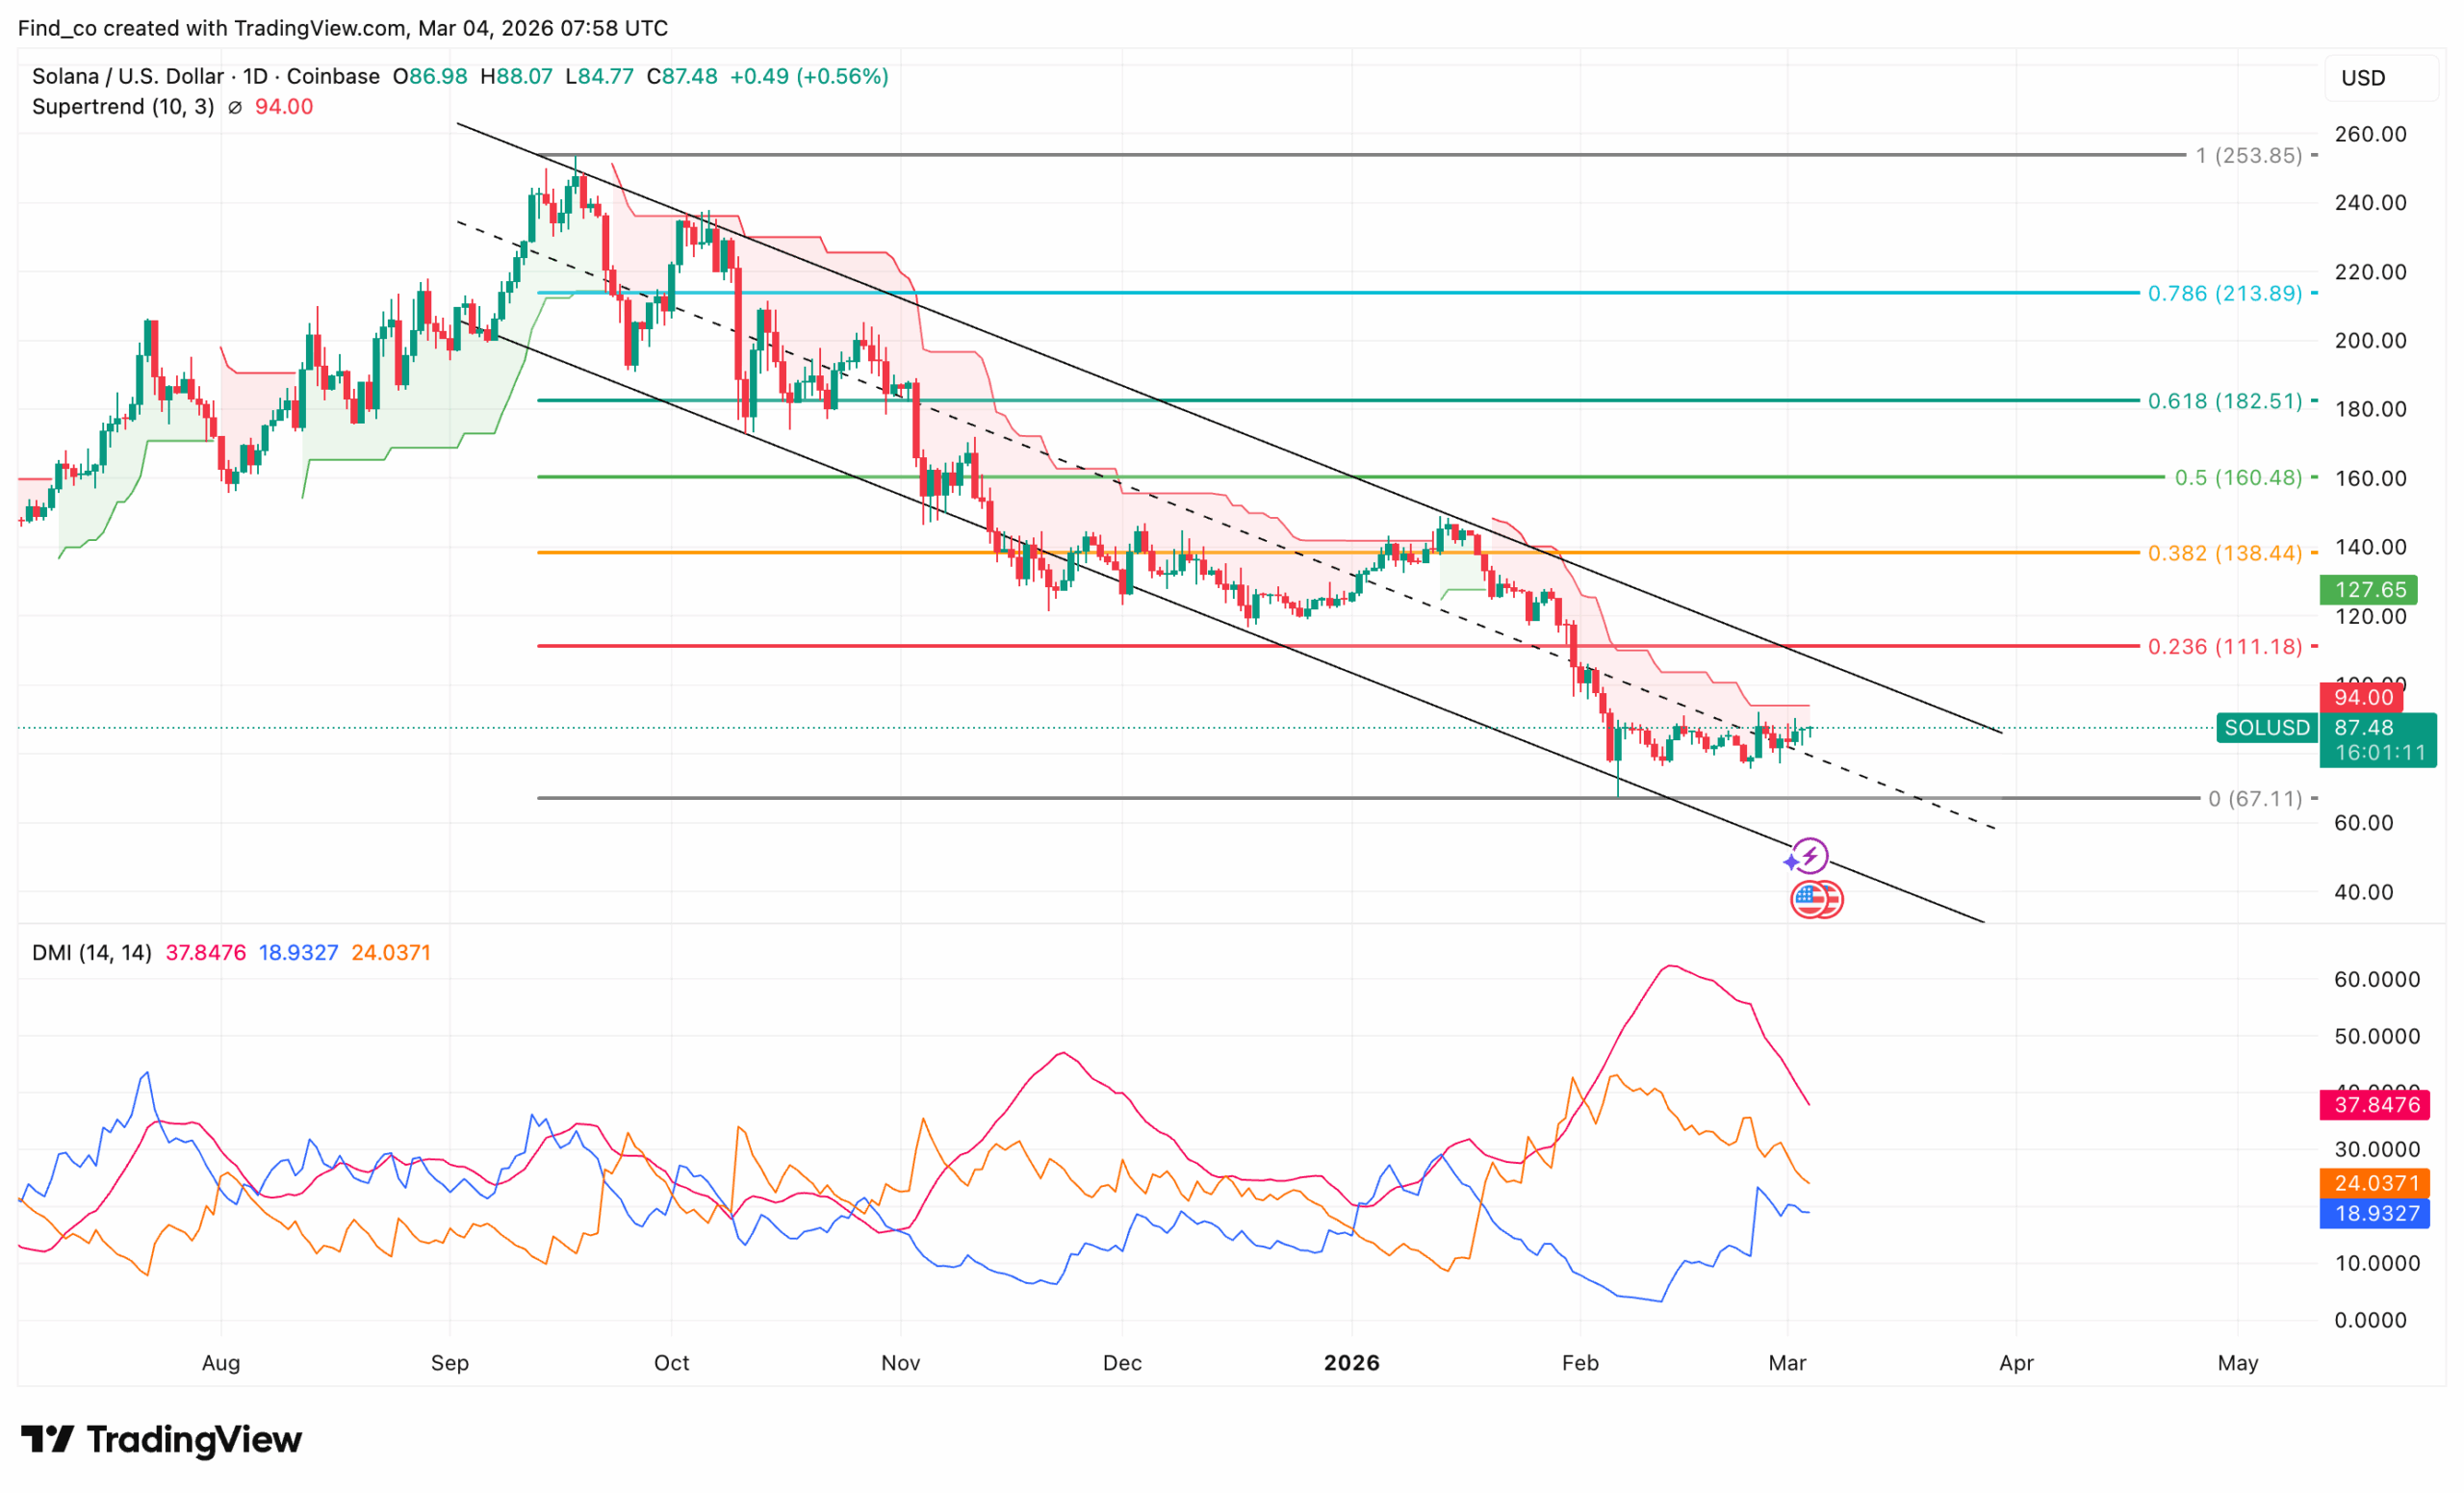
On the daily timeframe, Solana’s price remains in a broader downtrend despite the recent short-term recovery.
From the image below, each rally has continued to form lower highs, which keeps the overall structure bearish for now.
The current bounce is occurring near the lower half of that channel after SOL’s price recently swept the major support around $67.
The most important resistance sits around $94, which aligns with the Supertrend level and the upper boundary of the recent consolidation.
A daily close above this level would be the first signal that the trend may be shifting, as it would break the sequence of lower highs and push the price toward the next Fibonacci resistance near $111.18
If Solana’s price fails to reclaim $94, the market may remain stuck in a range between roughly $67.11 and $94.
In addition, the Directional Movement Index (DMI) shows the trend strength beginning to cool, suggesting the selling pressure that drove the previous leg down is weakening.
However, if buying pressure increases, this outlook could change. In that scenario, Solana’s price might breach the upper trendline of the descending parallel channel.
If that were to happen, SOL could breach $111.18. In a highly bullish scenario, it could rally to $138.44.
Disclaimer:
The information provided in this article is for informational purposes only. It is not intended to be, nor should it be construed as, financial advice. We do not make any warranties regarding the completeness, reliability, or accuracy of this information. All investments involve risk, and past performance does not guarantee future results. We recommend consulting a financial advisor before making any investment decisions.
Victor Olanrewaju is a crypto analyst and reporter at CCN with deep roots in on-chain research and technical analysis. His crypto journey began in 2017, but it was the 2020 Uniswap airdrop that sparked a full-time pivot into the space.
With a foundation in copywriting, Victor honed his craft creating high-converting content for leading crypto brokers — most notably an XRP price prediction that ranked #1 on Google during the 2021 bull run.
He later joined AMBCrypto in 2022, where he combined storytelling with technical and on-chain analysis to cover key market narratives.
In 2024, he expanded his expertise at BeInCrypto, collaborating with analysts and using tools like Glassnode, Santiment, and IntoTheBlock to break down Bitcoin and altcoin trends.
At CCN, Victor covers the top cryptocurrencies, memecoins, macro shifts, blending real-time insights with deep-dive metrics.
He holds a Bachelor’s degree in Physics from the University of Ibadan, equipping him to simplify complex data for a wide audience. Follow his work or connect on LinkedIn or X.