Is a Solana breakdown imminent? | Credit: Hameem Sarwar
Share
Key Takeaways
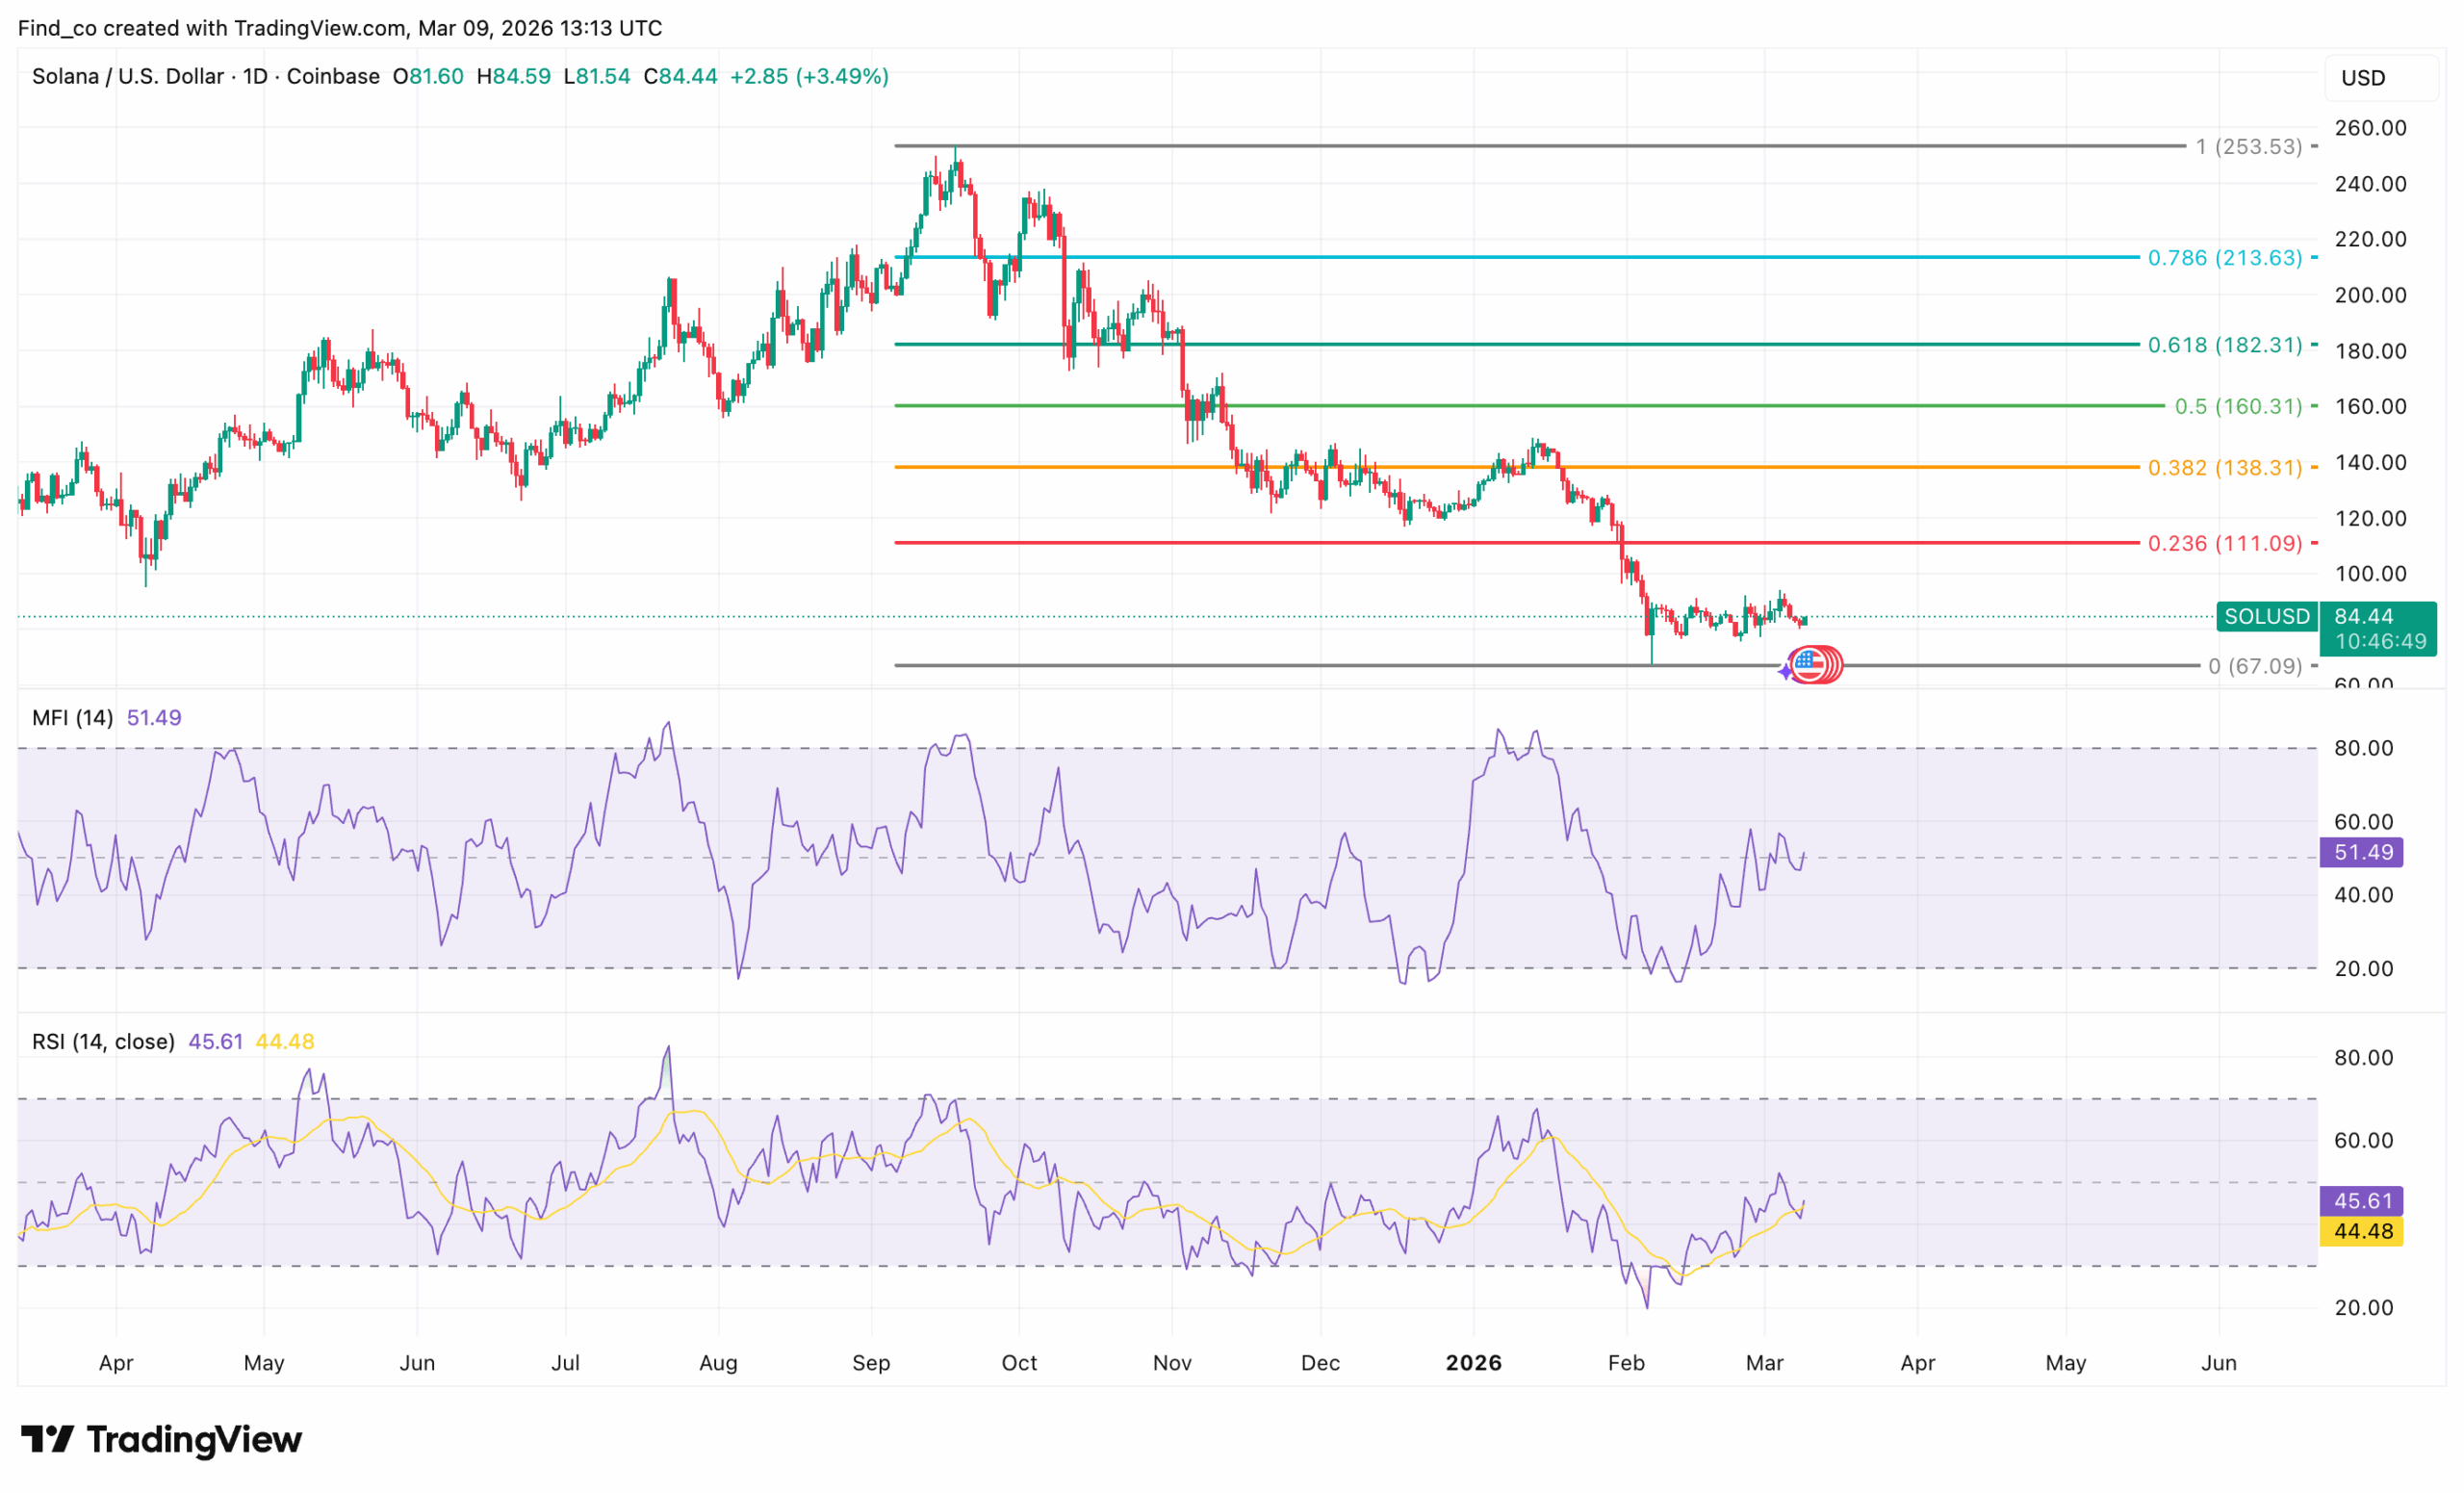
Solana remains trapped below the $100 psychological level, with price consolidating between roughly $70 support and $94.
Daily lower highs and lower lows, combined with liquidation imbalances, confirm that sellers remain in control of the trend.
The 0.236 Fib near $111 is the resistance, while the support near $66 could come into play if SOL fails to reclaim $100.
Solana (SOL) is fighting to avoid another major breakdown. Although the token has stabilized after February’s sharp selloff, it still trades well below $100.
Meanwhile, market pressure continues to build as momentum indicators remain weak. Now, a single support zone may decide whether SOL stabilizes or crashes toward $60.
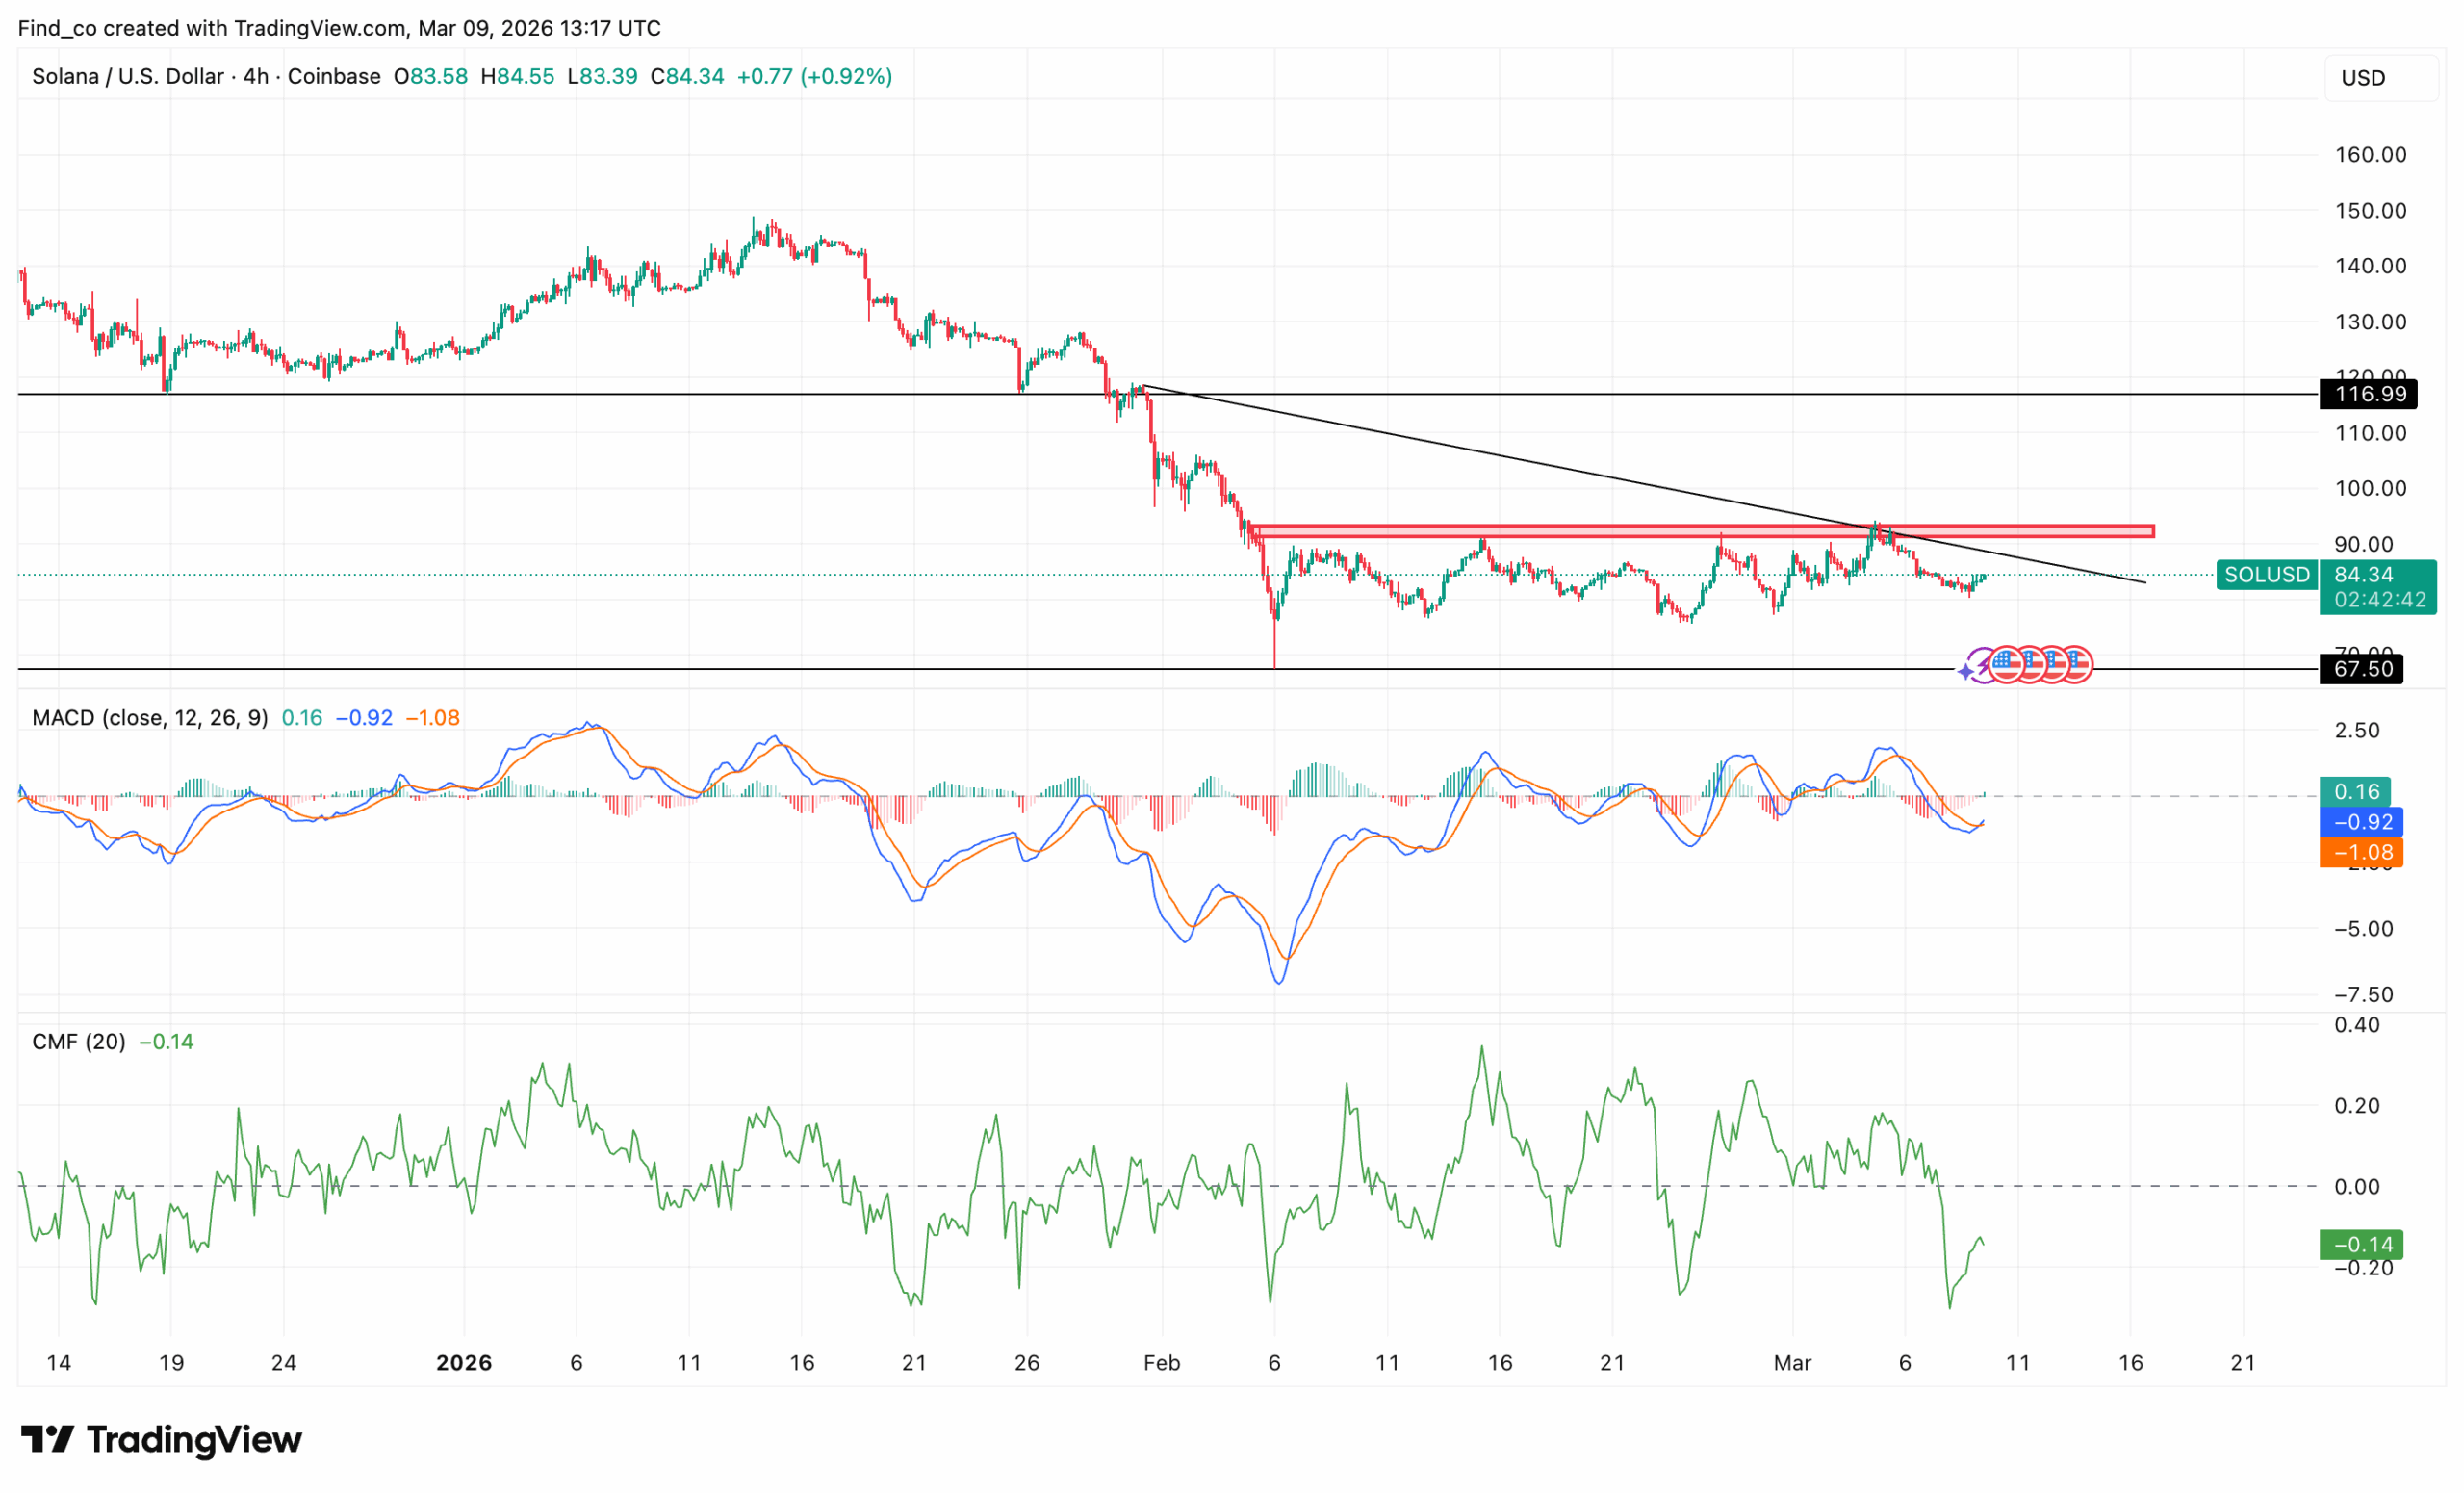
SOL Consolidates Below $100
On the 4-hour chart, the sharp downtrend that dominated early February has gradually shifted into a wide consolidation phase.
Even so, momentum remains fragile, suggesting buyers have not yet regained full control of the market.
Earlier in February, SOL plunged before finding strong support near the $69-$70 zone. Buyers quickly stepped in at that level, triggering a sharp rebound and preventing a deeper capitulation.
Since then, the asset has largely moved sideways, oscillating between roughly $70 support and $94 resistance. This behavior has formed a clear horizontal trading range, with traders repeatedly rejecting moves at both extremes.
Within this structure, the mid-range area around $83-$86 has become an important pivot. Recently, SOL slipped to the lower end of its range before rebounding to about $83.80.
The bounce suggests buyers are still defending this region, at least in the near term. However, the broader structure continues to favor consolidation until a decisive breakout shifts momentum.
Technical indicators reflect this fragile balance. The Moving Average Convergence Divergence (MACD) is flattening after an extended bearish phase.
Its histogram now prints smaller red bars, signaling that downside momentum is gradually fading.
At the same time, the MACD and signal lines are converging, suggesting a bullish crossover could occur if buying pressure persists.
Meanwhile, the Chaikin Money Flow (CMF) remains slightly negative at around -0.12, suggesting that capital inflows remain weak.
Nevertheless, the indicator has started to turn upward after dipping deeper into negative territory, which could point to early accumulation returning to the market.
If buying pressure increases, Solana’s price could retest its major resistance zone at $111.42.
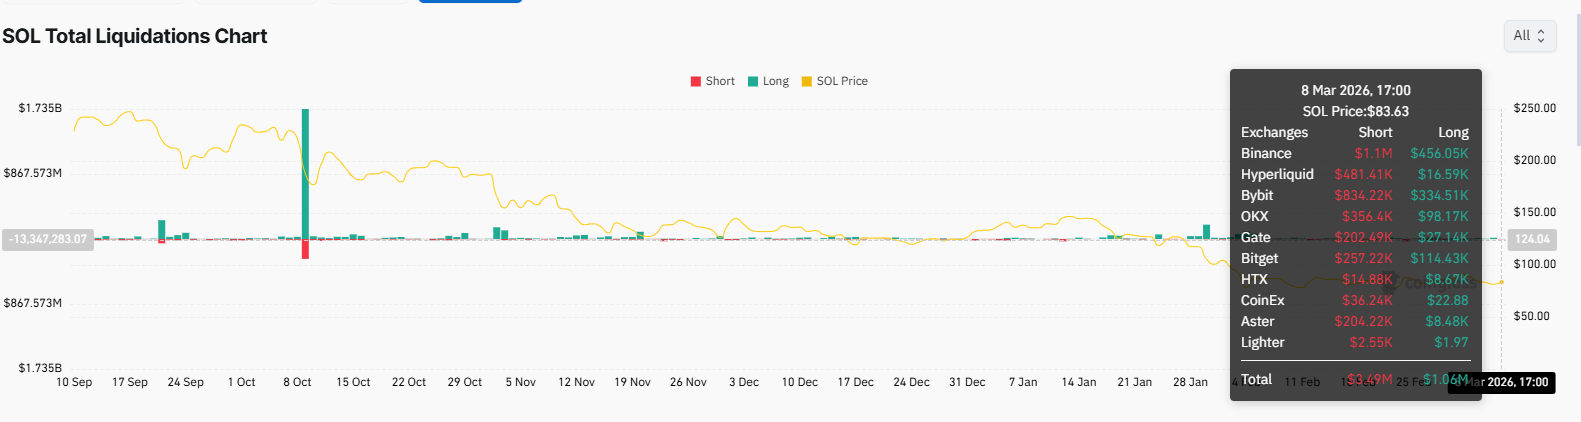
Liquidations Signal Market Pressure
Despite these early stabilization signals, the broader picture remains cautious. Liquidation data shows continued pressure on leveraged traders as SOL’s price hovers near $83.
On March 8, short liquidations totaled about $3.49 million, while long liquidations reached $1.06 million.
This imbalance suggests bearish positioning remains dominant, reinforcing the broader downtrend and increasing the risk of further volatility ahead.
On the daily chart, SOL continues to trade below the $100 psychological level while following a descending trendline that has guided the decline since the asset peaked near $255.
The sequence of lower highs and lower lows confirms that sellers still dominate the larger trend.
Furthermore, the 0.236 Fibonacci level near $111 has already flipped into resistance, reinforcing the bearish structure. Until this zone is reclaimed, any recovery attempt is likely to face strong selling pressure.
Momentum indicators on the daily timeframe also show only modest improvement. The Relative Strength Index (RSI) hovers around 45, reflecting neutral momentum after rebounding from oversold conditions.
Meanwhile, the Money Flow Index sits slightly above the midpoint, suggesting mild capital inflows are beginning to return.
However, the most critical support lies below the current price. The strongest defensive zone appears near $66, which aligns with the base Fibonacci level and a previous liquidity pocket.
Disclaimer:
The information provided in this article is for informational purposes only. It is not intended to be, nor should it be construed as, financial advice. We do not make any warranties regarding the completeness, reliability, or accuracy of this information. All investments involve risk, and past performance does not guarantee future results. We recommend consulting a financial advisor before making any investment decisions.
Victor Olanrewaju is a crypto analyst and reporter at CCN with deep roots in on-chain research and technical analysis. His crypto journey began in 2017, but it was the 2020 Uniswap airdrop that sparked a full-time pivot into the space.
With a foundation in copywriting, Victor honed his craft creating high-converting content for leading crypto brokers — most notably an XRP price prediction that ranked #1 on Google during the 2021 bull run.
He later joined AMBCrypto in 2022, where he combined storytelling with technical and on-chain analysis to cover key market narratives.
In 2024, he expanded his expertise at BeInCrypto, collaborating with analysts and using tools like Glassnode, Santiment, and IntoTheBlock to break down Bitcoin and altcoin trends.
At CCN, Victor covers the top cryptocurrencies, memecoins, macro shifts, blending real-time insights with deep-dive metrics.
He holds a Bachelor’s degree in Physics from the University of Ibadan, equipping him to simplify complex data for a wide audience. Follow his work or connect on LinkedIn or X.