SOL holds above $100, but bearish pressure remains present.
The BBP prints red bars, confirming persistent seller control.
Buying volume remains insufficient for a meaningful reversal
Solana (SOL) narrowly avoided crashing below the crucial $100 mark. However, the cryptocurrency’s short-term outlook remains uncertain.
As highlighted in a recentCCN analysis, SOL is facing mounting selling pressure, raising concerns of a deeper correction.
While the altcoin has shown signs of resilience, indicators suggest that this stability is delicate.
Is another Solana price crash imminent? Let’s check the charts
Solana’s Recovery Remains Rocky
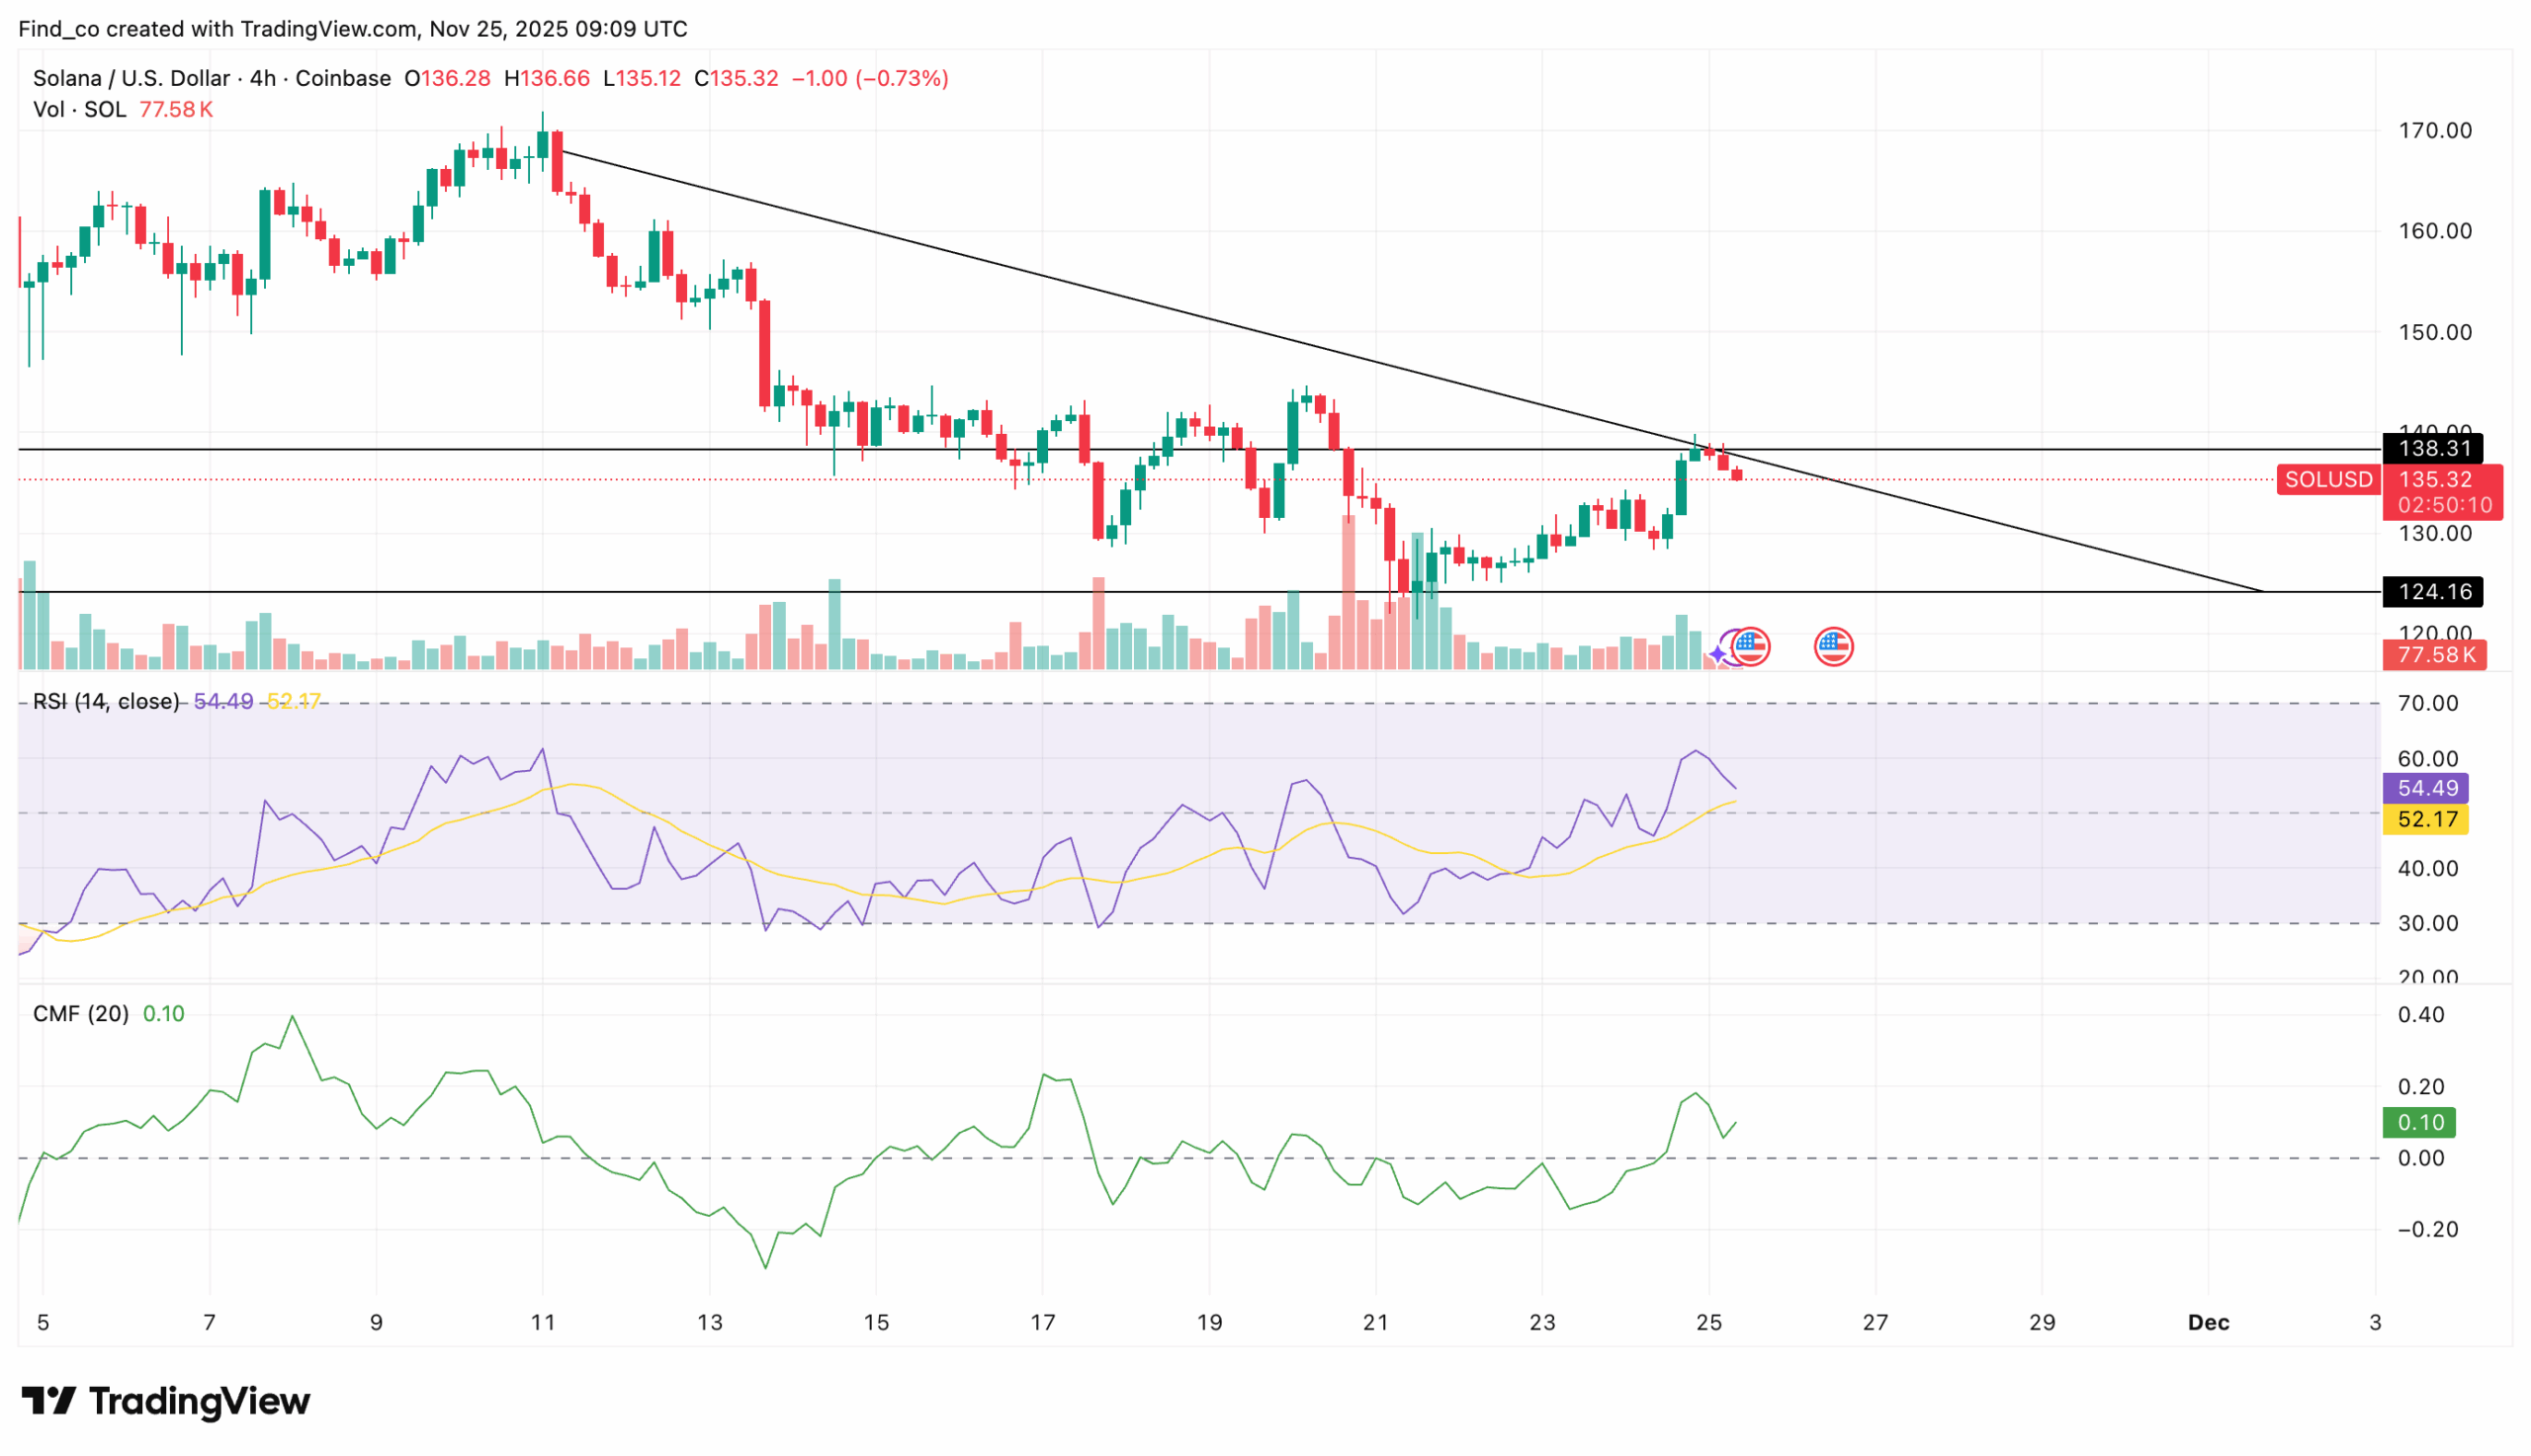
On the 4-hour chart, the Relative Strength Index (RSI) signals a modest bullish bias.
The indicator sits at 54.49, slightly above the neutral midpoint of 50.
This reading shows that momentum is positive but not strong enough to confirm a sustained upward trend.
Get These Top Crypto Casino Offers Now!
Sponsored
Disclosure
We sometimes use affiliate links in our content, when clicking on those we might receive a commission at no extra cost to you. By using this website you agree to our terms and conditions and privacy policy.
Meanwhile, the Chaikin Money Flow (CMF) points to mild accumulation. With a current reading of 0.10, the indicator suggests that buying pressure is present, with capital entering the asset at a limited pace.
These short-term indicators reveal a delicate balance. The combination of a slightly bullish RSI and a modestly positive CMF suggests a market that could shift in either direction.
If buying momentum fails to strengthen, the $124.16.02 support could face additional pressure, making it challenging for Solana to trade higher.
SOL Price Outlook: Weak Trend
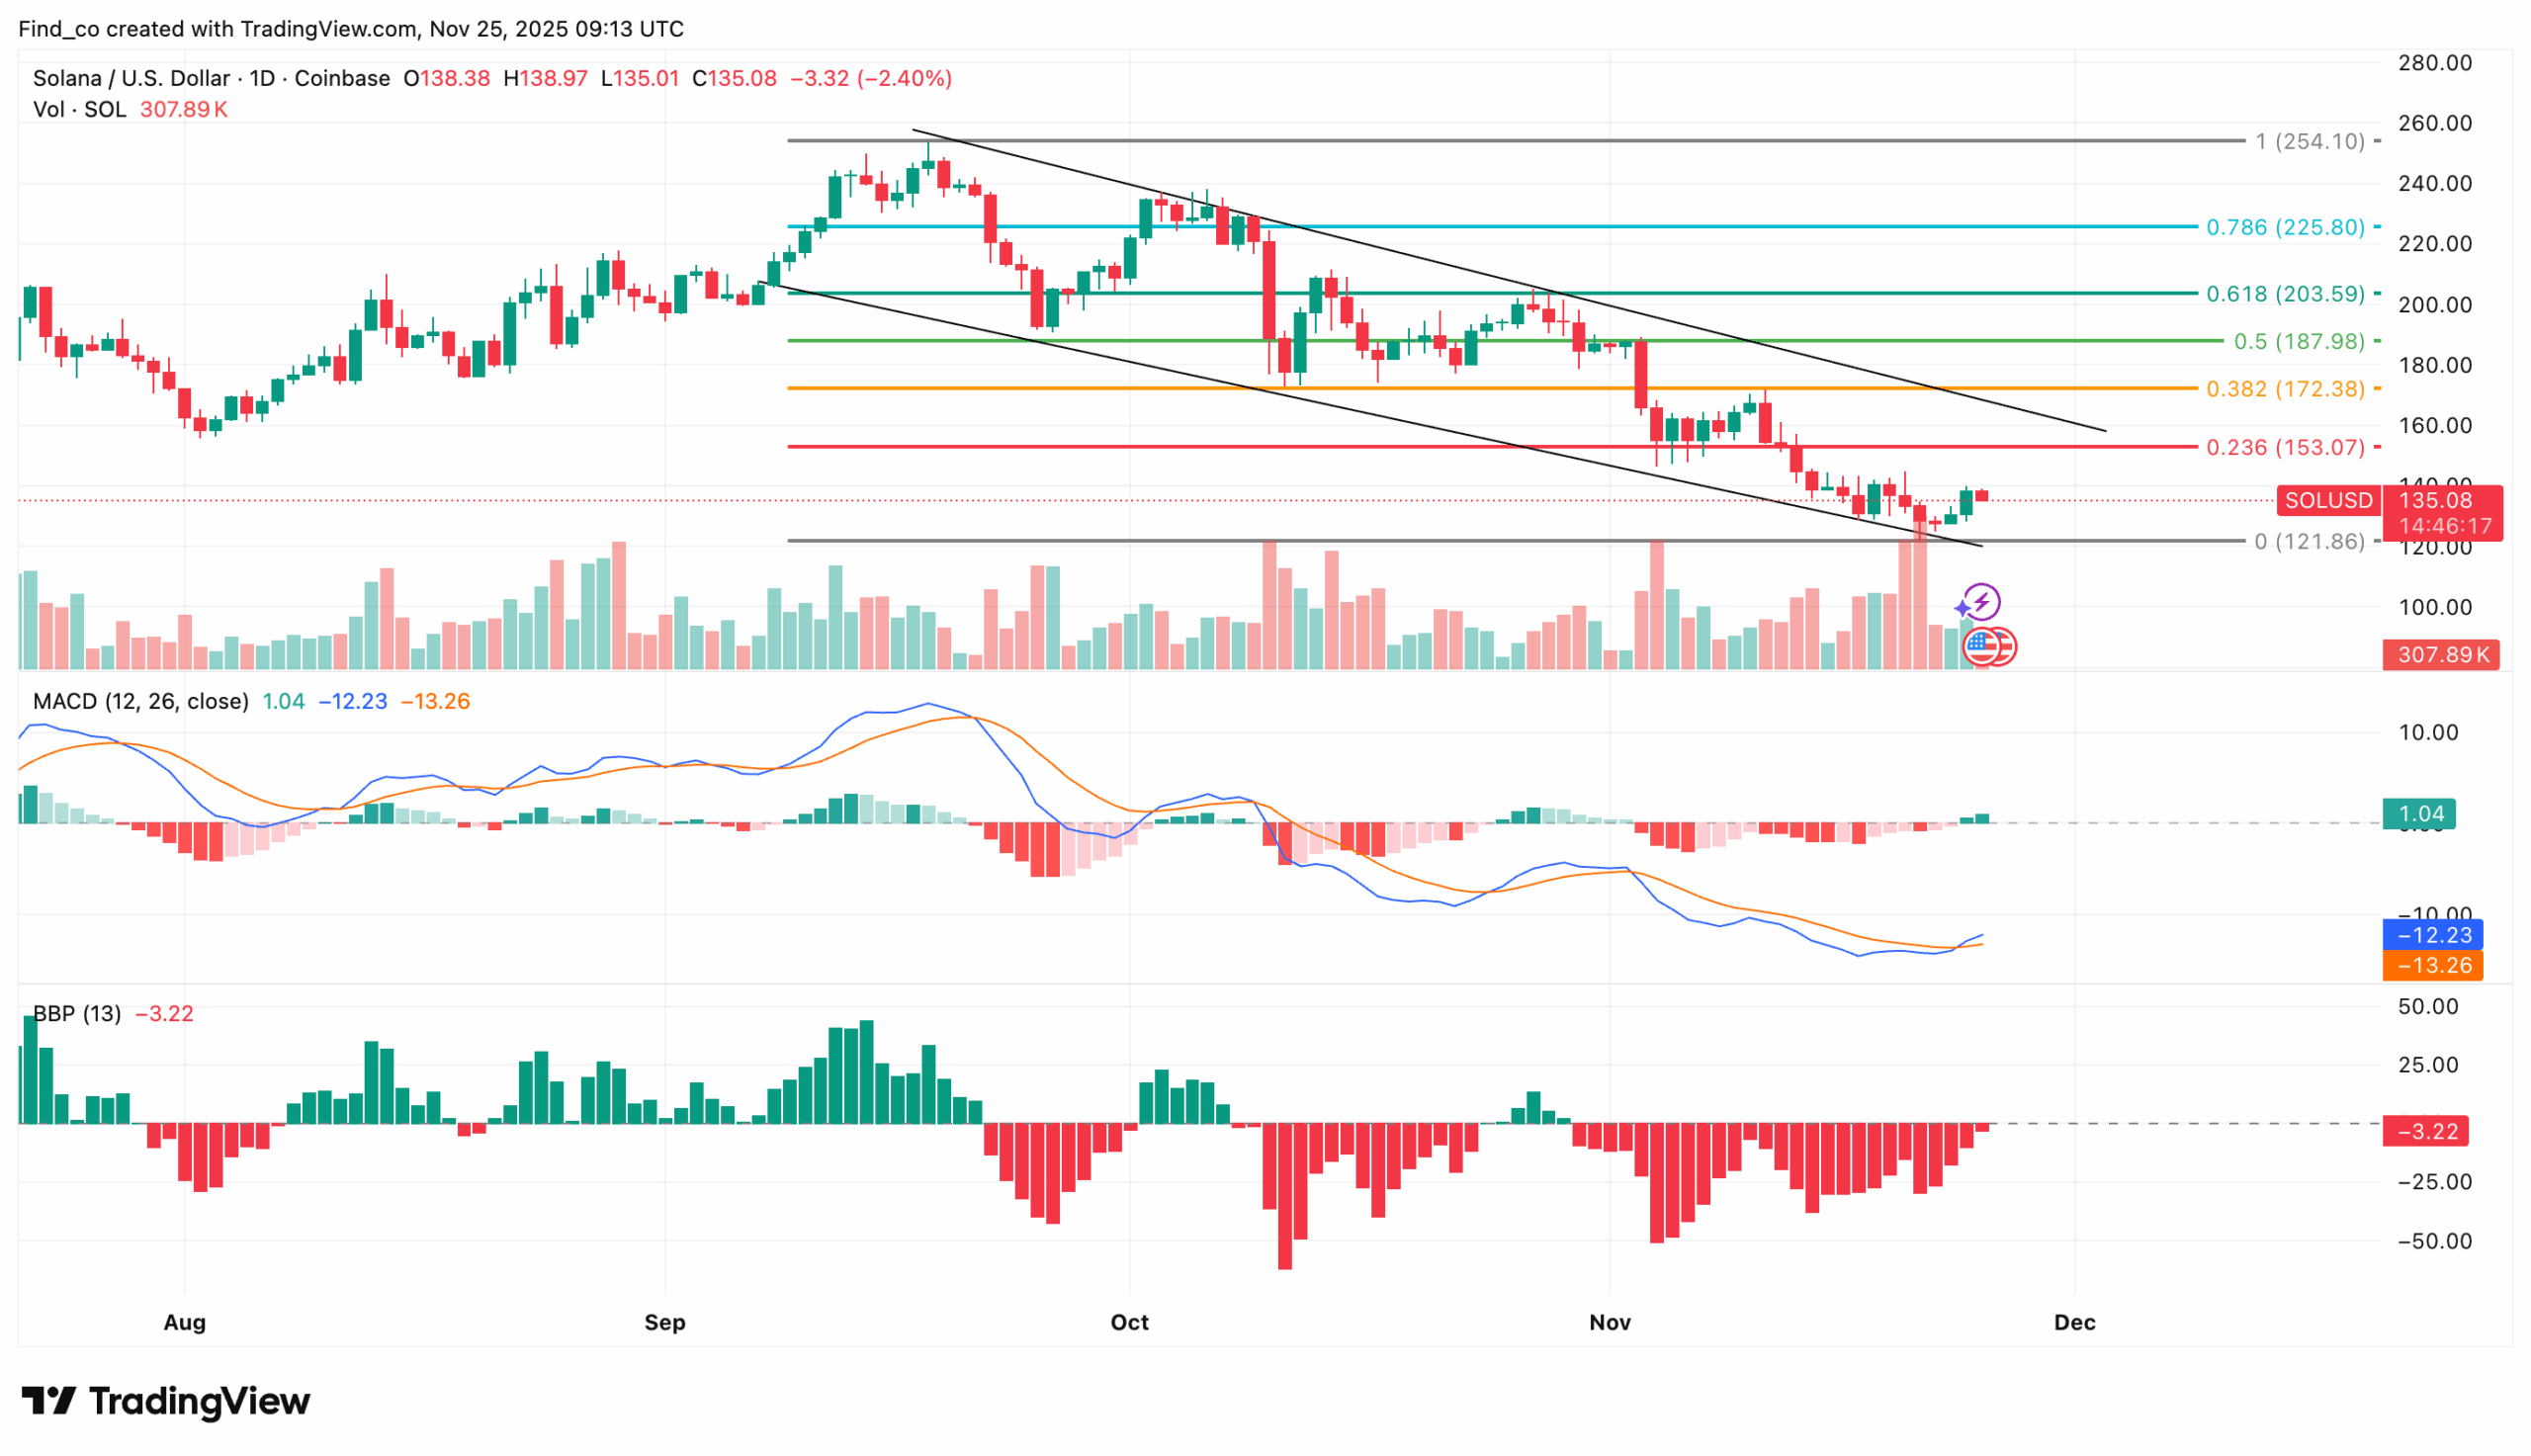
The daily chart indicates that SOL is struggling to maintain its position at $136.86 as sellers continue to push the price downward.
A look at the Moving Average Convergence Divergence (MACD) shows it has flipped into positive territory.
Yet the histogram bars keep declining. This pattern shows that bullish momentum remains fragile and unconvincing.
Adding to the pressure, the Bull Bear Power (BBP) indicator continues to print red histogram bars.
This trend suggests that sellers continue to dominate, despite buyers’ attempts to stabilize the market. The weakening demand, combined with persistent red bars, reinforces the ongoing downward pressure.
If this indicator continues on its current course, SOL’s price may face an extended test of lower support zones, as bullish efforts remain too weak to counter prevailing sentiment.
The Fibonacci retracement levels offer a clearer view of potential price direction.
At the time of writing, the cryptocurrency appears to be heading toward the 0 Fib level at $121.86, a zone that often acts as a final defense before deeper corrections emerge.
With SOL gradually losing altitude, this level is becoming less hypothetical and more likely to be tested. If sellers retain control, price action could drift toward this region as the next logical point for a reaction.
However, if buyers return with meaningful volume before Solana’s price touches this threshold, the asset could stage a short-term rebound toward the 0.382 Fib level at $172.38, interrupting the current downward trajectory.
Analyst Expects Recovery
Traders argue that if Solana’s price stabilizes within its current range, a recovery remains possible. Hardy, a pseudonymous crypto trader on X, shared this view, noting that the altcoin could be set for higher values.
“SOL has held this weekly support zone in the past; we should continue to hold it once again. It’s time for Solana to bounce from here. Higher!” The trader stated.
His confidence reflects broader market hopes that historical support will once again serve as a launchpad, rather than signaling a more profound decline.
However, optimism alone cannot shift the trend. SOL needs an apparent increase in buy-side liquidity to prove that this level is more than a temporary pause in a broader downtrend.
Disclaimer:
The information provided in this article is for informational purposes only. It is not intended to be, nor should it be construed as, financial advice. We do not make any warranties regarding the completeness, reliability, or accuracy of this information. All investments involve risk, and past performance does not guarantee future results. We recommend consulting a financial advisor before making any investment decisions.
Victor Olanrewaju is a crypto analyst and reporter at CCN with deep roots in on-chain research and technical analysis. His crypto journey began in 2017, but it was the 2020 Uniswap airdrop that sparked a full-time pivot into the space.
With a foundation in copywriting, Victor honed his craft creating high-converting content for leading crypto brokers — most notably an XRP price prediction that ranked #1 on Google during the 2021 bull run.
He later joined AMBCrypto in 2022, where he combined storytelling with technical and on-chain analysis to cover key market narratives.
In 2024, he expanded his expertise at BeInCrypto, collaborating with analysts and using tools like Glassnode, Santiment, and IntoTheBlock to break down Bitcoin and altcoin trends.
At CCN, Victor covers the top cryptocurrencies, memecoins, macro shifts, blending real-time insights with deep-dive metrics.
He holds a Bachelor’s degree in Physics from the University of Ibadan, equipping him to simplify complex data for a wide audience. Follow his work or connect on LinkedIn or X.