Solana’s daily revenue hit a 30-day low on March 4, as user and economic activity on the L1 fell.
The contraction in on-chain activity has kept SOL’s price range-bound since early February.
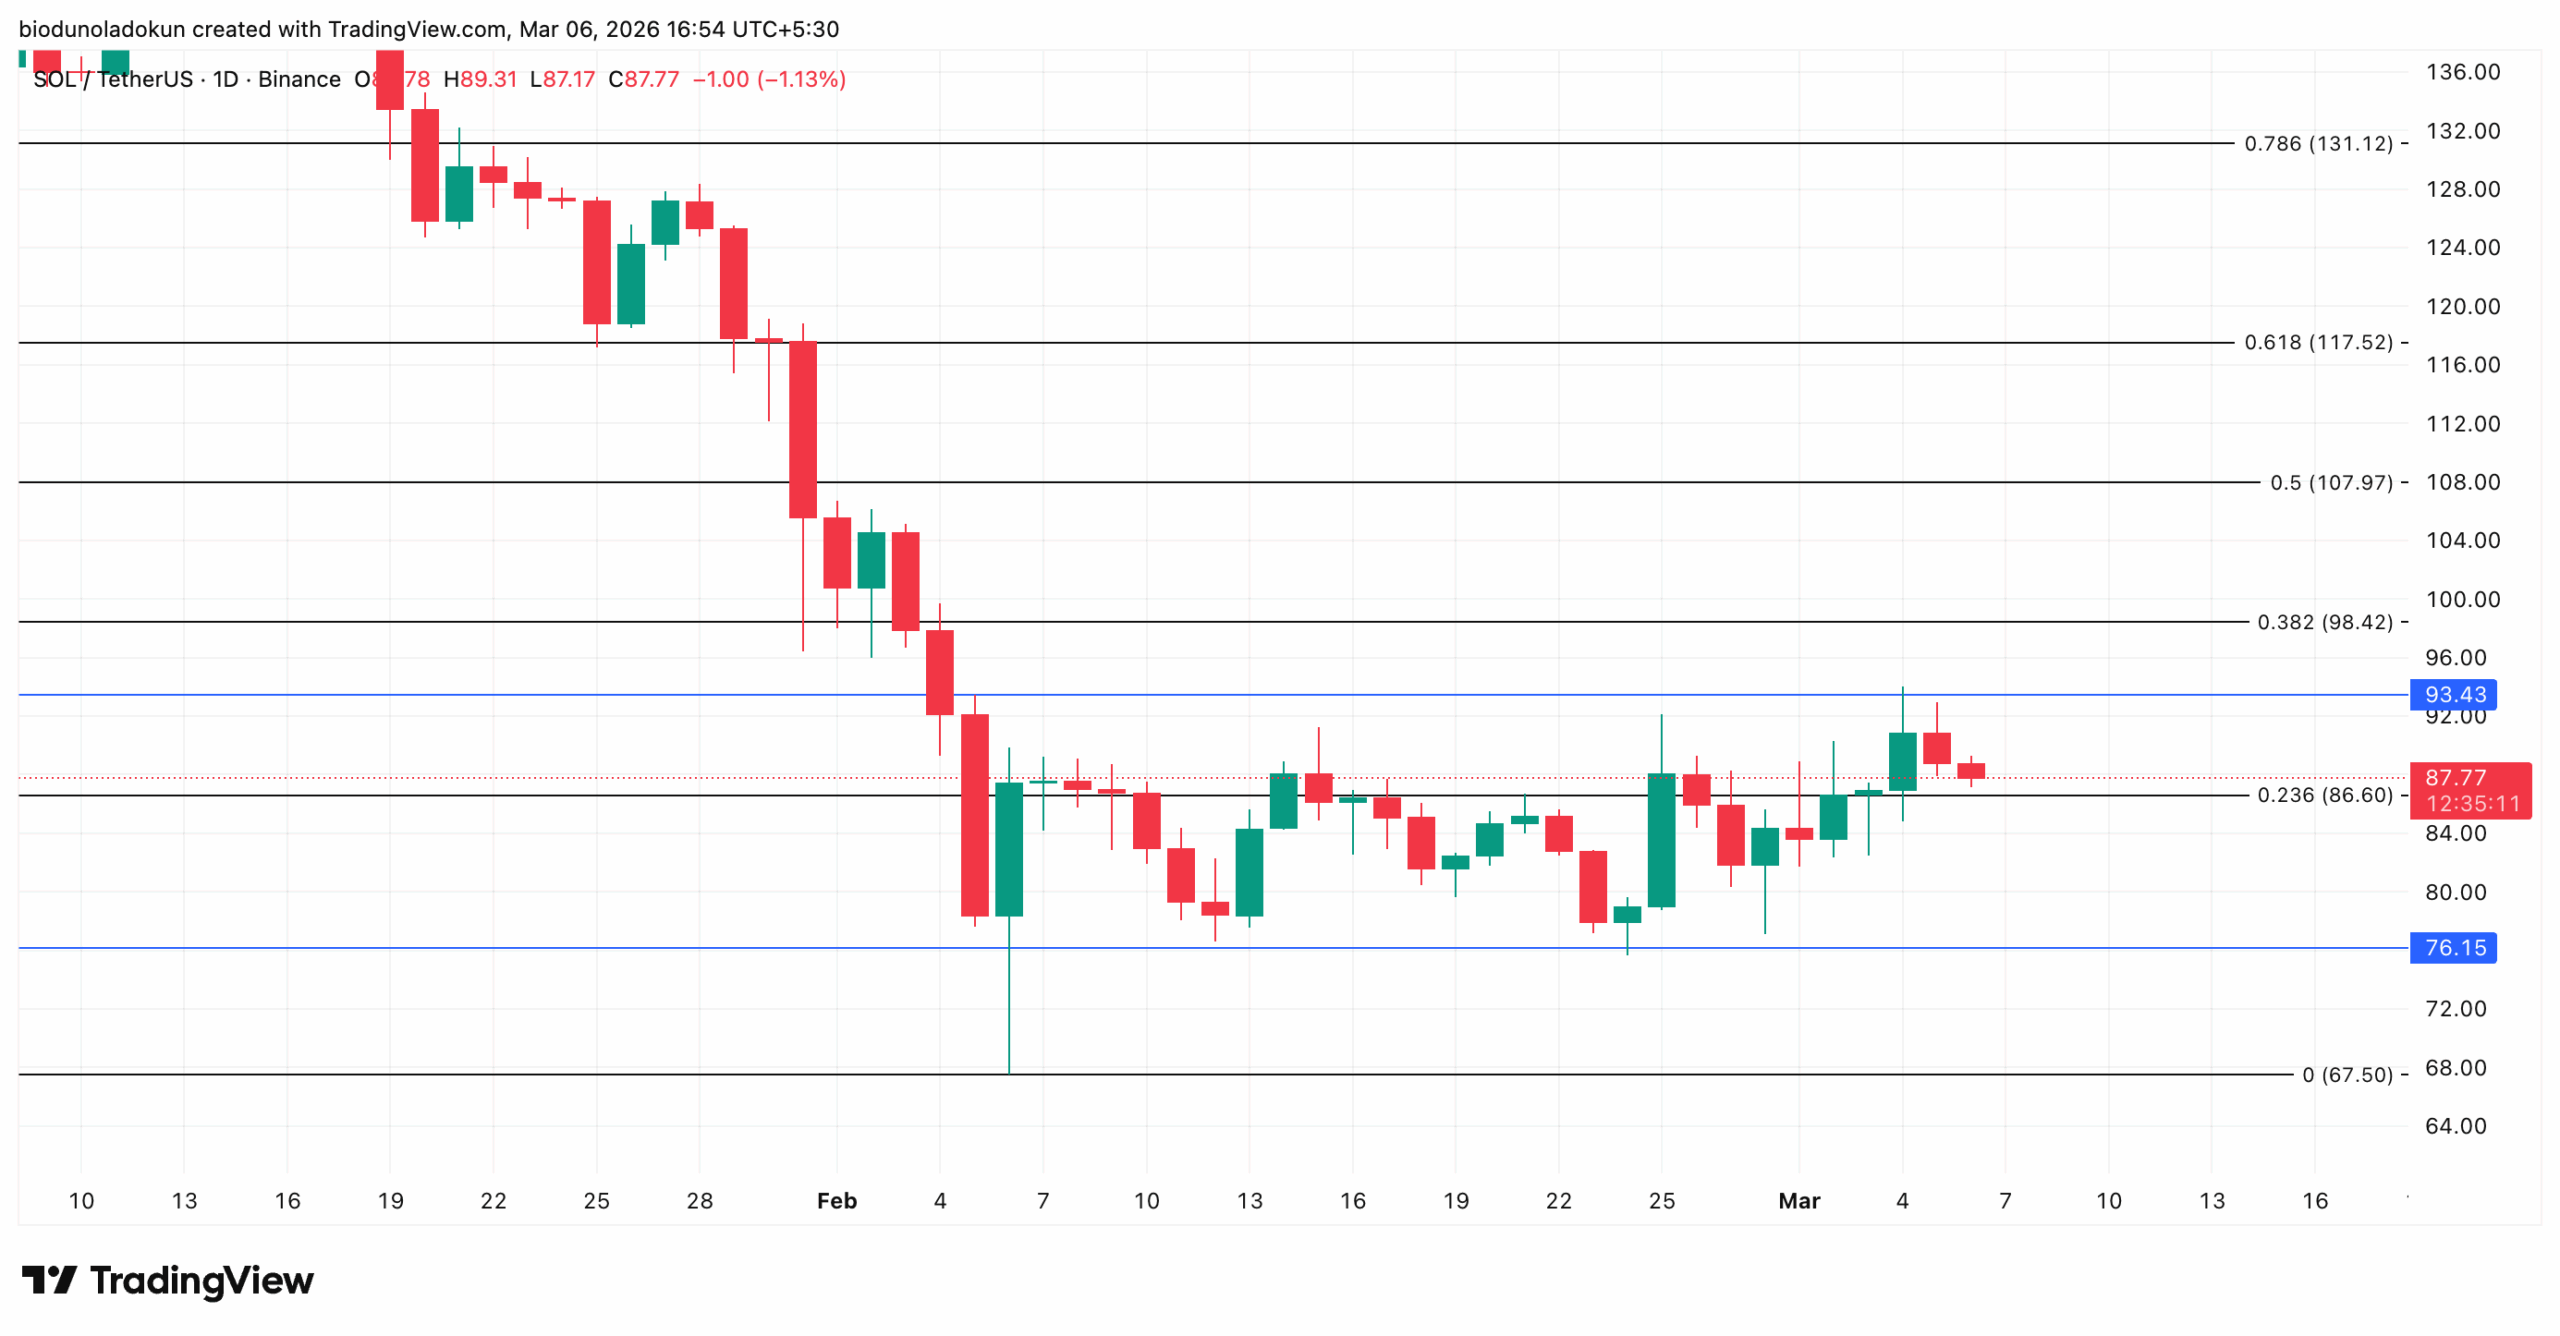
SOL faces a potential breakdown below the $76.15 support floor, which could push the price toward $67.50.
Solana’s network revenue has dropped to its lowest level in 30 days, according to on-chain data.
A review of the Layer-1 user activity shows a decline in both new active and returning users, signalling that demand on the network is weakening.
This weakening in network fundamentals could weigh on SOL’s market value, as it may dampen investor sentiment and reduce the demand that typically supports prices.
Solana’s On-Chain Activity Cools Sharply
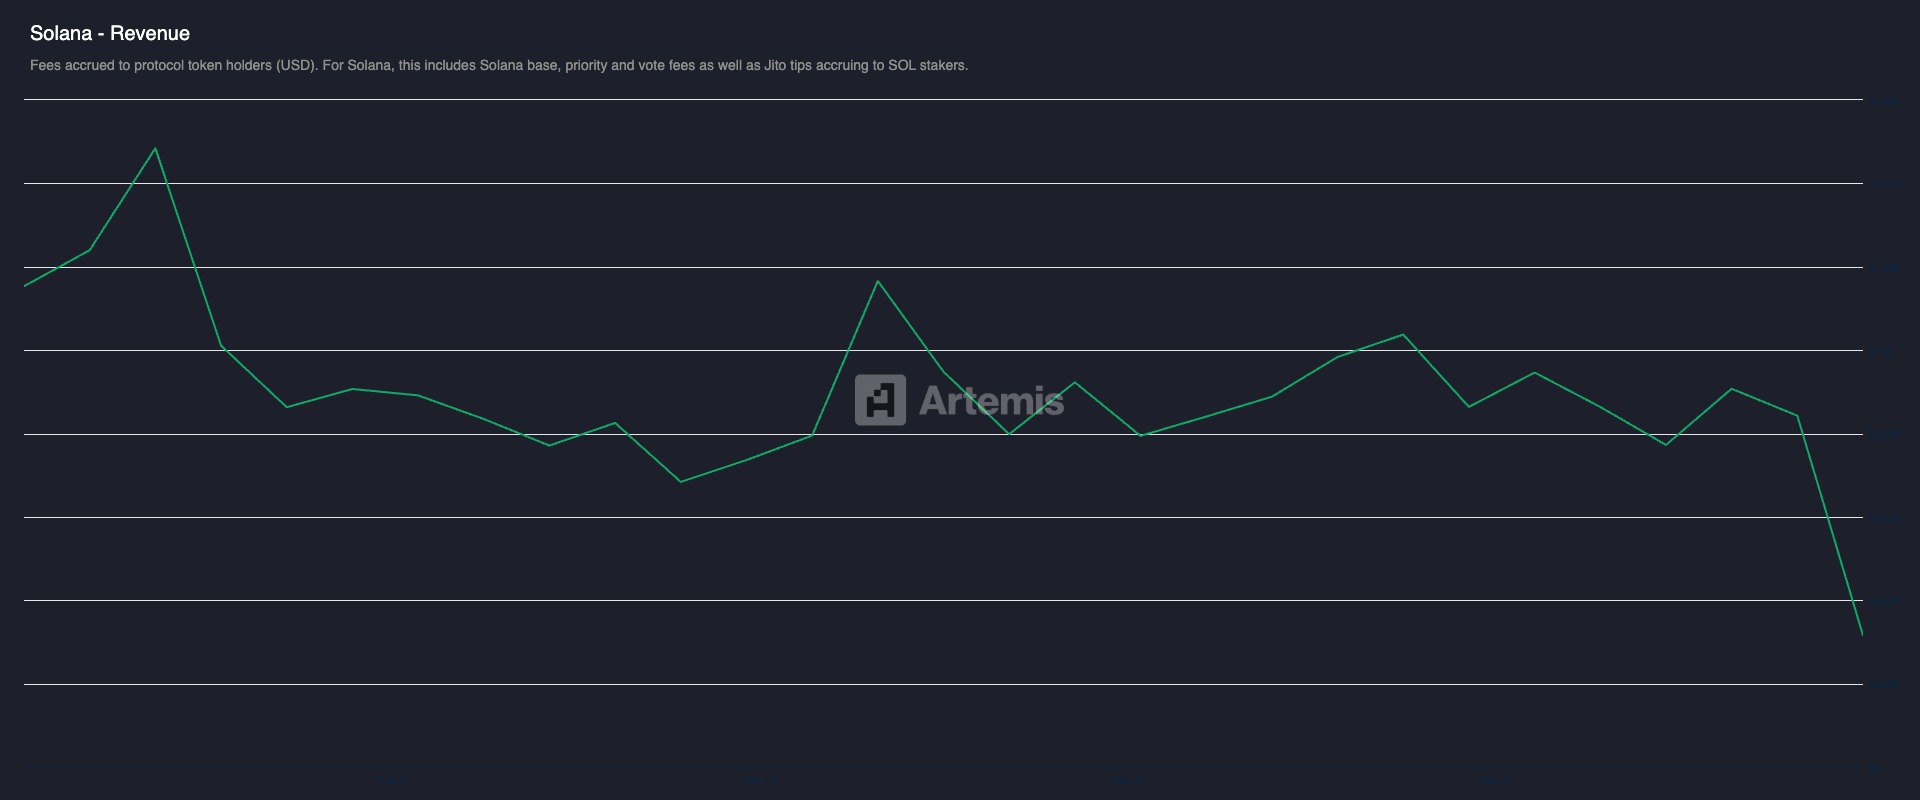
According to recent data from Artemis, Solana’s daily revenue plunged to a 30-day low on March 4.
On that day, the network’s revenue totaled $314,700, marking a 79% from the $1.5 million peak recorded in early February.
The sharp decline comes amid a broad cooldown in user activity on the layer-1 blockchain that has impacted the network’s primary source of income.
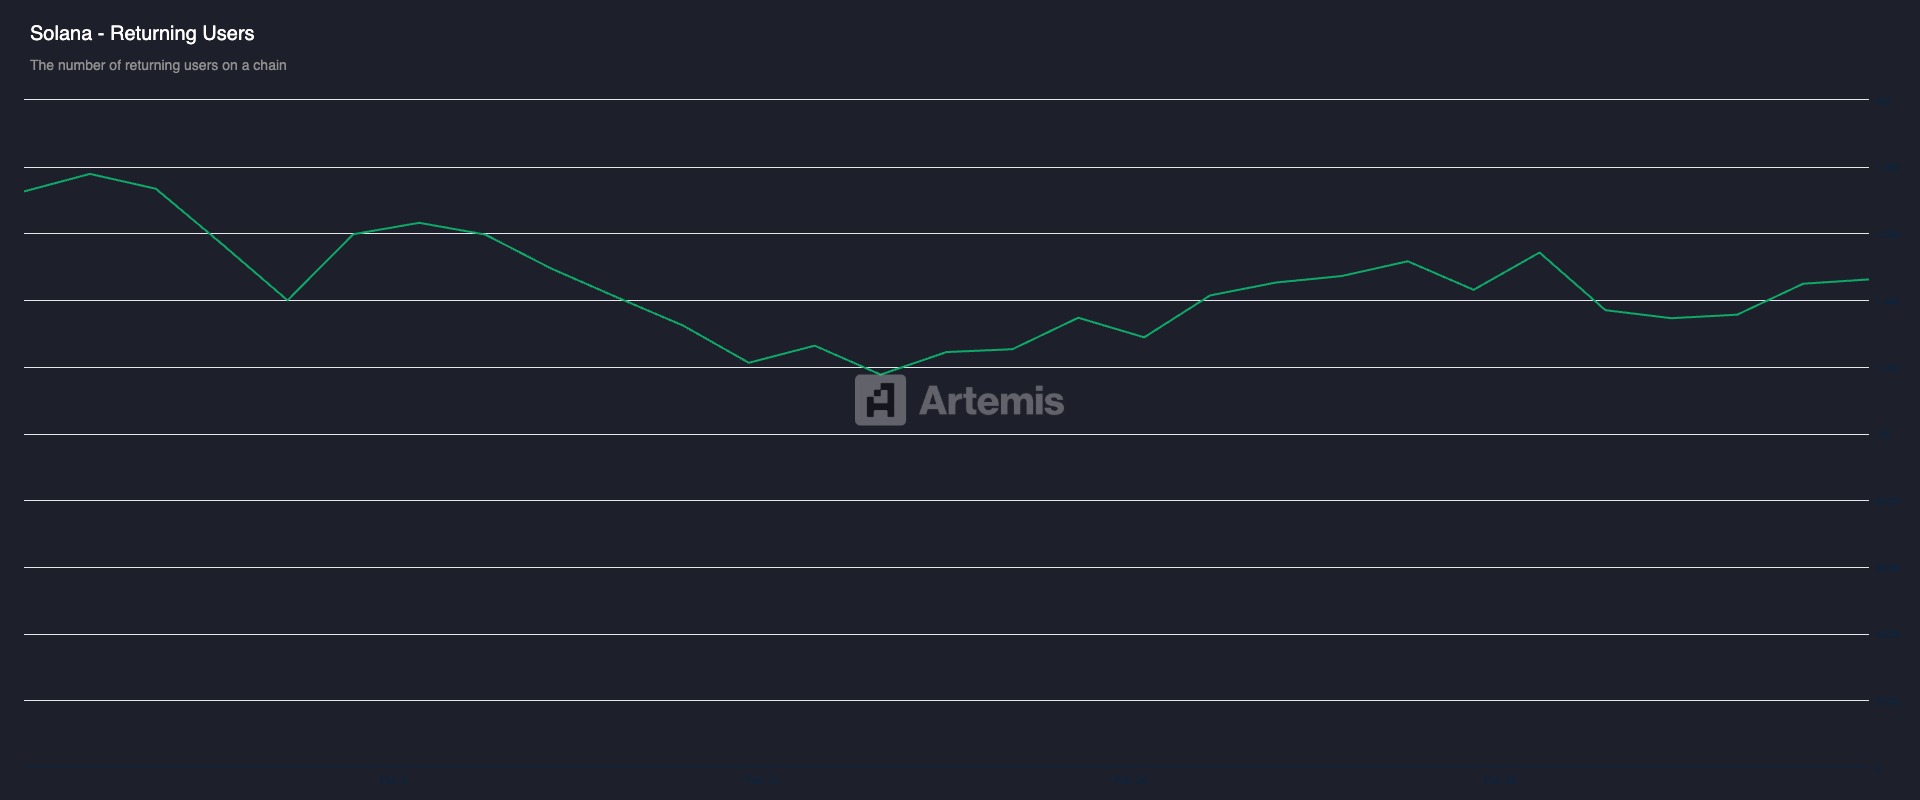
Per the same data provider, returning users on the Solana network have declined by 15.3% over the past month, sliding from roughly 1.8 million users on February 5 to 1.5 million users by March 4.
New user counts have also dipped, reflecting a broader retreat from on-chain engagement on Solana.
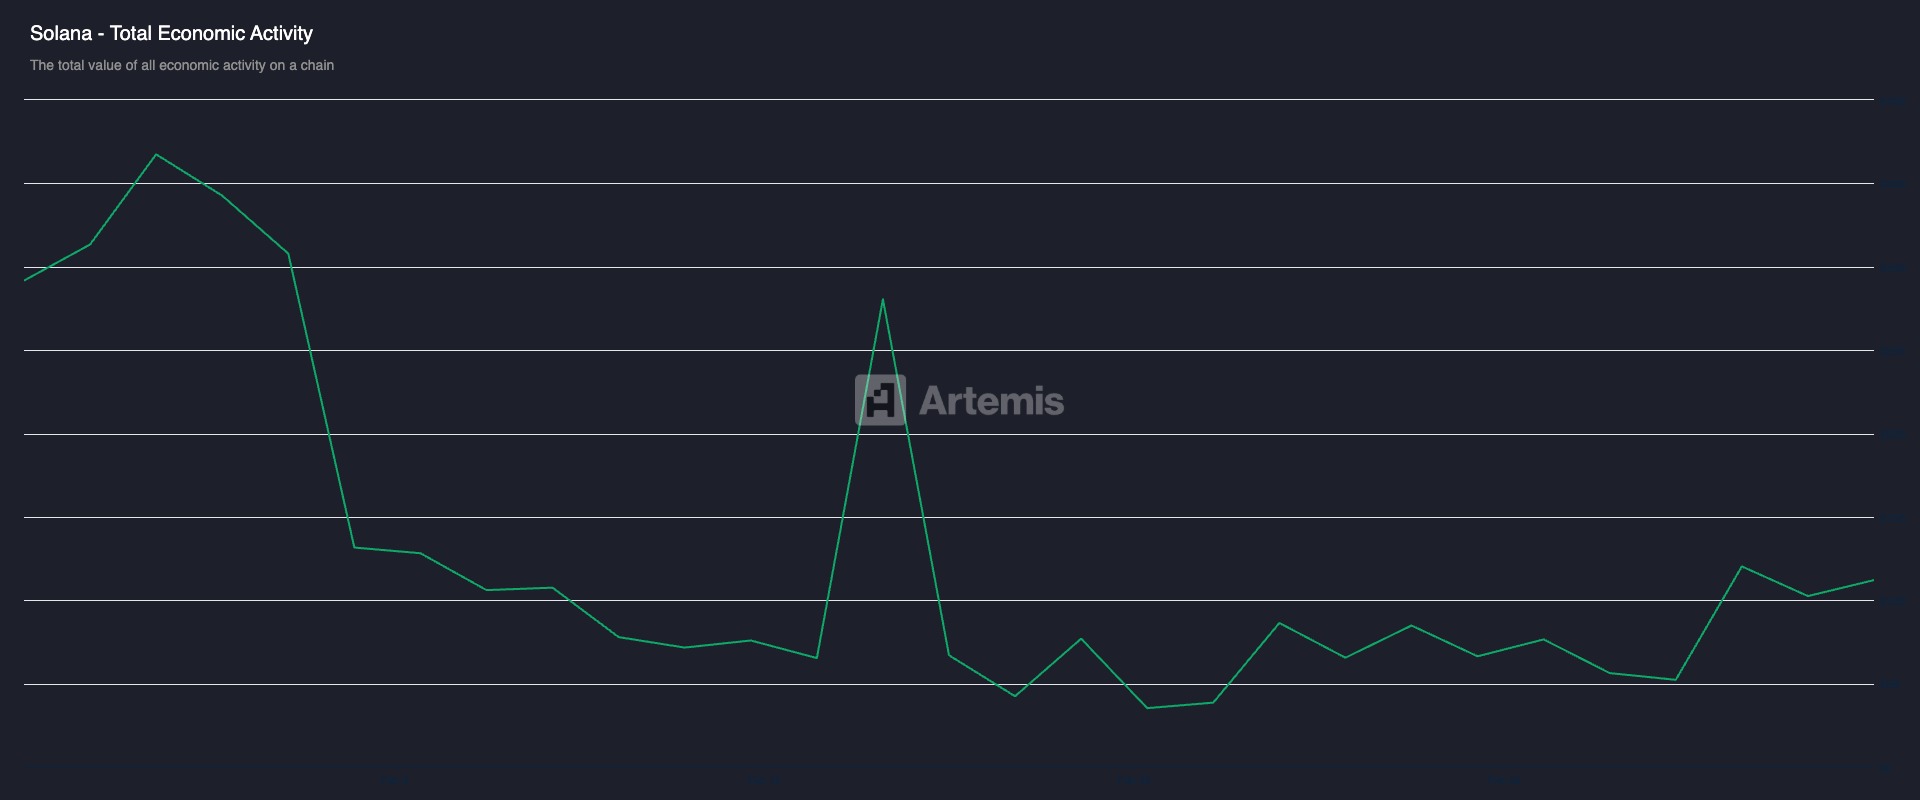
As expected, this contraction in user activity has directly lowered the value of all economic activity on the chain.
Per Artemis data, the decline in Solana’s Total Economic Activity (TEA), which is the sum of chain fees, including MEV, settlement volume, and application fees, confirms this.
Having peaked at approximately $37 billion on February 6, Solana’s TEA has since collapsed sharply by 72%.
As of March 4, this stood at $10 billion, reflecting the significant drop in overall economic throughput on the network over the past month.
SOL Price Lingers as Demand Fades
Falling demand across the Solana network has also weighed on the performance of its native coin.
SOL’s price has traded within a horizontal range since early February, struggling with growing bearish sentiment as on-chain fundamentals continue to weaken.
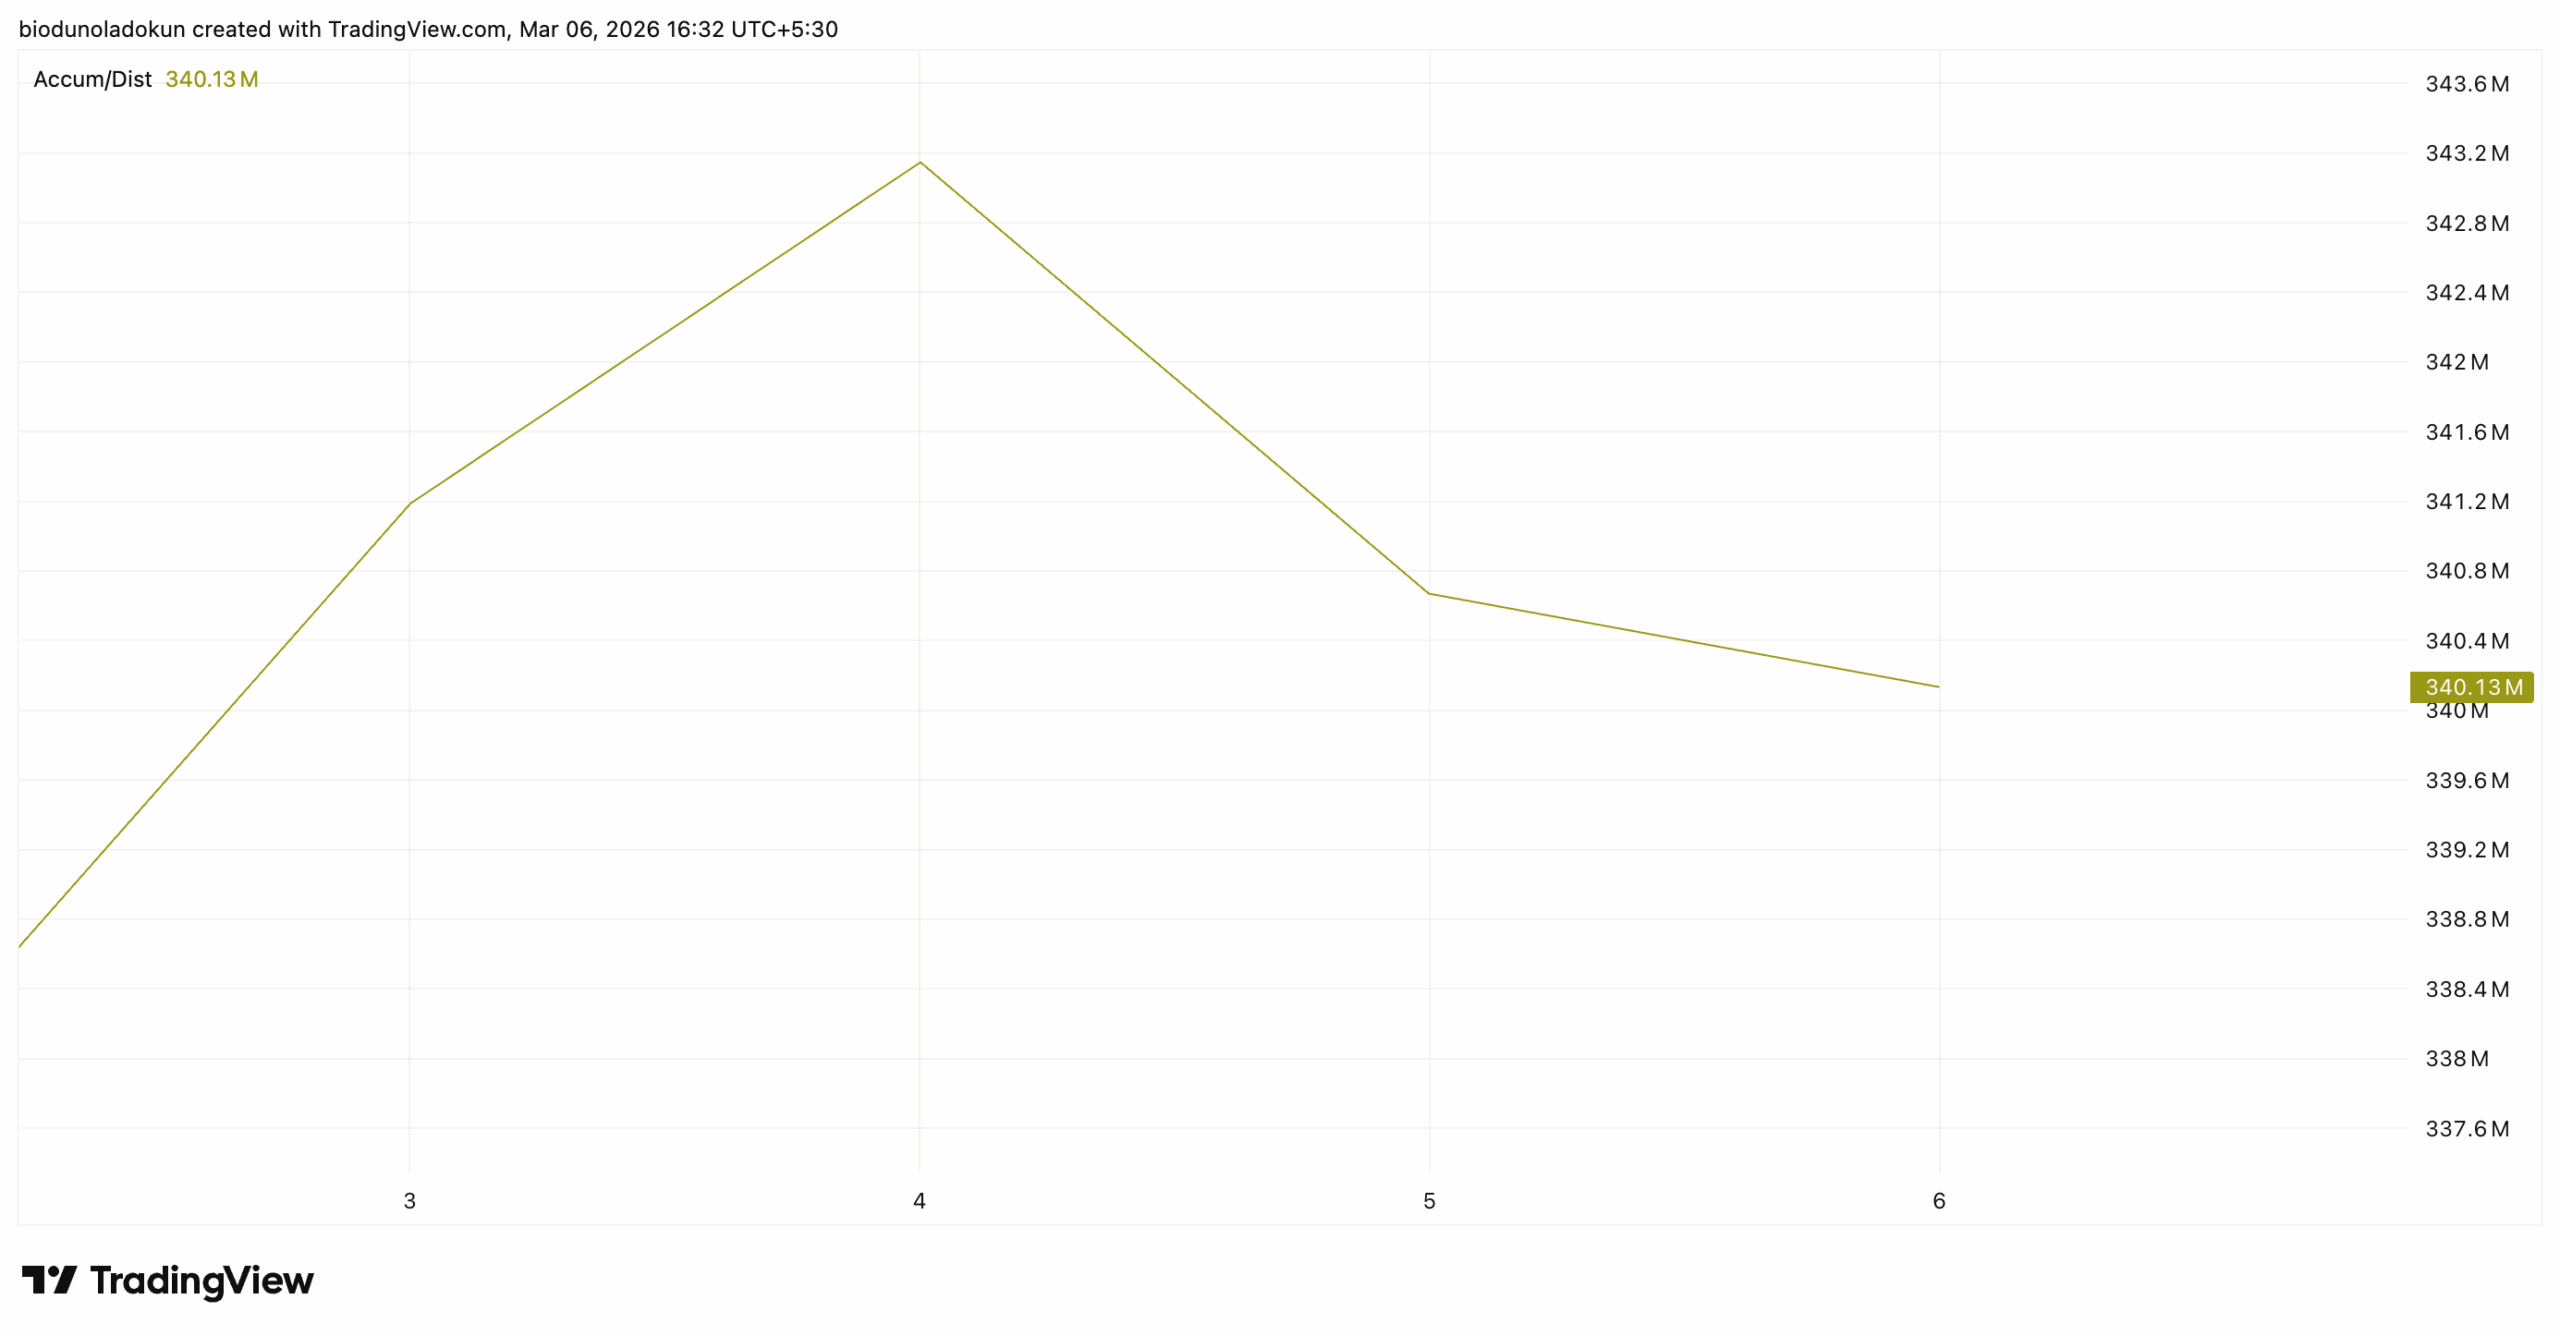
Technical indicators on the daily chart confirm this. The coin’s Accumulation/Distribution line is trending lower, signaling that selling pressure is outpacing buying interest.
As of this writing, this momentum indicator is at 340.12 million, falling steadily since March 4.
The Accumulation/Distribution Line measures the cumulative flow of money into and out of an asset. Traders use it to gauge the market’s buying and selling pressure.
When the indicator surges, it signals that buying pressure is dominant and that the asset may be poised for upward price movement.
Conversely, a declining A/D line — as is currently the case with SOL — suggests that selling pressure is outpacing accumulation, pointing to potential further downside ahead.
With network revenue, user activity, and total economic activity all trending downward in unison, SOL bears appear to hold the upper hand.
Unless on-chain demand recovers, the coin faces the risk of a deeper breakdown below the lower line of its horizontal channel, which forms a support floor at $76.15. A break below this critical orice level could result in a drop toward $67.50.
Disclaimer:
The information provided in this article is for informational purposes only. It is not intended to be, nor should it be construed as, financial advice. We do not make any warranties regarding the completeness, reliability, or accuracy of this information. All investments involve risk, and past performance does not guarantee future results. We recommend consulting a financial advisor before making any investment decisions.
Abiodun Oladokun is a Research Analyst at CCN, where he covers cryptocurrency markets with a focus on on-chain analysis, technical assessments, and emerging trends across decentralized finance (DeFi), real-world assets (RWA), artificial intelligence (AI), decentralized physical infrastructure networks (DePIN), Layer 2s, and meme coins.
Prior to CCN, he served as a Senior On-Chain Analyst at BeInCrypto, producing market reports spanning diverse crypto sectors.
Before that, he conducted technical analysis and market assessments of various altcoins at AMBCrypto, where he also contributed long-form quarterly research papers on DeFi, NFTs, DAOs, and scaling architectures, leveraging on-chain platforms including Messari, Santiment, DefiLlama, and Dune Analytics.
He began his crypto career as a research analyst at SixthSense DAO, developing blockchain forensic tools to trace the history of stolen assets.
Abiodun is a lawyer called to the Nigerian Bar and the founder of Ilé Ijó, a Lagos-based electronic dance music collective.