The US-Israel-Iran conflict escalation has sent Brent crude prices high, triggering a broad risk-off move that is weighing on Ethereum.
ETH’s options market shows puts outpacing calls, signaling that a significant portion of traders are positioning against a near-term recovery.
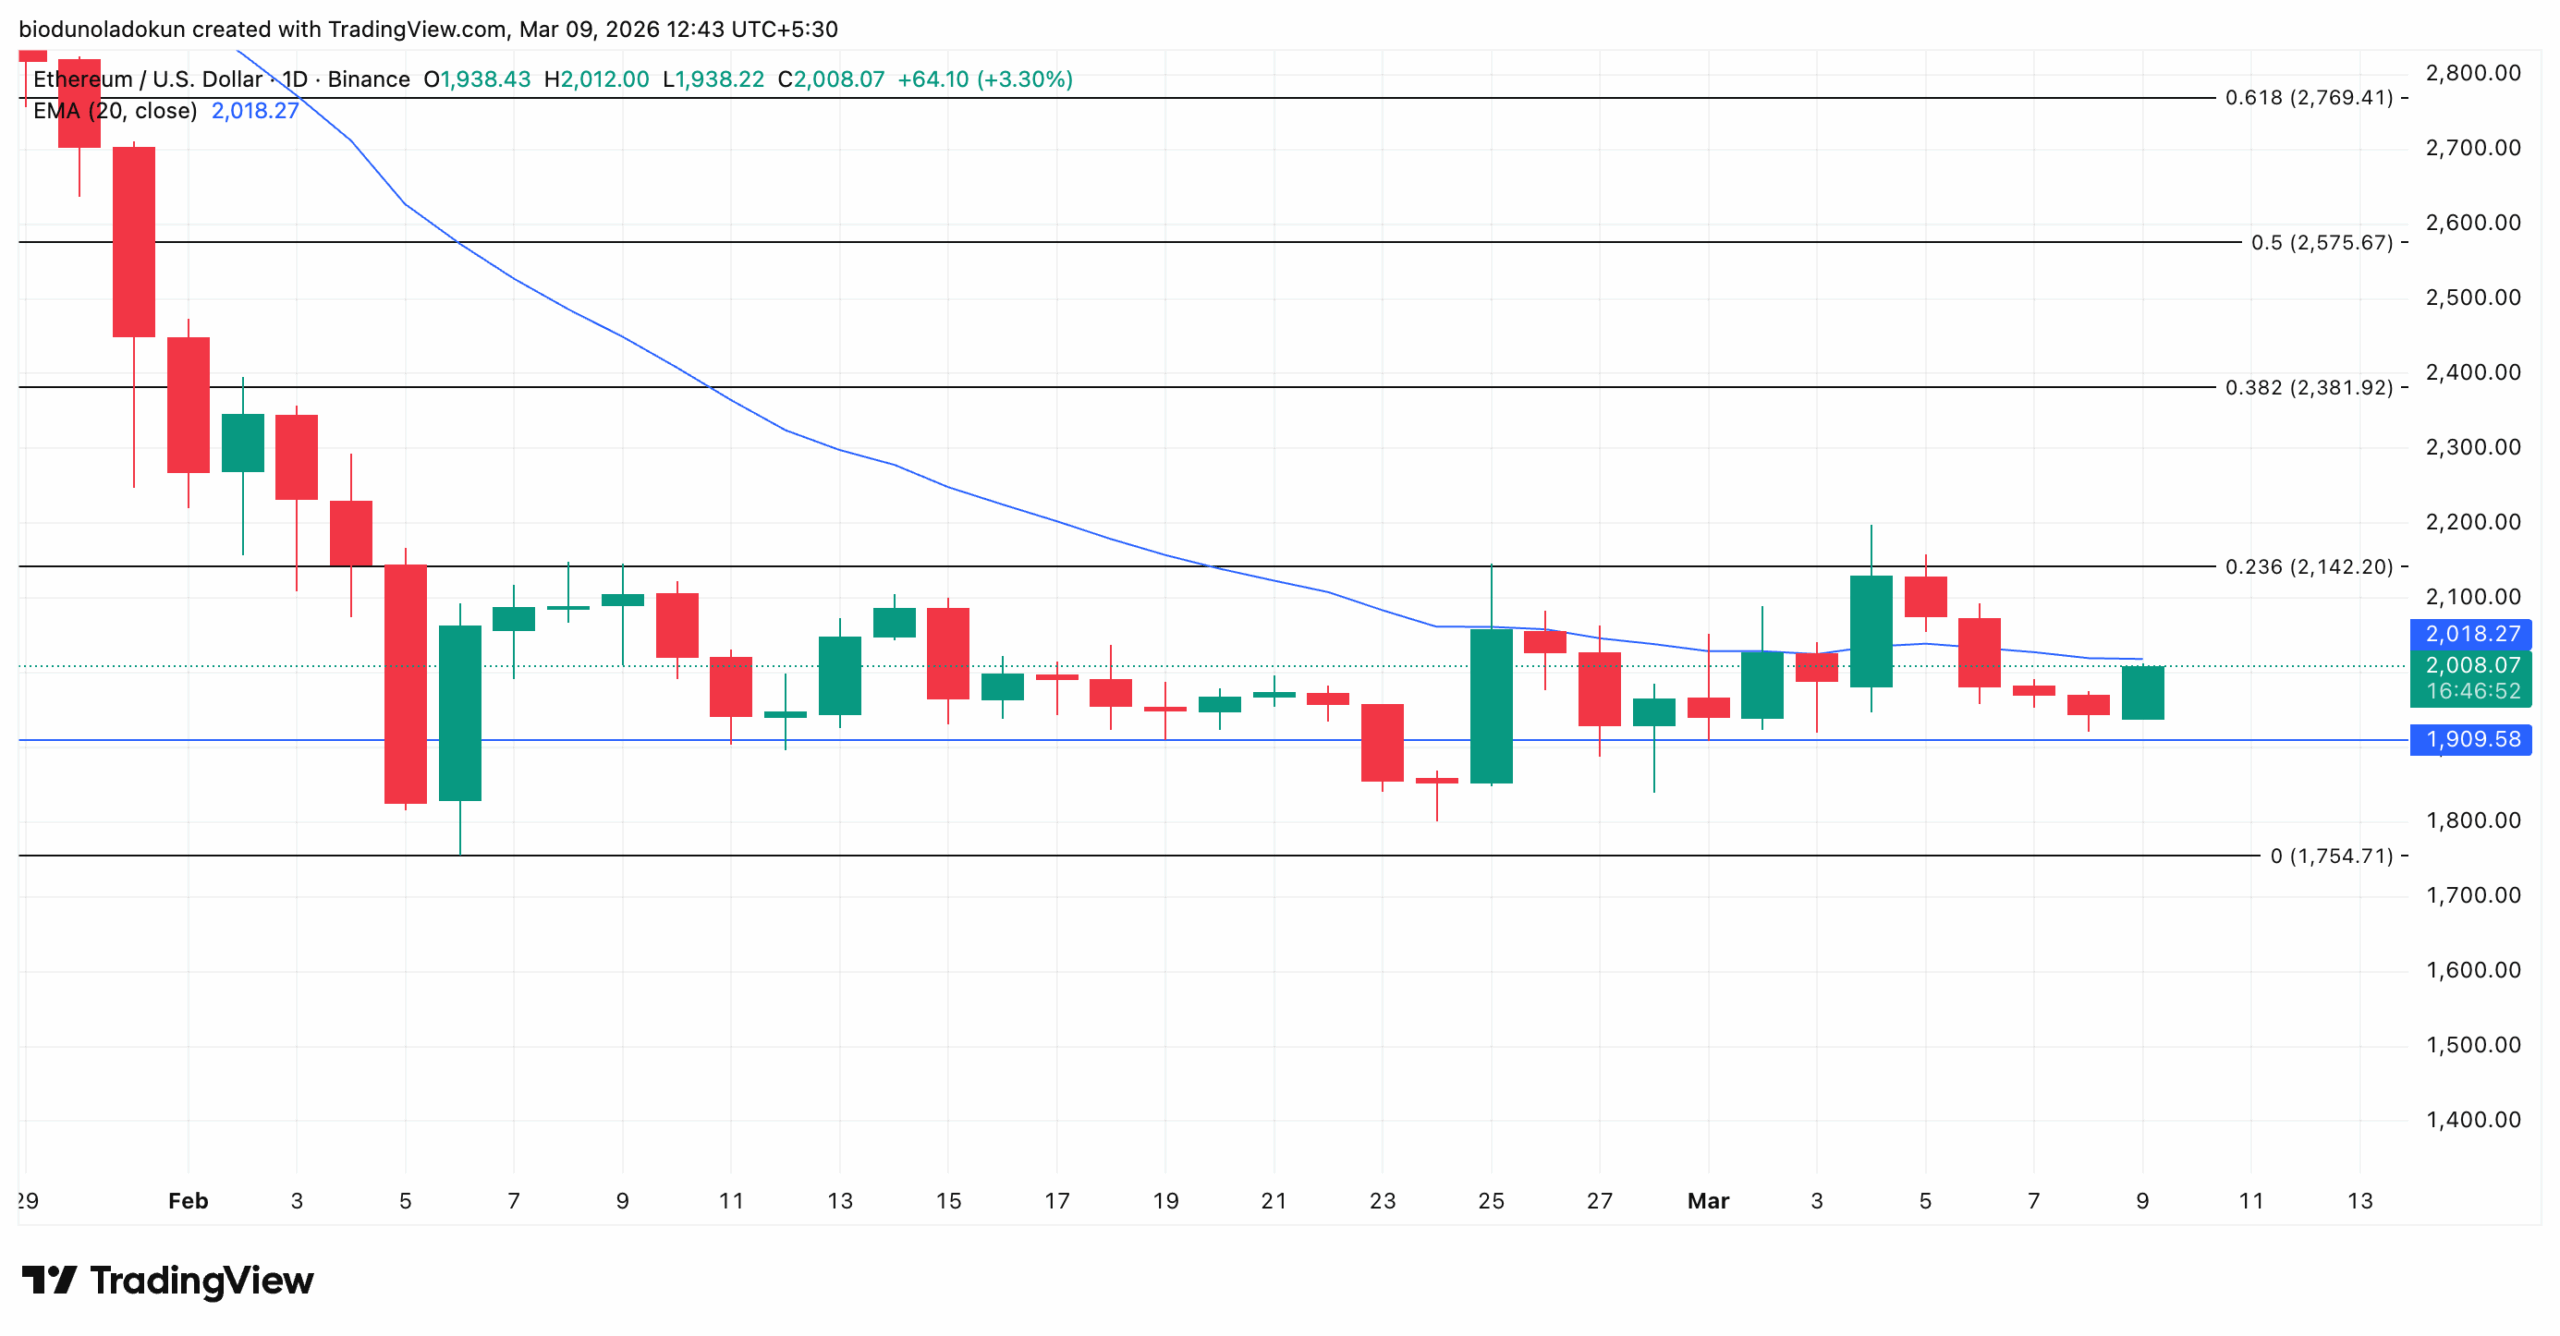
Despite the bearish macro backdrop, ETH’s rising BOP and proximity to its 20-day EMA leave room for a relief rally.
Growing geopolitical tensions following an escalation in the US-Israel-Iran conflict over the weekend are casting a long shadow over crypto markets.
The United States and Israel struck Iranian oil infrastructure over the weekend, prompting retaliatory strikes from Tehran.
With markets reopening Monday, the fallout has rippled through commodity markets — Brent crude briefly spiked, still up 16% on the day, while WTI crude climbed to $103.18, gaining 14%.
The surge in oil prices, compounded by broad declines across Asia-Pacific equity markets during Monday morning trades, is weighing heavily on risk assets.
Some Ethereum investors are increasingly moving to hedge against further losses, which may keep the altcoin’s value lower.
Sentiment Deteriorates Among US-Based Holders
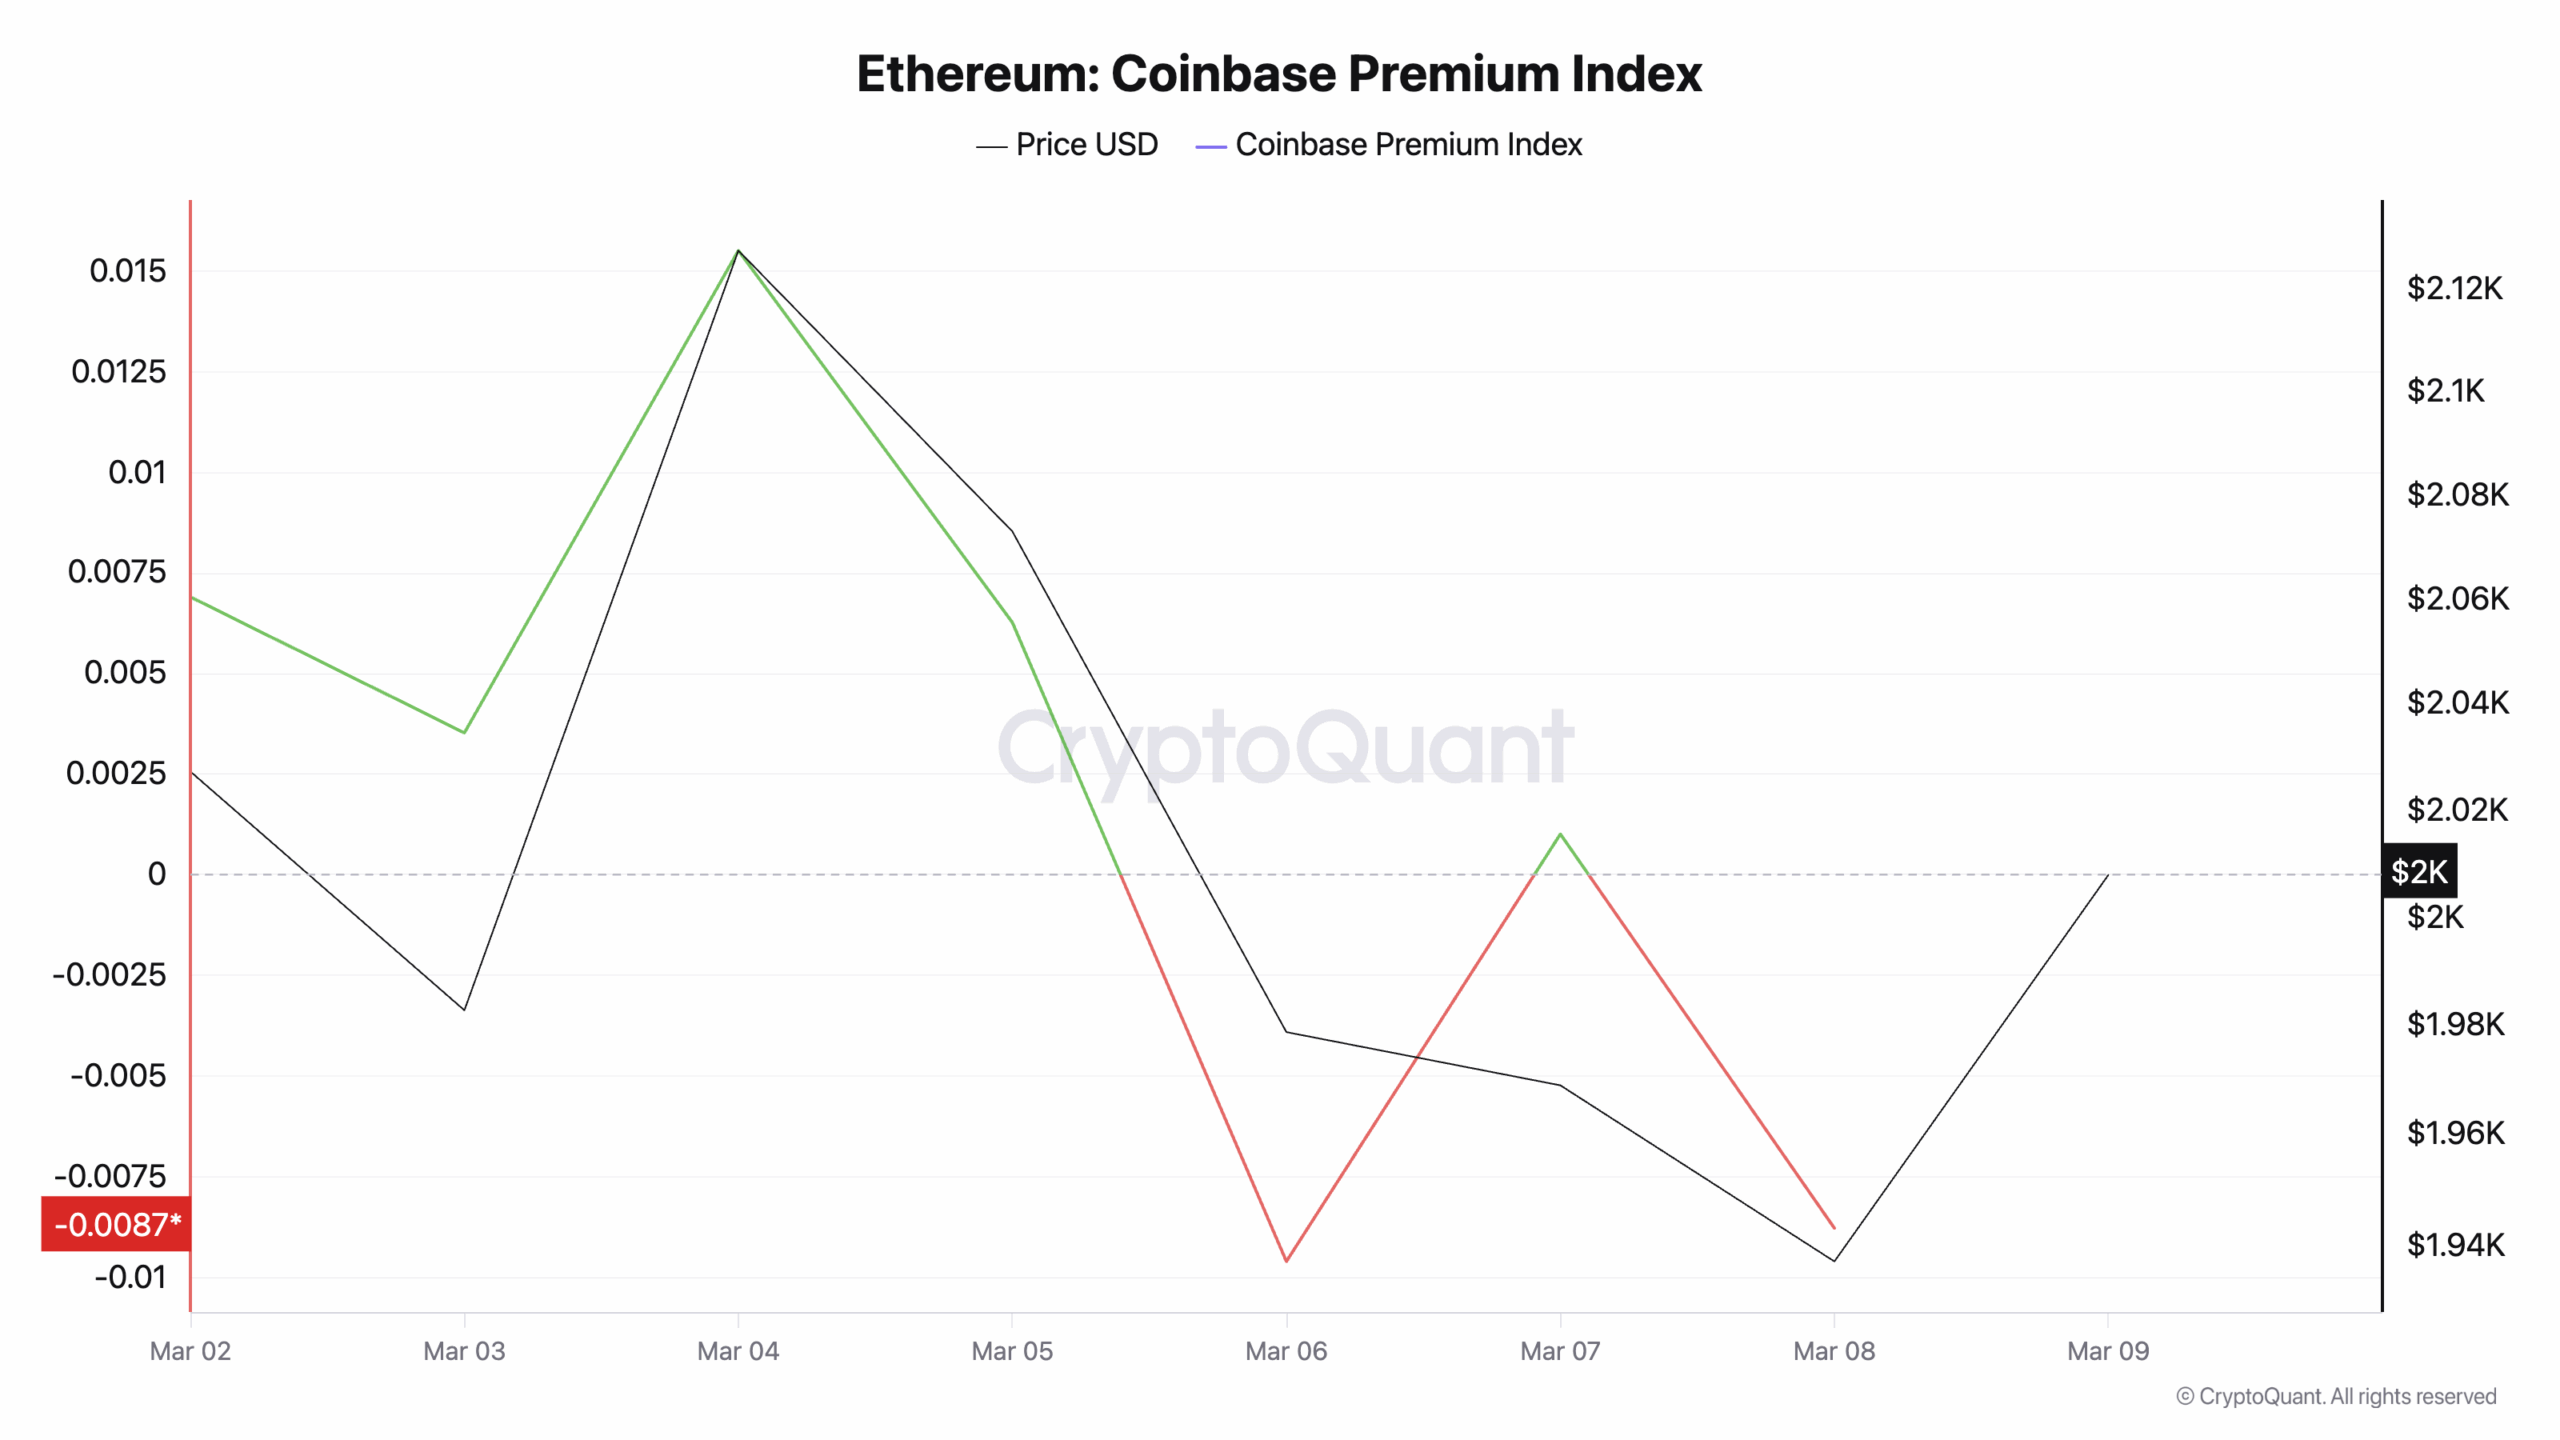
On-chain data paint a consistently bearish picture for ETH. According to CryptoQuant, the coin’s Coinbase Premium Index (CPI) has trended downward since March 4 and currently rests below the zero line at -0.0087.
Ethereum Coinbase Premium Index | Credit: CryptoQuant
This metric measures the difference between ETH’s prices on Coinbase and Binance and is a good indicator of U.S. investor sentiment.
When the CPI rises, the leading altcoin trades at a premium on Coinbase compared to international exchanges. This is a sign of stronger buying pressure from U.S.-based investors.
Conversely, when the CPI falls—or worse, turns negative—as is the case with ETH, it signals that demand on Coinbase is falling behind global markets due to profit-taking or waning interest among U.S. buyers.
This trend is notable because the decline in American demand, amid heightened macro uncertainty, removes key buying pressure from the market, leaving the altcoin more exposed to further downside.
Ethereum Derivatives Traders Join the Retreat
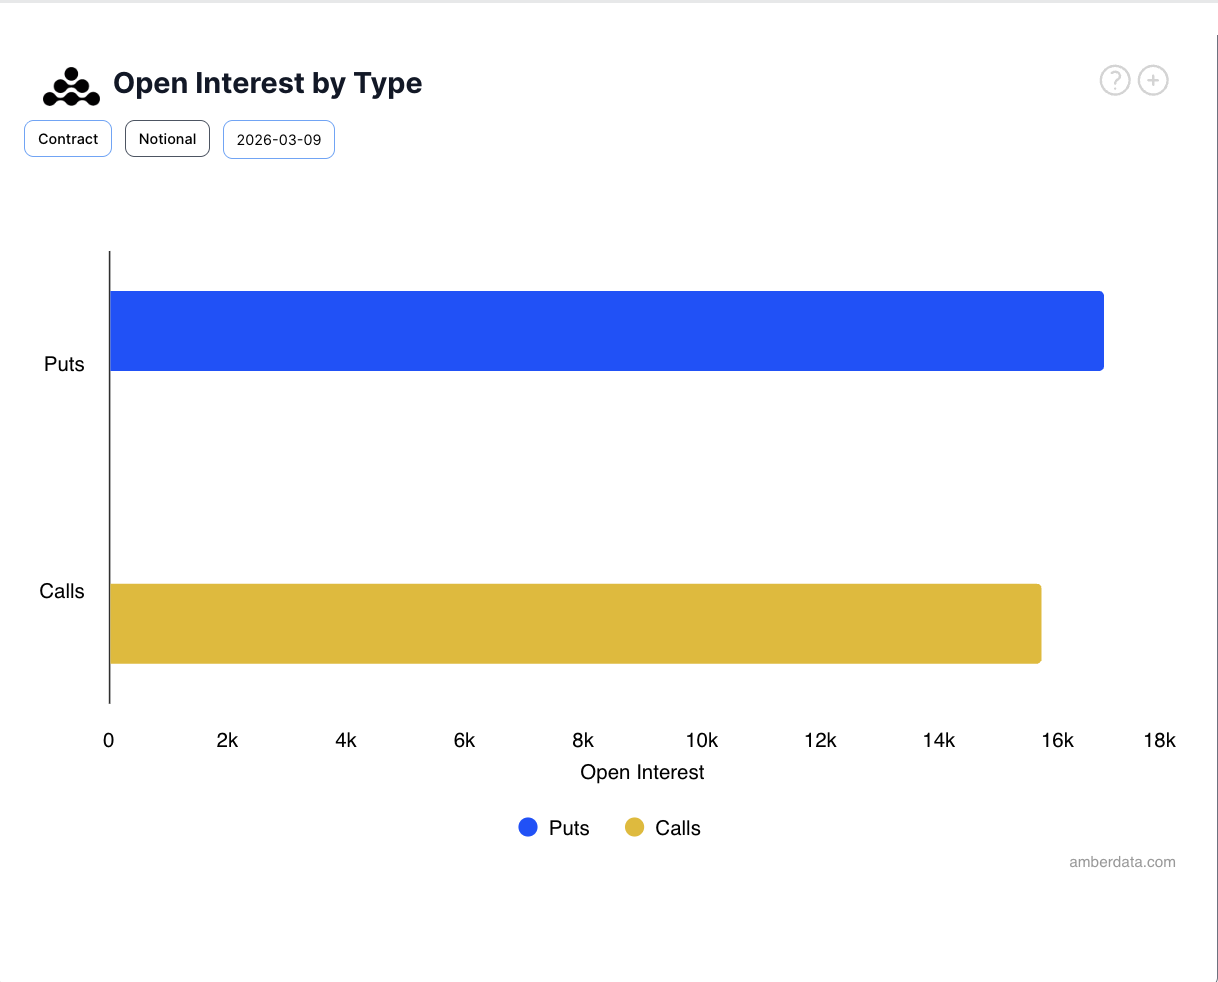
The bearish tone extends into the altcoin’s derivatives market. Per Deribit’s data, on Monday morning, open interest in ETH options is skewed toward puts, with approximately 17,000 contracts against roughly 15,500 for calls.
When put open interest exceeds calls like this, it signals that a significant portion of the options market profits if the coin’s price falls.
This bearish signal suggests that options traders have little confidence in a near-term ETH recovery and are positioning against it.
Technical Picture Offers a Glimmer
Interestingly, ETH’s spot traders hold a different sentiment. While the coin’s price remains largely sideways, readings from some technical indicators point to quiet accumulation.
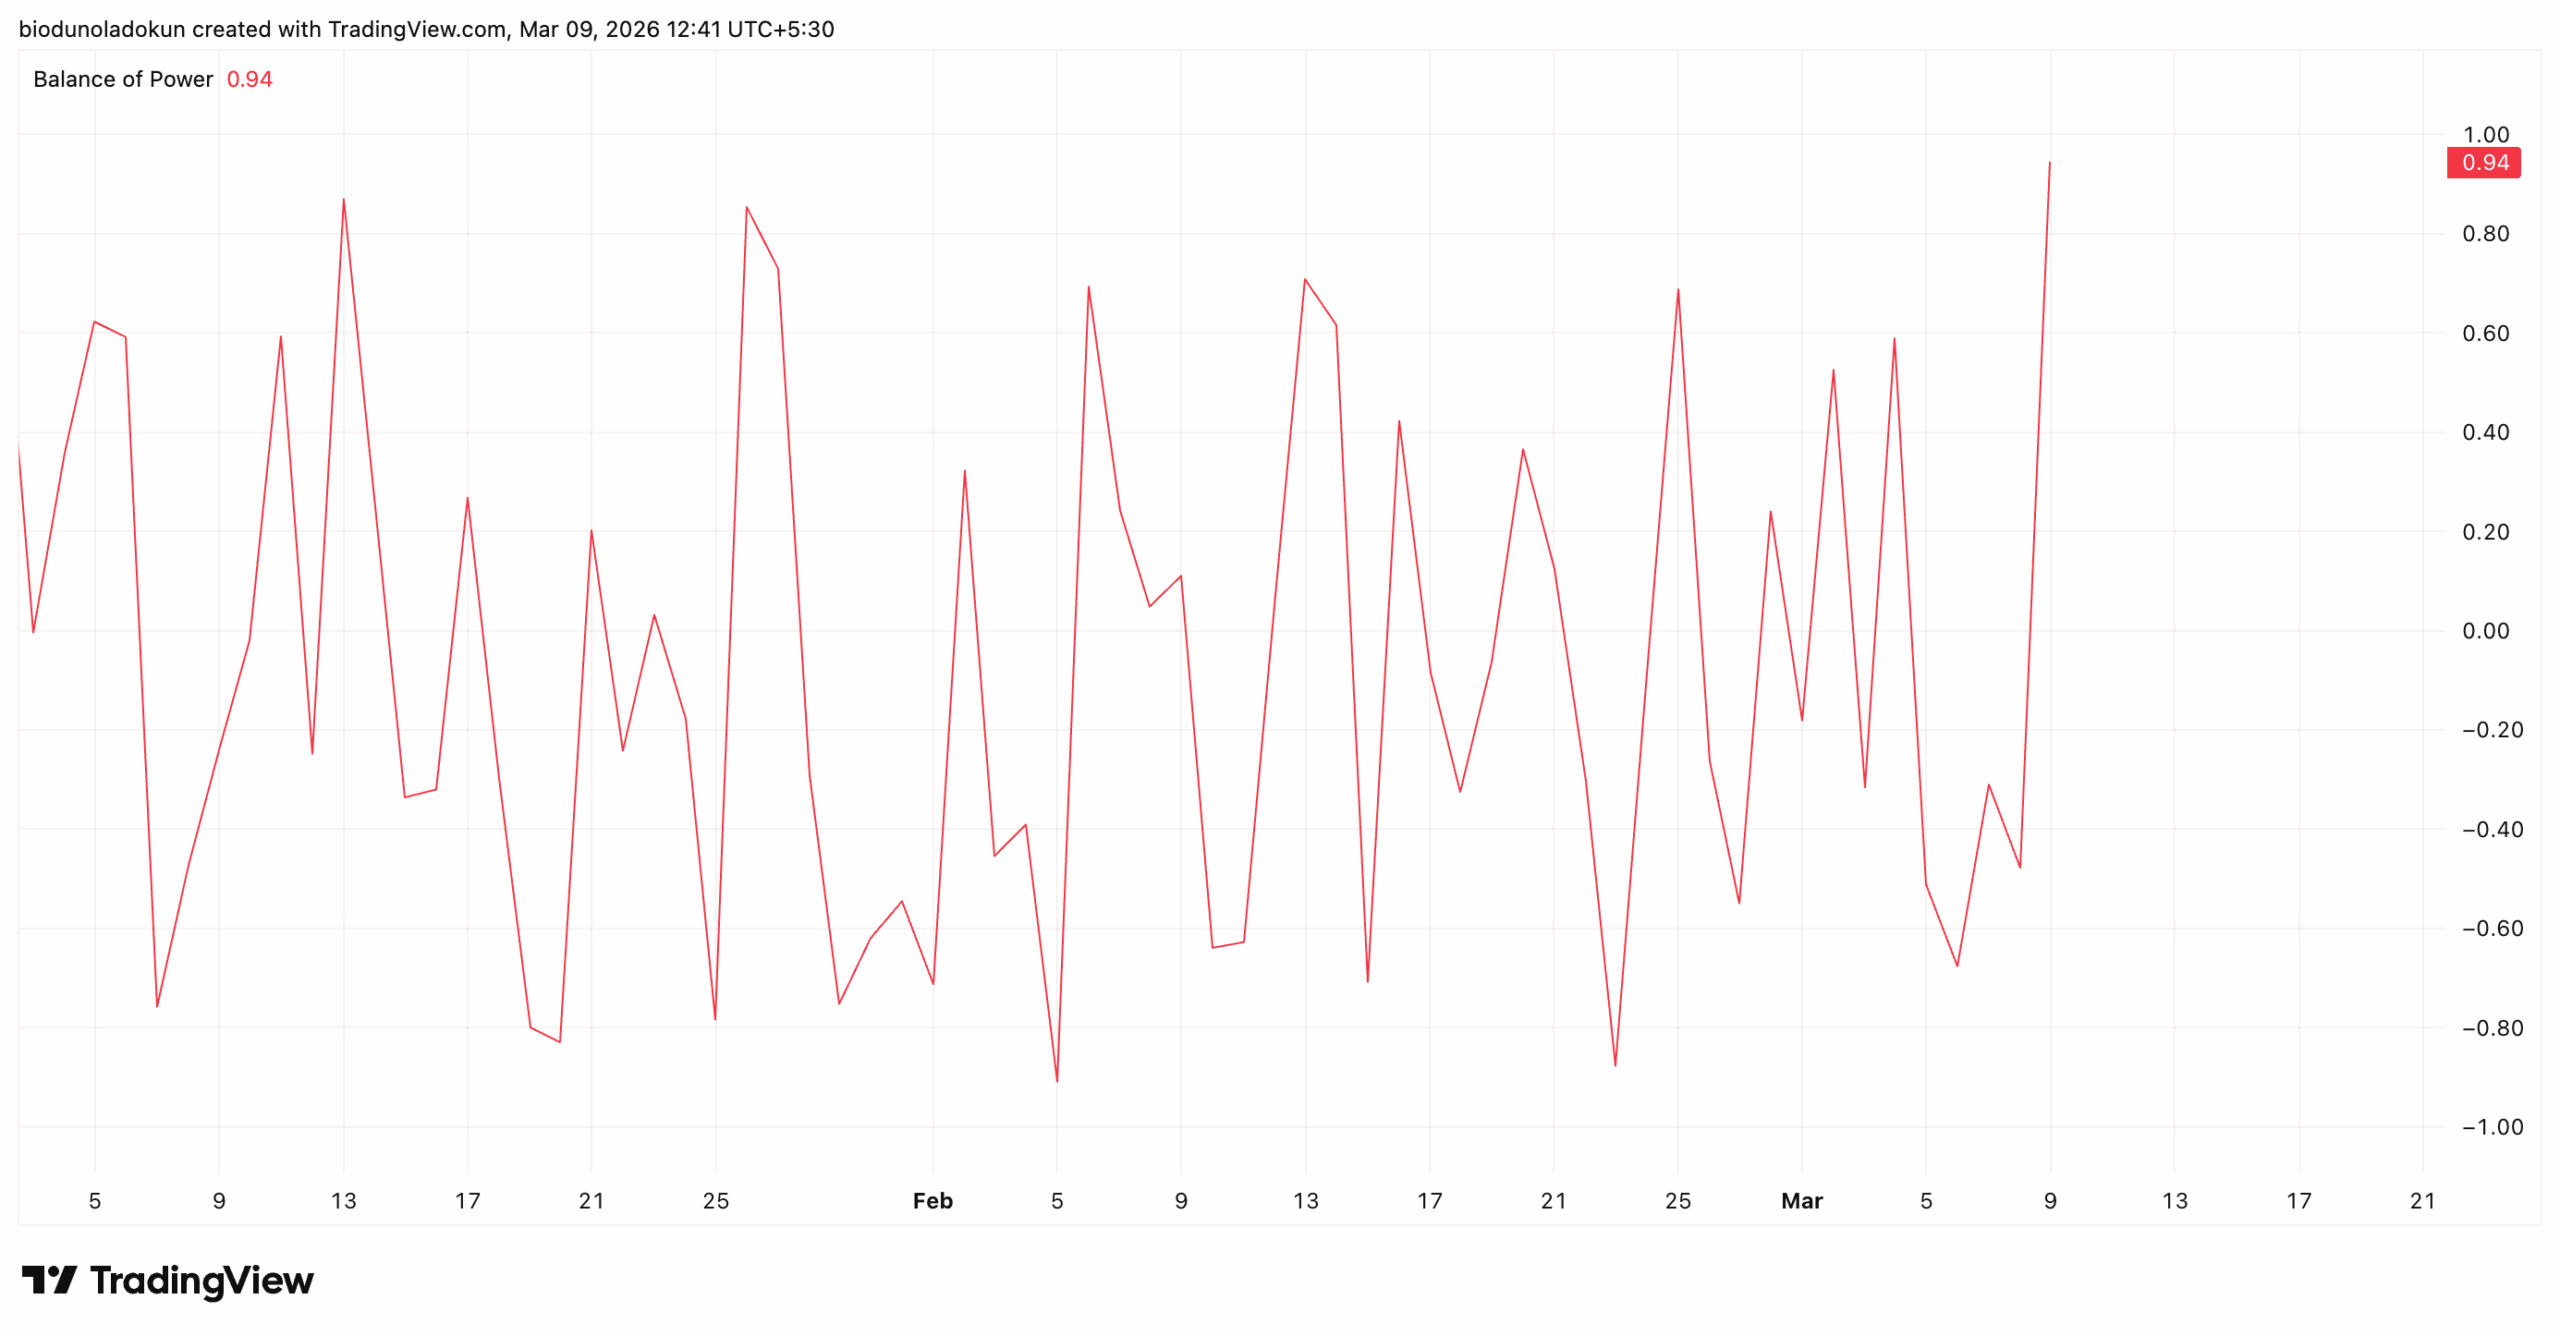
On the daily chart, ETH’s Balance of Power (BOP) indicator is positive and is in an uptrend. As of this writing, this indicator is in an upward trend at 0.94.
An asset’s BoP measures the strength of its buyers versus sellers in the market over a specific period. As with ETH, a positive, rising BOP indicates increasing buying pressure in the market.
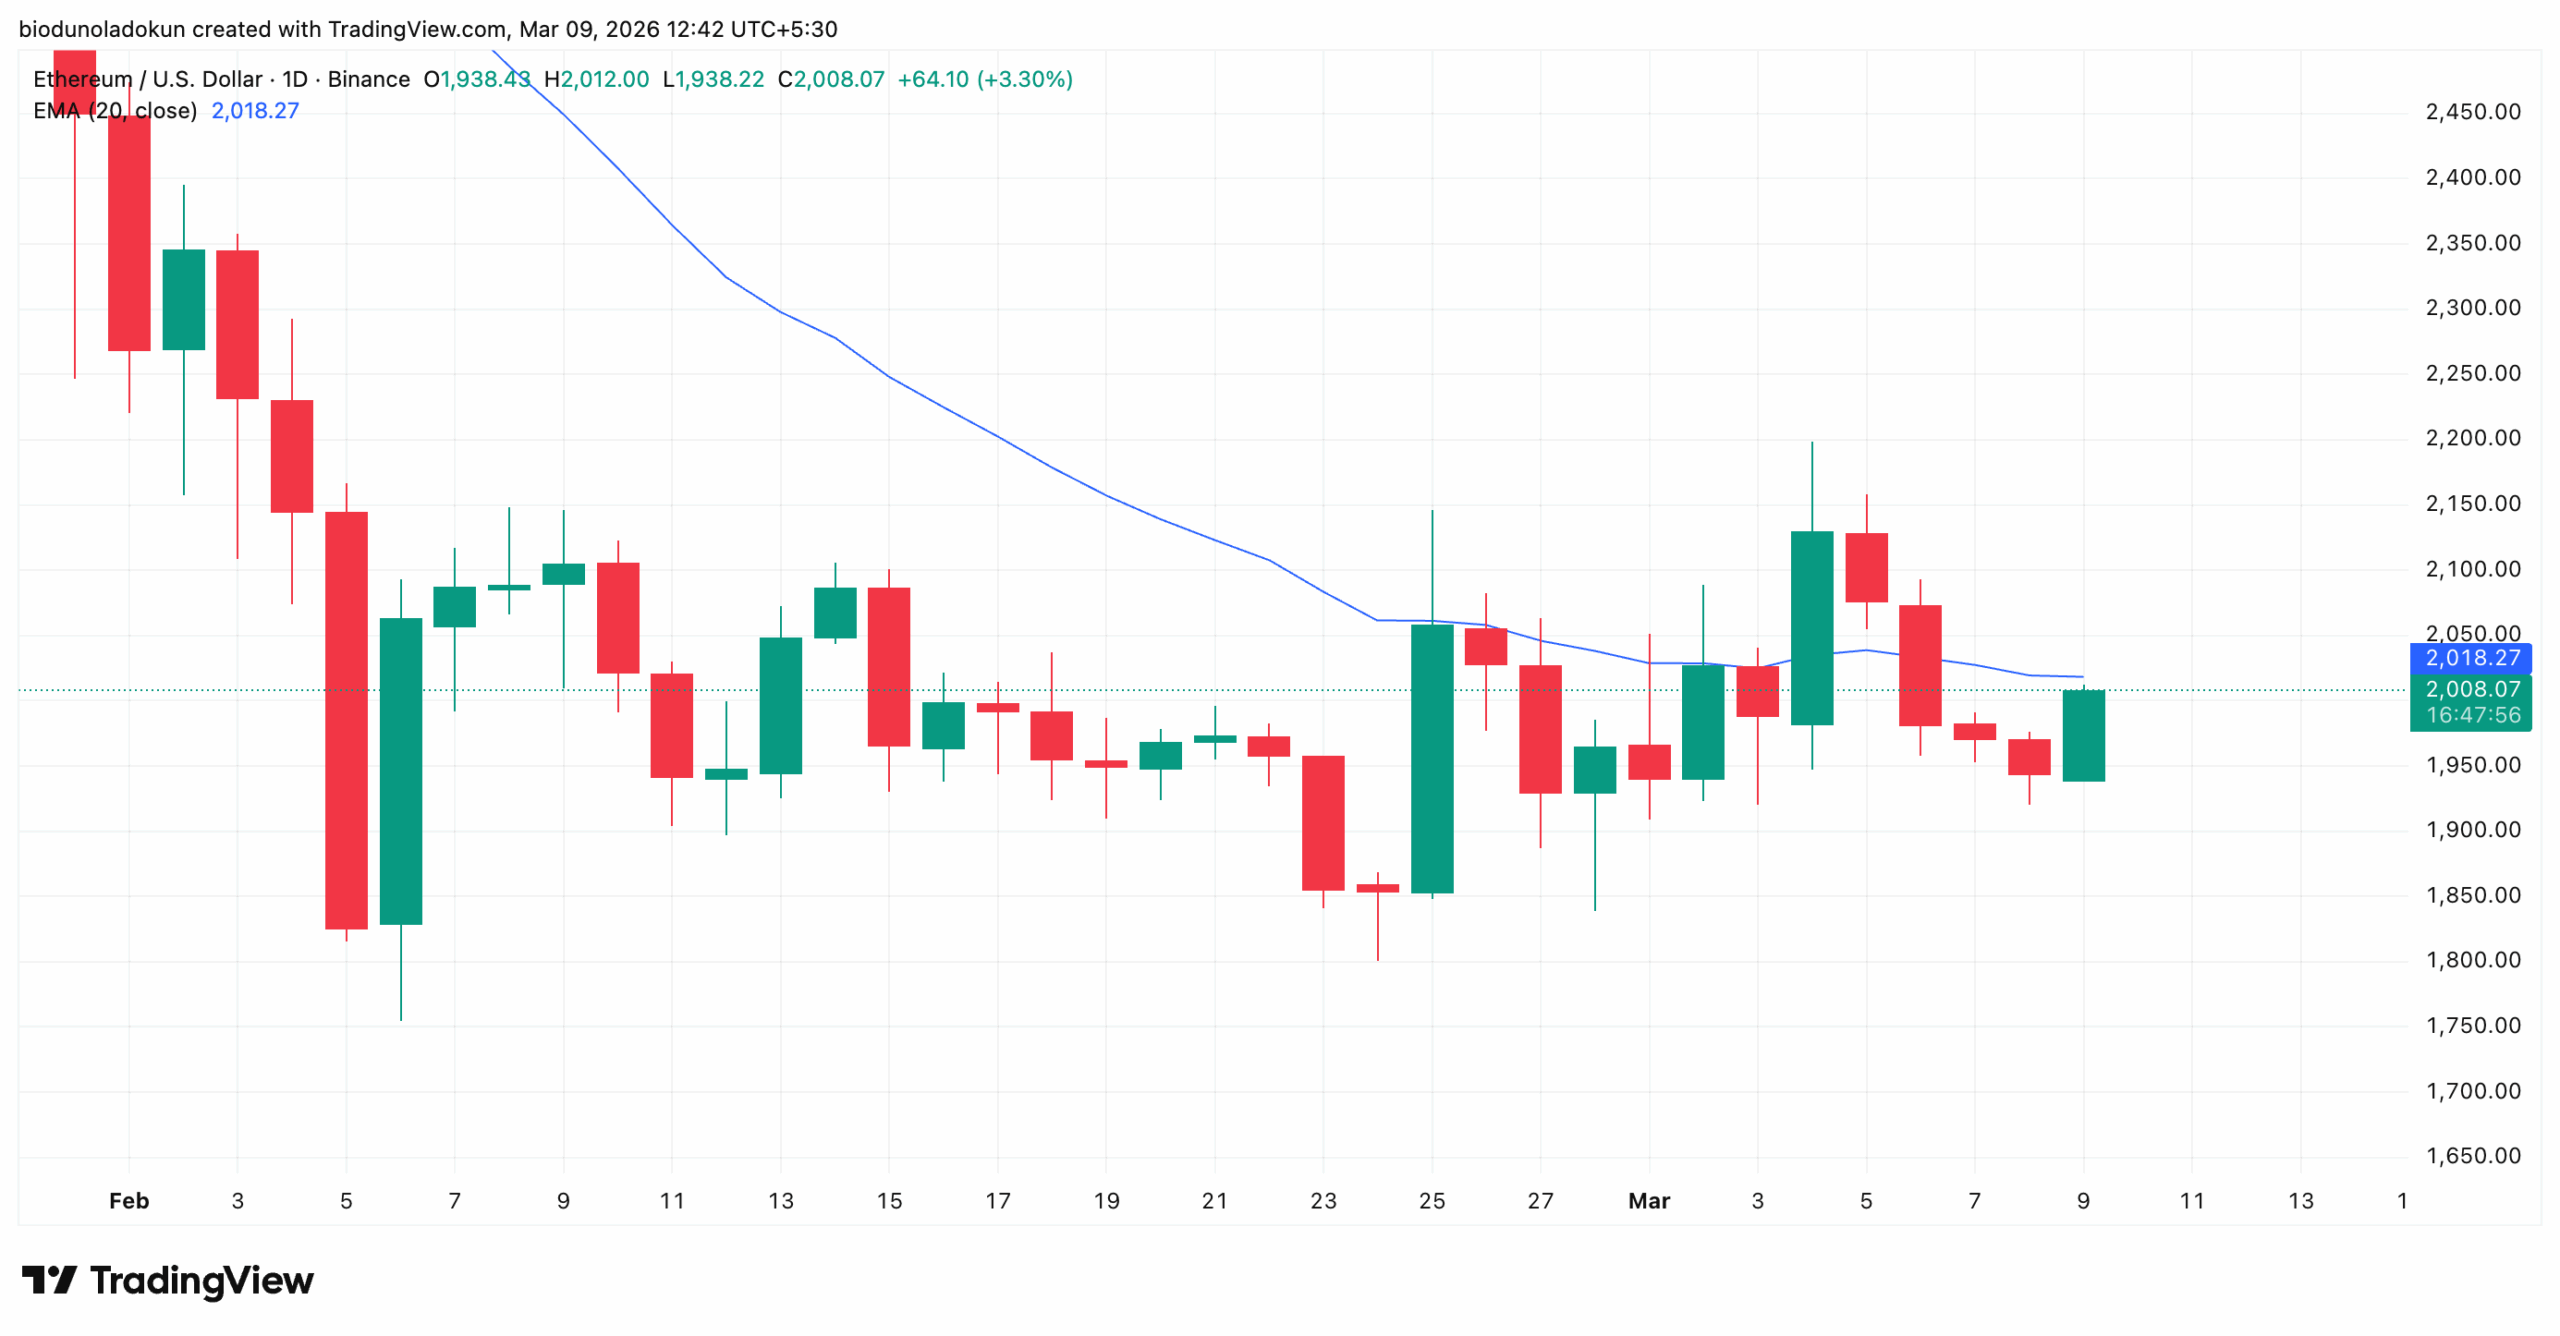
Moreover, ETH has posted a 2% gain today, bringing its price closer to its 20-day exponential moving average, a close above which could prompt a further rally.
The 20-day EMA measures an asset’s average price over the past 20 trading sessions, giving more weight to recent prices.
When the price moves above this line, it signals a potential shift in short-term momentum, as the asset reclaims a key dynamic resistance level and attracts fresh buying interest.
These technical readings suggest that, despite macro headwinds, a flat crypto market, and derivatives bearishness, ETH may rally if spot buyers can sustain demand.
If the buying pattern holds, the coin’s price could climb toward $2,142. A breach of this key resistance will put ETH on the way to trading at $2,381.
However, for this to materialise, the altcoin will need to hold the $1,909 support floor. A slip below this key level could trigger a further dip toward $1,754.
[You-may-like]
Disclaimer:
The information provided in this article is for informational purposes only. It is not intended to be, nor should it be construed as, financial advice. We do not make any warranties regarding the completeness, reliability, or accuracy of this information. All investments involve risk, and past performance does not guarantee future results. We recommend consulting a financial advisor before making any investment decisions.
Abiodun Oladokun is a Research Analyst at CCN, where he covers cryptocurrency markets with a focus on on-chain analysis, technical assessments, and emerging trends across decentralized finance (DeFi), real-world assets (RWA), artificial intelligence (AI), decentralized physical infrastructure networks (DePIN), Layer 2s, and meme coins.
Prior to CCN, he served as a Senior On-Chain Analyst at BeInCrypto, producing market reports spanning diverse crypto sectors.
Before that, he conducted technical analysis and market assessments of various altcoins at AMBCrypto, where he also contributed long-form quarterly research papers on DeFi, NFTs, DAOs, and scaling architectures, leveraging on-chain platforms including Messari, Santiment, DefiLlama, and Dune Analytics.
He began his crypto career as a research analyst at SixthSense DAO, developing blockchain forensic tools to trace the history of stolen assets.
Abiodun is a lawyer called to the Nigerian Bar and the founder of Ilé Ijó, a Lagos-based electronic dance music collective.