XRP broke above a six-week horizontal channel on Monday but failed to sustain the move, falling back into the range.
CryptoQuant data shows weakening demand from large players and a shift toward net selling in the futures market.
With a dense liquidity cluster below its current price, XRP could extend losses if buyers fail to emerge.
Ripple’s XRP had spent roughly six weeks trapped in a horizontal channel between February 4 and March 15, before the token’s price finally broke above the channel’s upper boundary on Monday.
However, this breakout has since collapsed. The token has fallen back into the same sideways structure, and on-chain data now suggests the next significant move may be toward the lower bound of the channel and potentially toward the $1.11 price zone.
XRP Rode Bitcoin’s Wave — Then Got Pulled Under With It
Monday opened with renewed buy-side pressure sweeping across the crypto market, lifting leading digital assets sharply.
Bitcoin climbed to multi-week highs around $75,000 while Ethereum surged to $2,387, both riding a wave of risk-on momentum that briefly lifted sentiment across the board.
Given XRP’s positive correlation with the leading asset Bitcoin, the broader rally pulled the token’s price higher in tandem.
However, as BTC’s price retreated from recent highs, XRP’s price has followed. It has fallen back into the horizontal channel it had only just escaped.
With on-chain data pointing to a lack of new demand, XRP remains vulnerable to further downside as the week progresses.
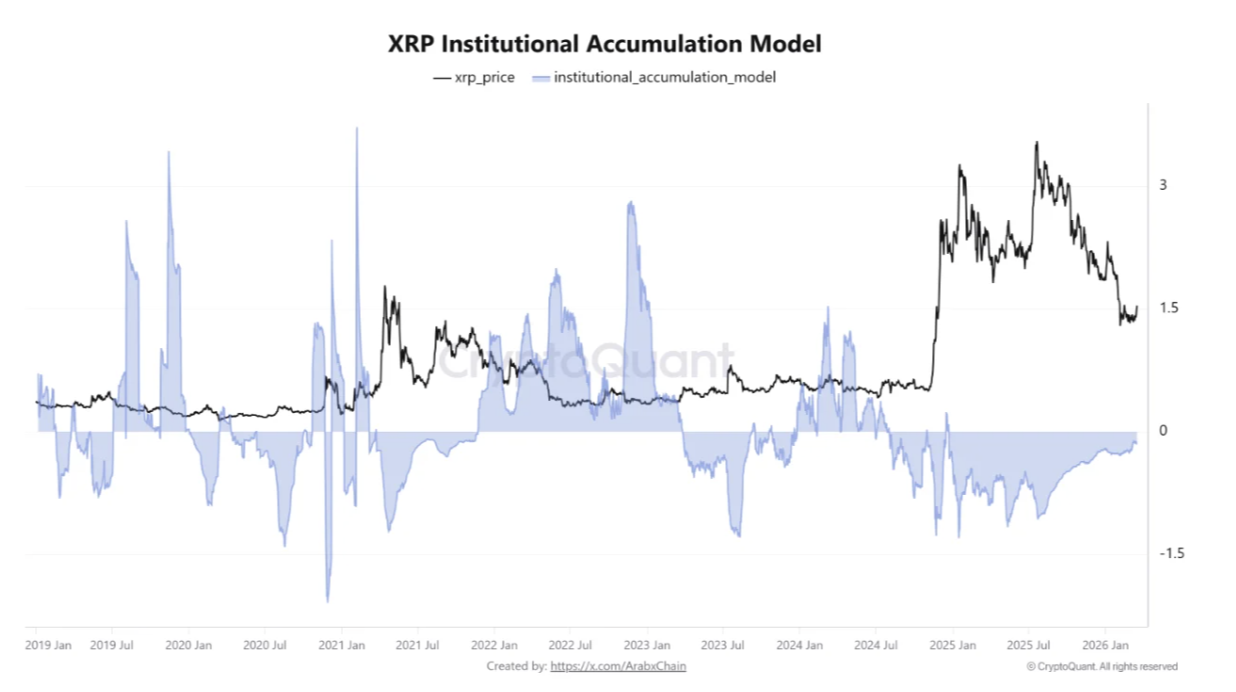
Institutional Players Are Stepping Back From XRP
In a new report, CryptoQuant analyst Arab Chain noted that the XRP market is currently experiencing a decline in participation from key investors, which adds to the risk of a further downtrend.
Arab Chain assessed XRP’s Institutional Accumulation Model and found that the index has slipped into negative territory, registering a reading of -0.14 against a spot price of $1.46.
XRP Institutional Accumulation Model | Credit: CryptoQuant
While the low volatility that kept XRP range-bound over the past several weeks created a surface-level stability, the metric’s negative reading signals that institutional buy-side flows have continued to weaken.
This suggests that large players are neither accumulating nor providing the demand needed to support a push back above the horizontal channel.
Per the report:
“Looking at the index’s historical behavior, periods of high positive values often precede or coincide with strong upward trends, reflecting the entry of smart money building long-term positions. Conversely, negative values—as in the current situation—indicate weak accumulation or even the early stages of a gradual distribution phase.”
This absence of meaningful buy-side flow from these key token holders may push XRP’s price lower in the meantime.
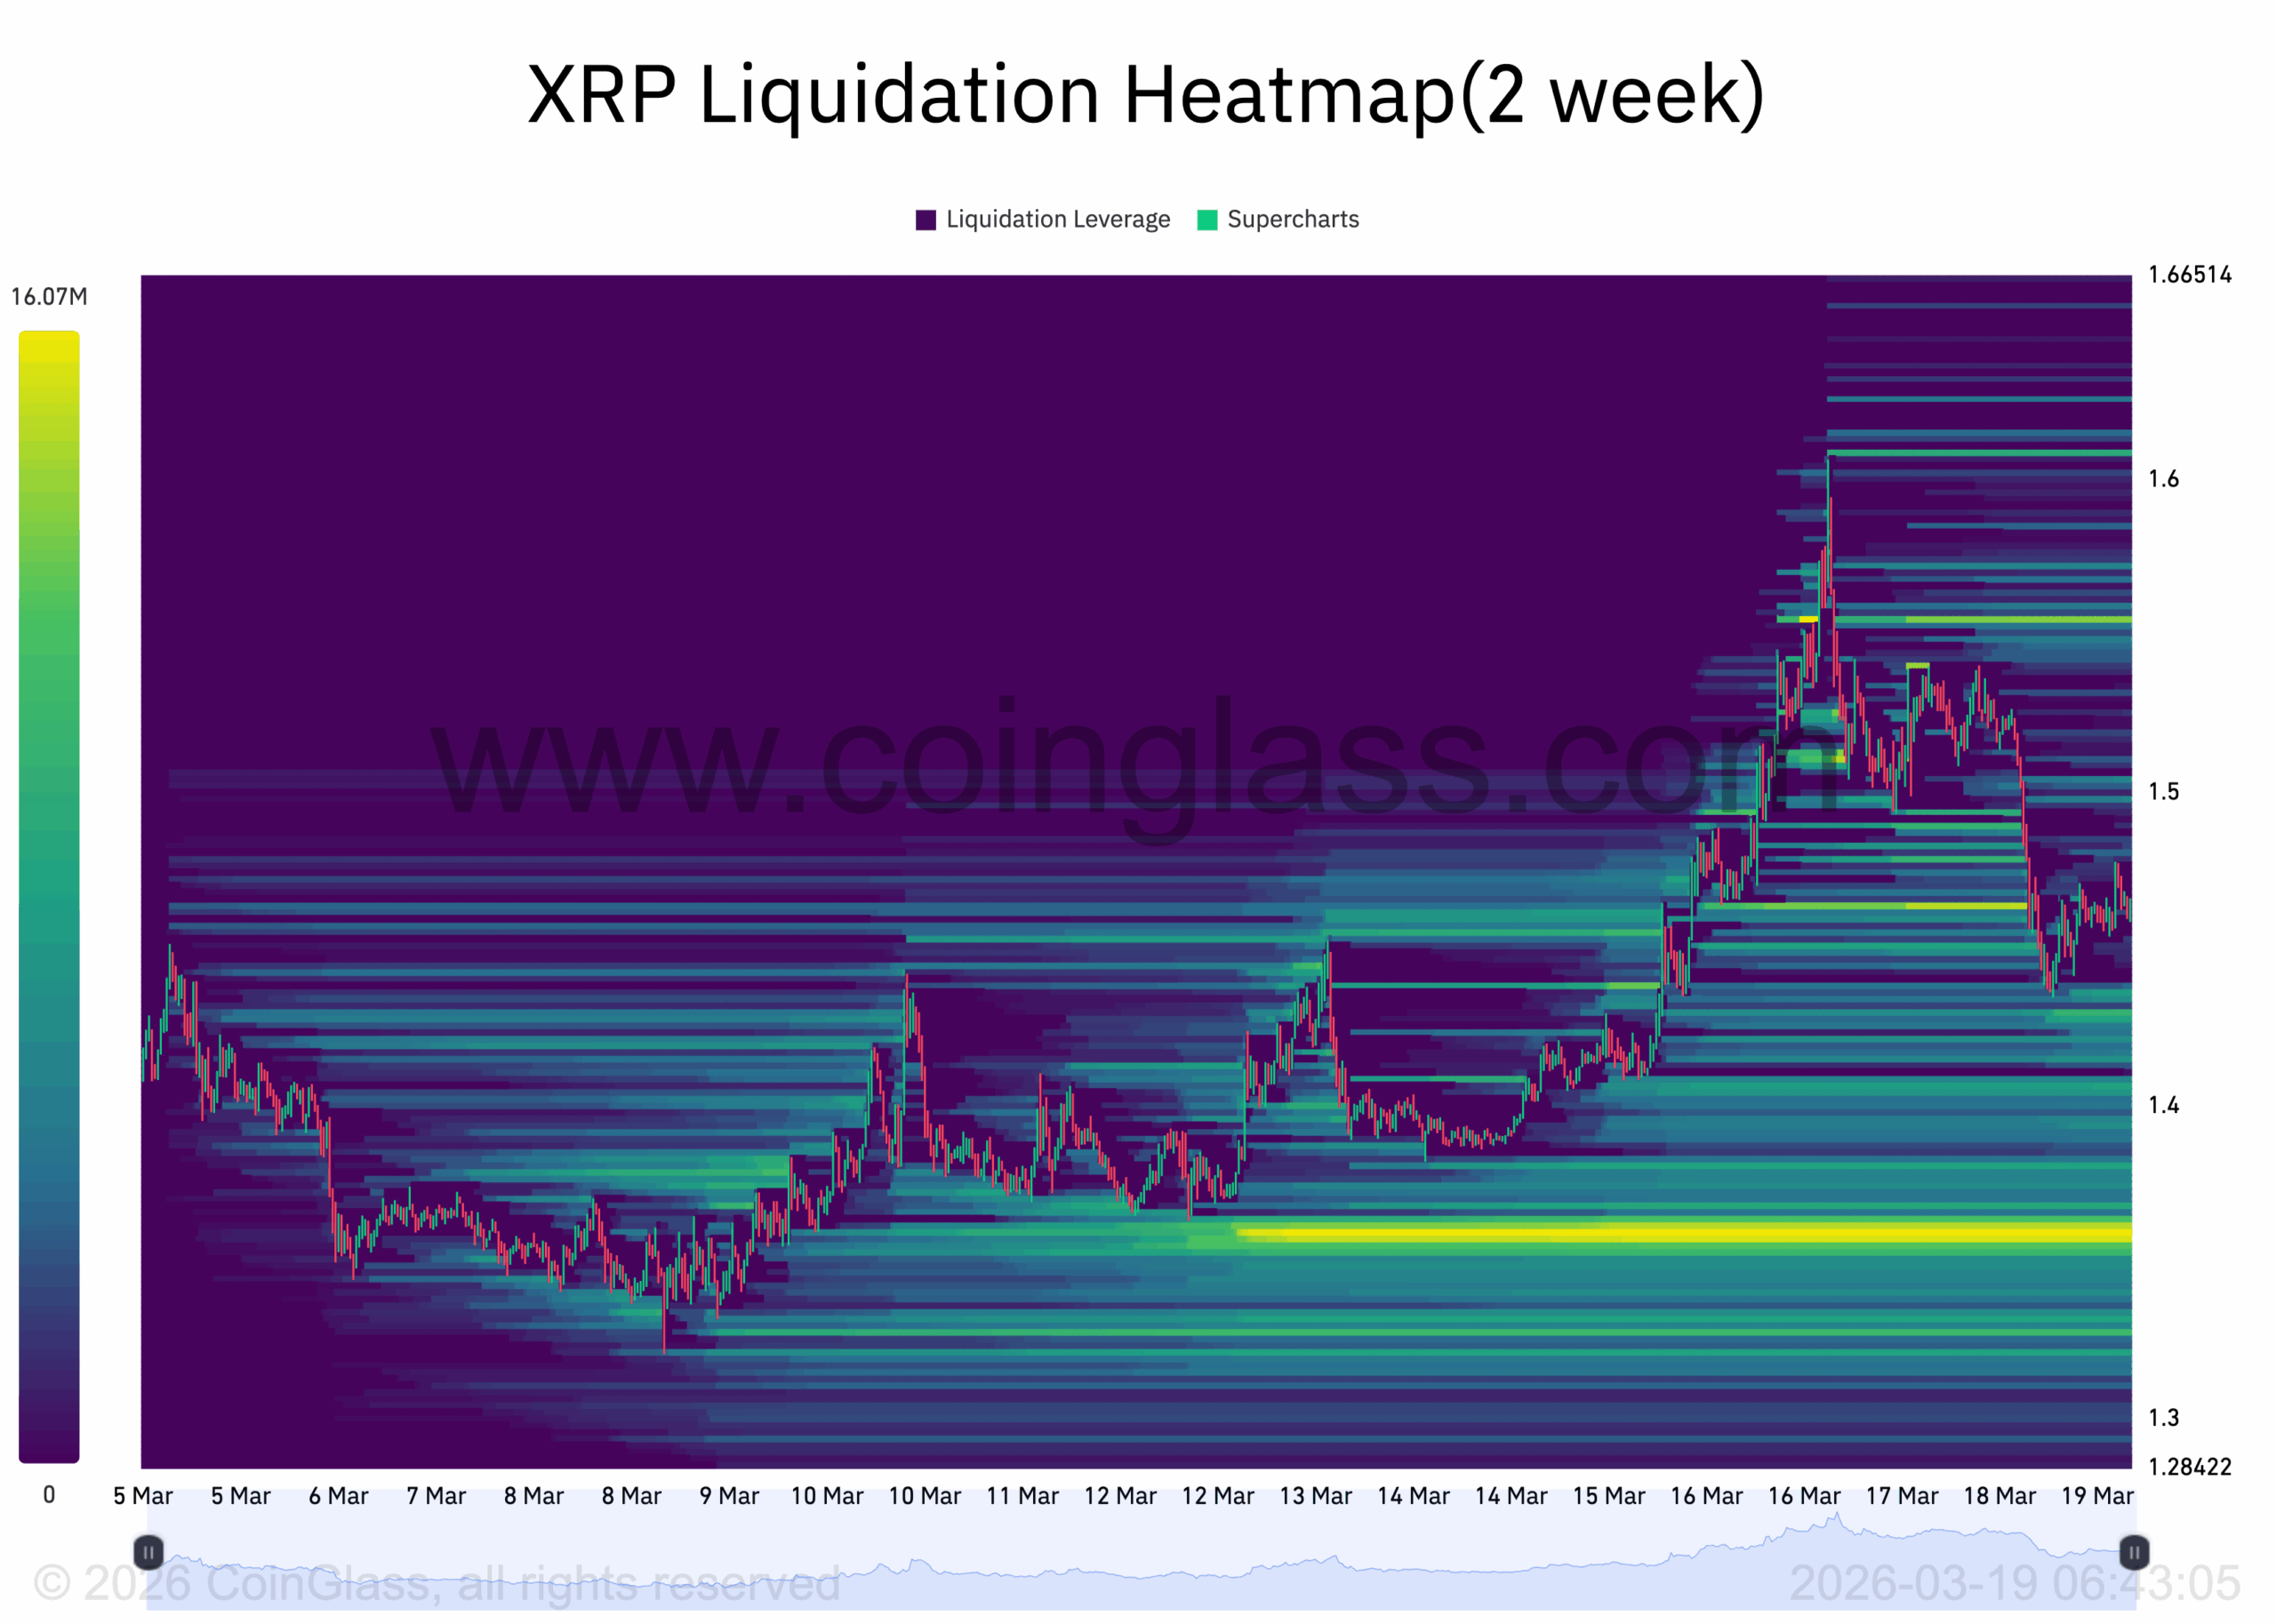
Liquidity and Derivatives Paint a Bearish Picture
According to Coinglass, XRP’s liquidation heatmap shows a notable concentration of liquidity near the $1.35 zone, sitting well below its current market price.
Liquidation heatmaps are visual tools traders use to identify price levels where large clusters of leveraged positions are likely to be liquidated.
These maps highlight areas of high liquidity, color-coded by intensity, with brighter zones indicating greater liquidation potential.
In XRP’s case, the dense cluster in the $1.35 price zone indicates an exceptionally high concentration of leveraged exposure at those levels.
These liquidity-dense zones typically act as magnets for price action. Markets tend to gravitate toward these areas, triggering liquidations before establishing a new directional move.
With a significant cluster sitting below XRP’s current price and no strong demand to pull it higher, the token faces a structural pull toward $1.35.
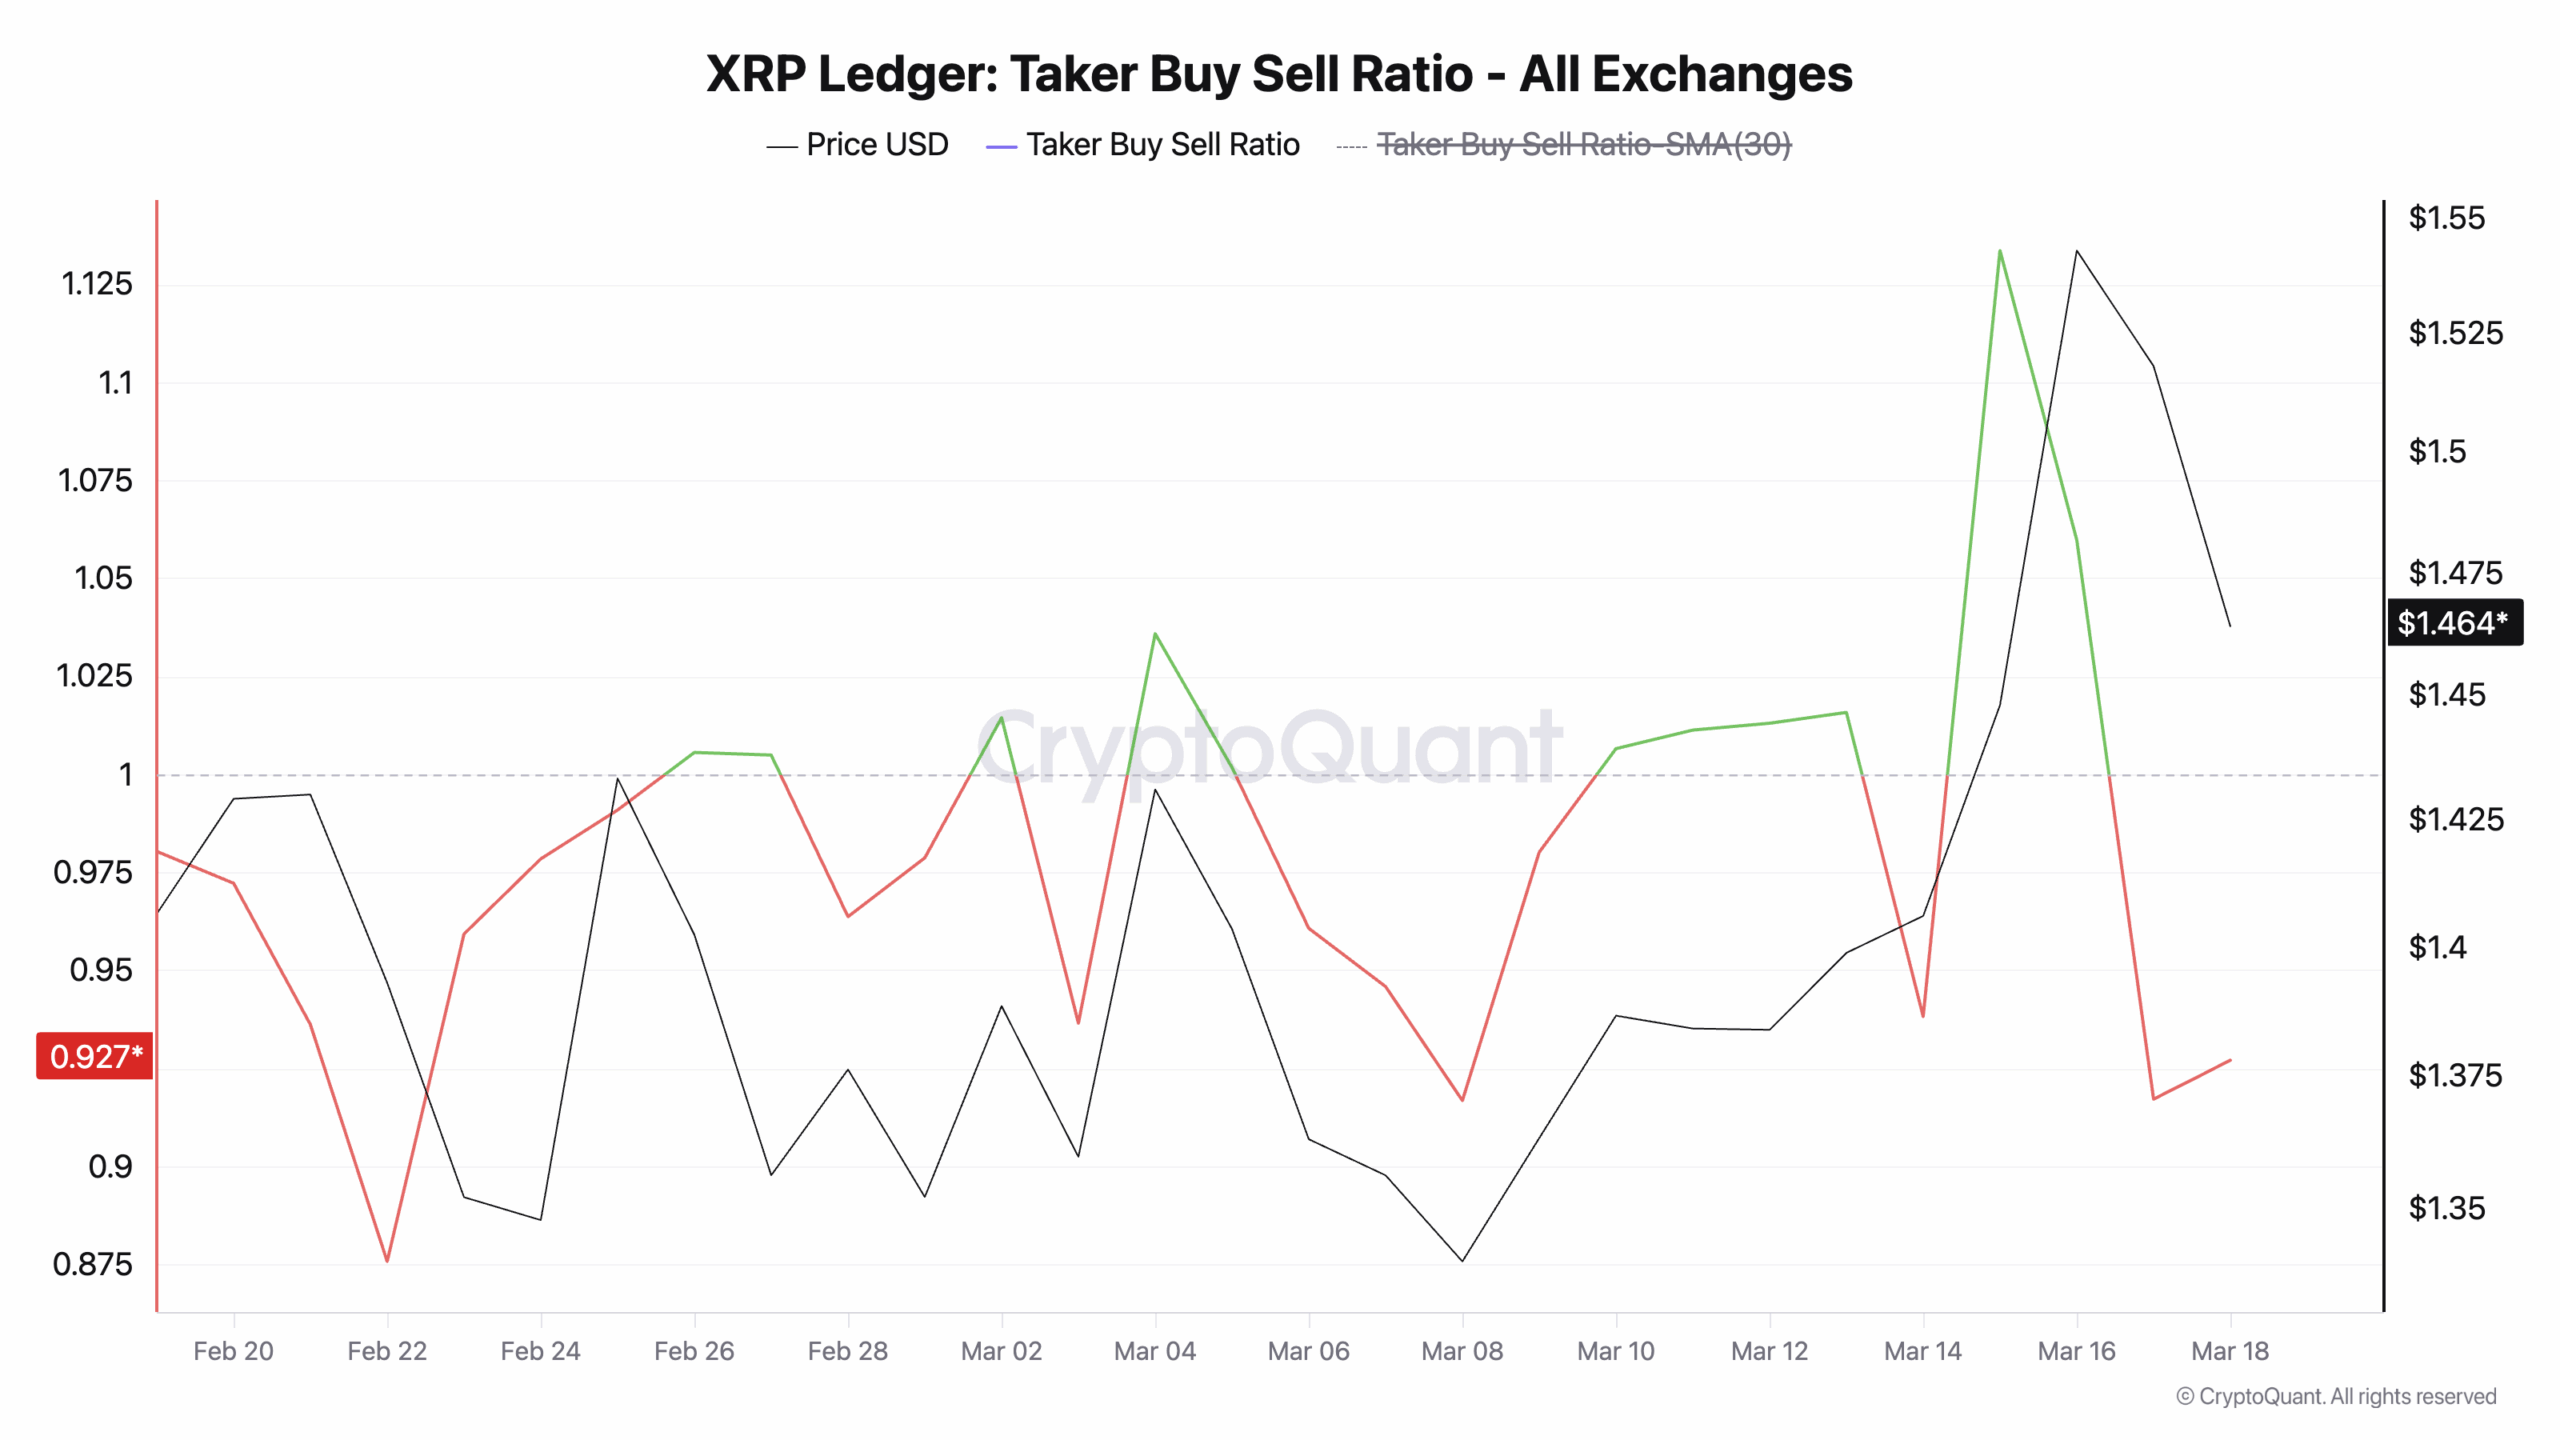
Moreover, readings from XRP’s Taker-Buy-Sell Ratio support this bearish outlook. This ratio on major exchanges has dipped back below zero, indicating that aggressive sellers are now controlling order flow.
Per CryptoQuant, this is 0.92, down from the 30-day high of 1.44 it logged on March 15.
An asset’s taker buy-sell ratio measures the ratio of buy to sell volumes in its futures market.
Values above one indicate more buy than sell volume, while values below one suggest that more futures traders are selling their holdings.
At 0.92, XRP’s ratio signals that aggressive sellers have regained control of futures order flow. The move from 1.44 to 0.92 in a span of days also suggests the shift is not gradual.
Sentiment among leveraged traders turned quickly once the Monday rally failed to hold, with participants now rotating from holding net long to net short.
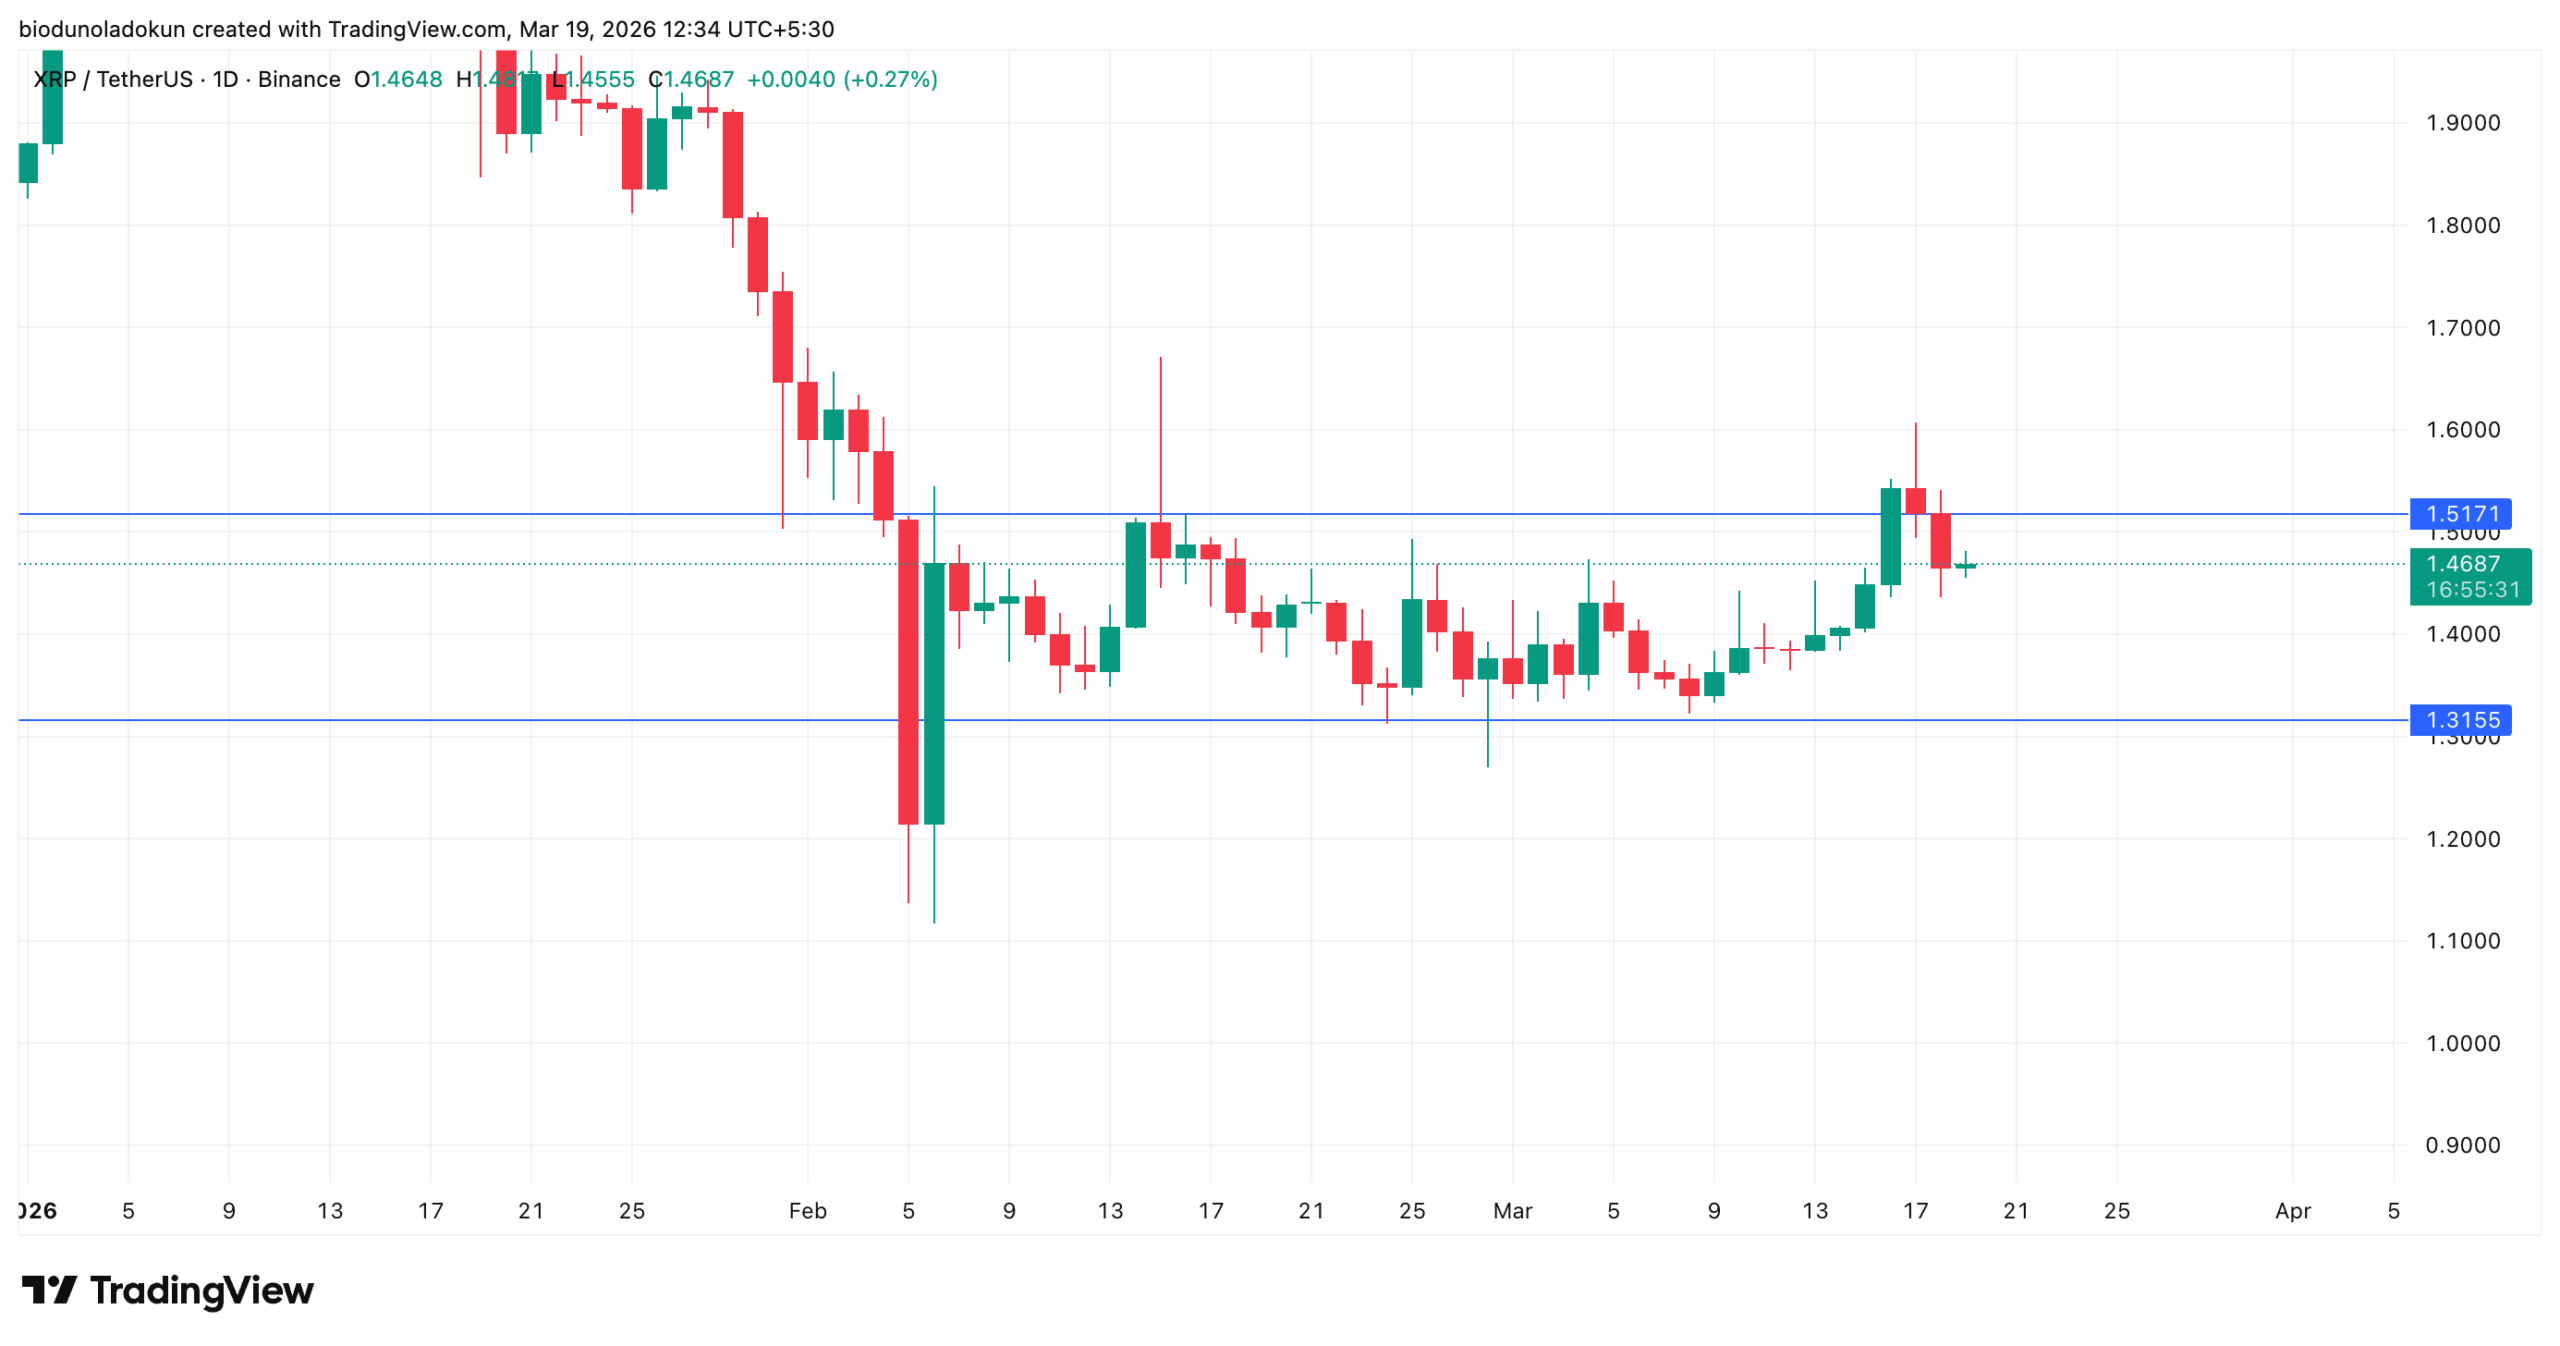
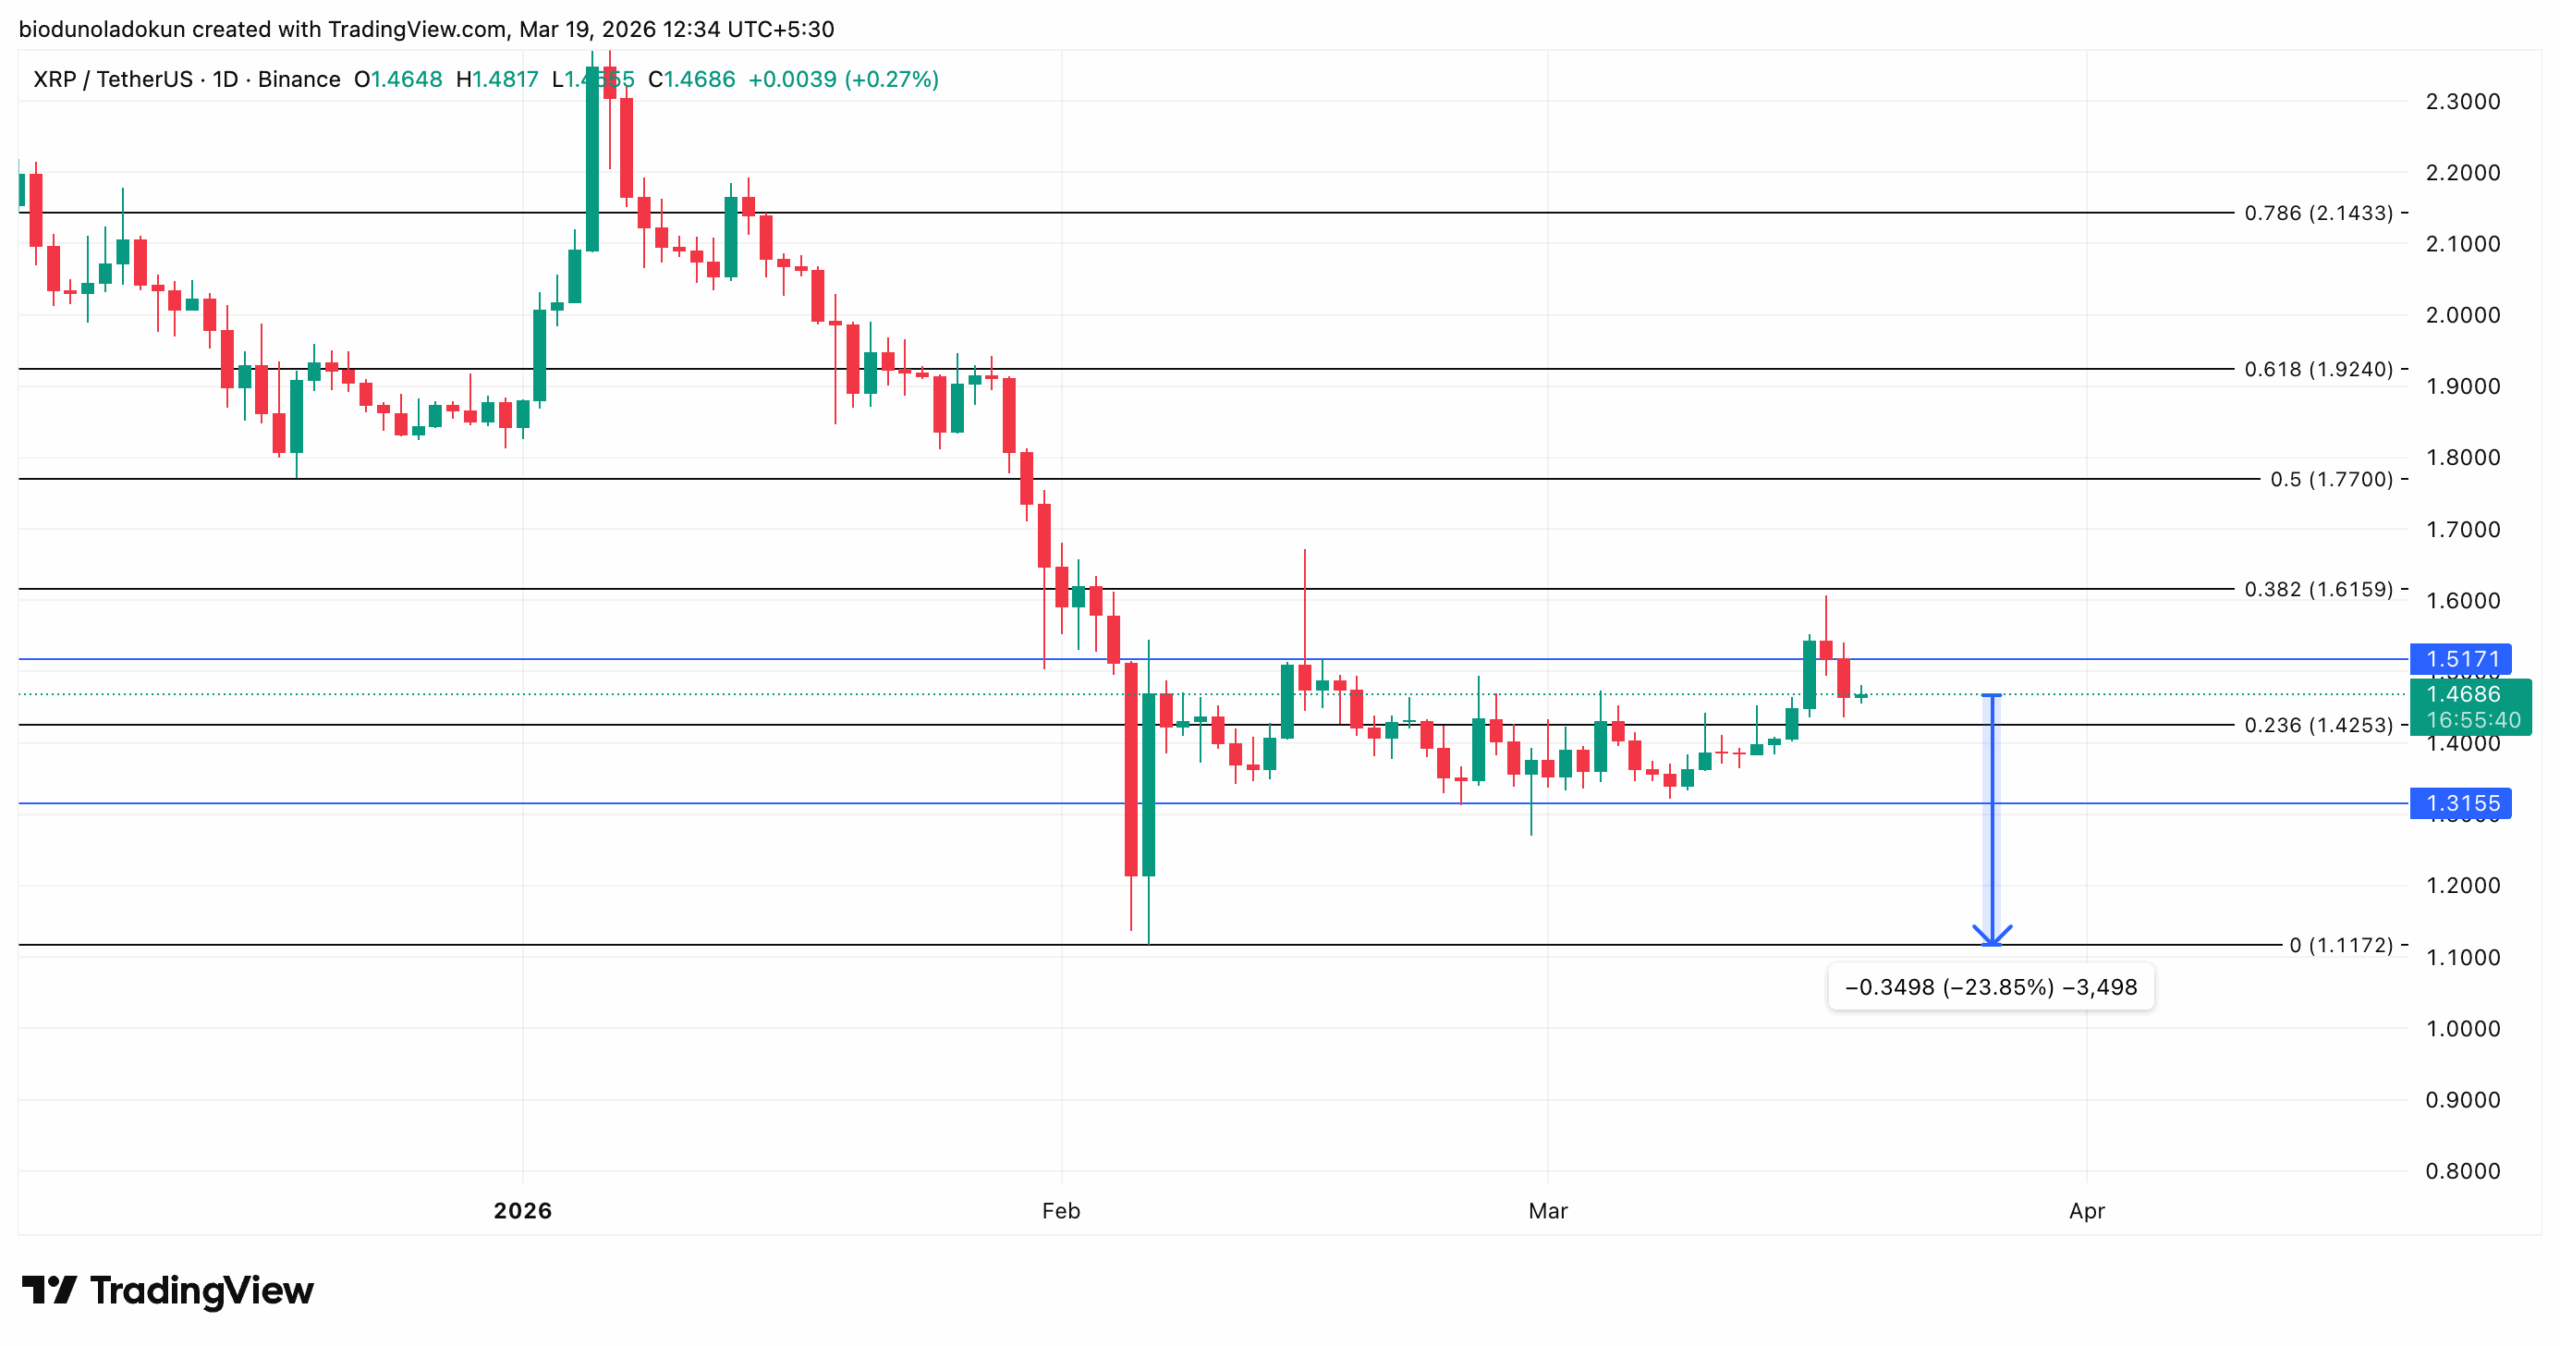
Here’s What Happens If the $1.31 line Falls
On the daily chart, XRP’s price remains wedged between resistance at $1.51 and a support floor of $1.31.
The altcoin currently hovers above the 0.236 Fibonacci retracement level at $1.42— a near-term support that, if broken, would open the door to a direct test of the $1.31 floor.
A daily close below this floor could leave XRP falling toward $1.11, marking a 24% dip from its current value.
On the other hand, a clean close above the $1.51 could lead to a resurgence in bullish interests in XRP.
If new demand enters the market, the token’s value could rise to $1.61.
[You-may-like]
Disclaimer:
The information provided in this article is for informational purposes only. It is not intended to be, nor should it be construed as, financial advice. We do not make any warranties regarding the completeness, reliability, or accuracy of this information. All investments involve risk, and past performance does not guarantee future results. We recommend consulting a financial advisor before making any investment decisions.
Abiodun Oladokun is a Research Analyst at CCN, where he covers cryptocurrency markets with a focus on on-chain analysis, technical assessments, and emerging trends across decentralized finance (DeFi), real-world assets (RWA), artificial intelligence (AI), decentralized physical infrastructure networks (DePIN), Layer 2s, and meme coins.
Prior to CCN, he served as a Senior On-Chain Analyst at BeInCrypto, producing market reports spanning diverse crypto sectors.
Before that, he conducted technical analysis and market assessments of various altcoins at AMBCrypto, where he also contributed long-form quarterly research papers on DeFi, NFTs, DAOs, and scaling architectures, leveraging on-chain platforms including Messari, Santiment, DefiLlama, and Dune Analytics.
He began his crypto career as a research analyst at SixthSense DAO, developing blockchain forensic tools to trace the history of stolen assets.
Abiodun is a lawyer called to the Nigerian Bar and the founder of Ilé Ijó, a Lagos-based electronic dance music collective.