Is a DOT trend reversal finally here? | Credit: Hameem Sarwar
Share
Key Takeaways
DOT faces strong resistance near $1.65, stalling its rally and signaling weakening bullish momentum.
Momentum is fading as the RSI drops below the midline and the AO indicator prints weaker bars.
A breakout above $1.70 could trigger a move toward $2, but failure may send DOT’s price to $1.30.
In recent times, Polkadot (DOT) price has been inching closer to retest its yearly high.
At some point, DOT closed in on hitting $2. Yet, as of this writing, the breakout has not arrived.
What exactly is stopping it, and more importantly, what changes it?
Let’s find out in the Polkadot price analysis.
Polkadot Rally Stalls
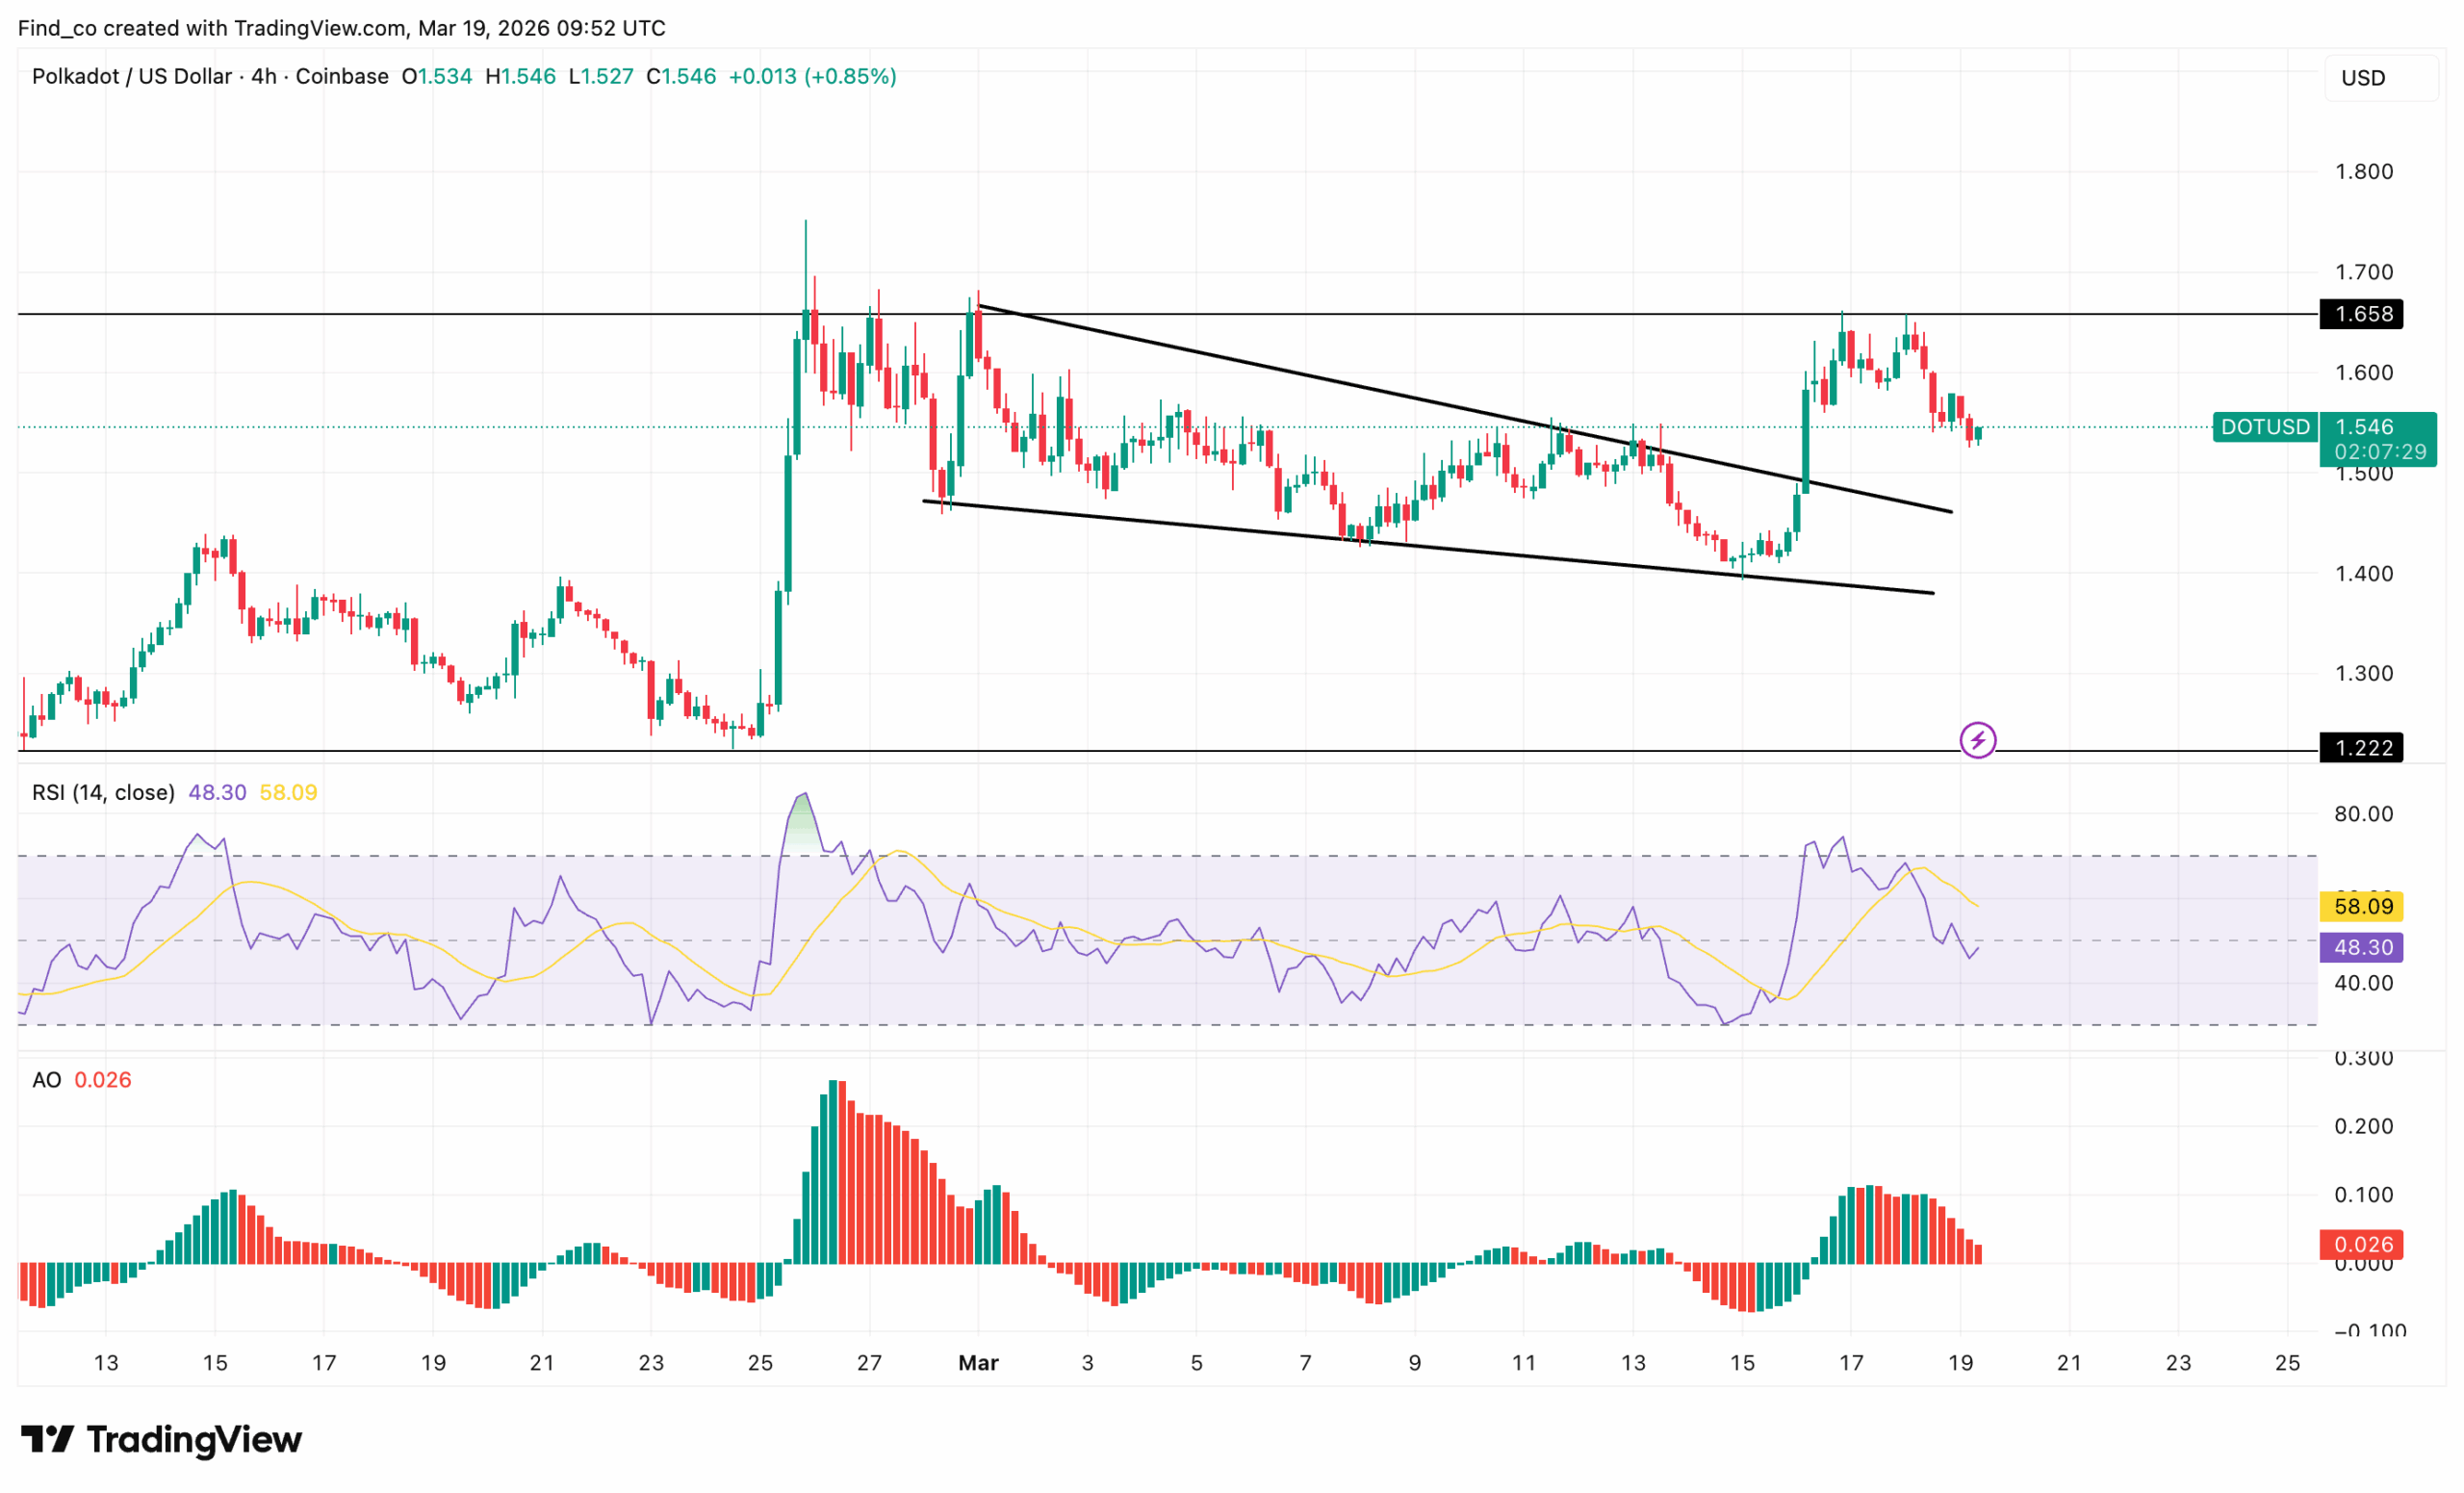
DOT rallied aggressively from recent lows, printing a higher high. However, the move stalled just below the $1.65 resistance zone.
On the 4-hour chart, DOT’s price is now forming a descending channel. This pattern reflects controlled selling rather than panic dumping. Still, it shows that buyers are losing short-term control.
Momentum indicators confirm the slowdown. The Relative Strength Index (RSI) has dropped below the midline at 45.38 after briefly approaching overbought territory. This signals fading bullish strength.
At the same time, the Awesome Oscillator (AO) is printing smaller green bars. Although still on the positive side, the move indicates a decline in upside momentum.
Current price movements show that DOT sits in a neutral-to-bearish phase below $1.60, with momentum needing a fresh catalyst to shift higher.
If buyers step in and break above $1.70, momentum could accelerate quickly. In that case, the next target sits near $1.75, where stronger resistance lies.
Exchange Outflows Persist
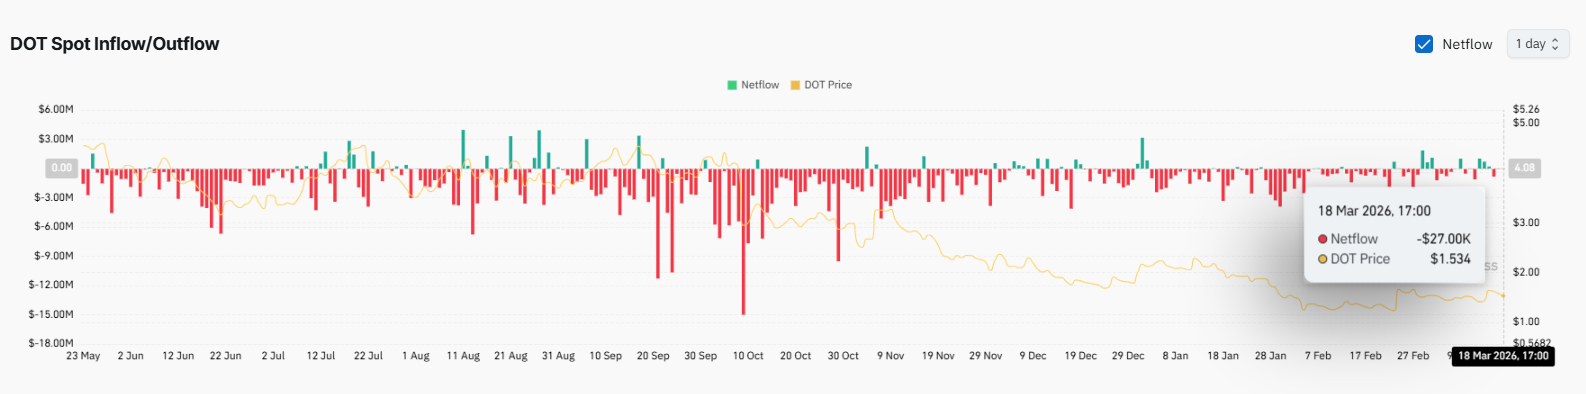
On-chain data reveals persistent outflows, with the latest net flow declining by $27,000. Selling pressure has eased compared to earlier spikes near $15 milion.
On the daily chart, DOT remains under structural pressure despite a short-term recovery.
While buyers have stepped in, the broader trend remains bearish, as Polkadot’s price continues to trade below key Fibonacci resistance levels.
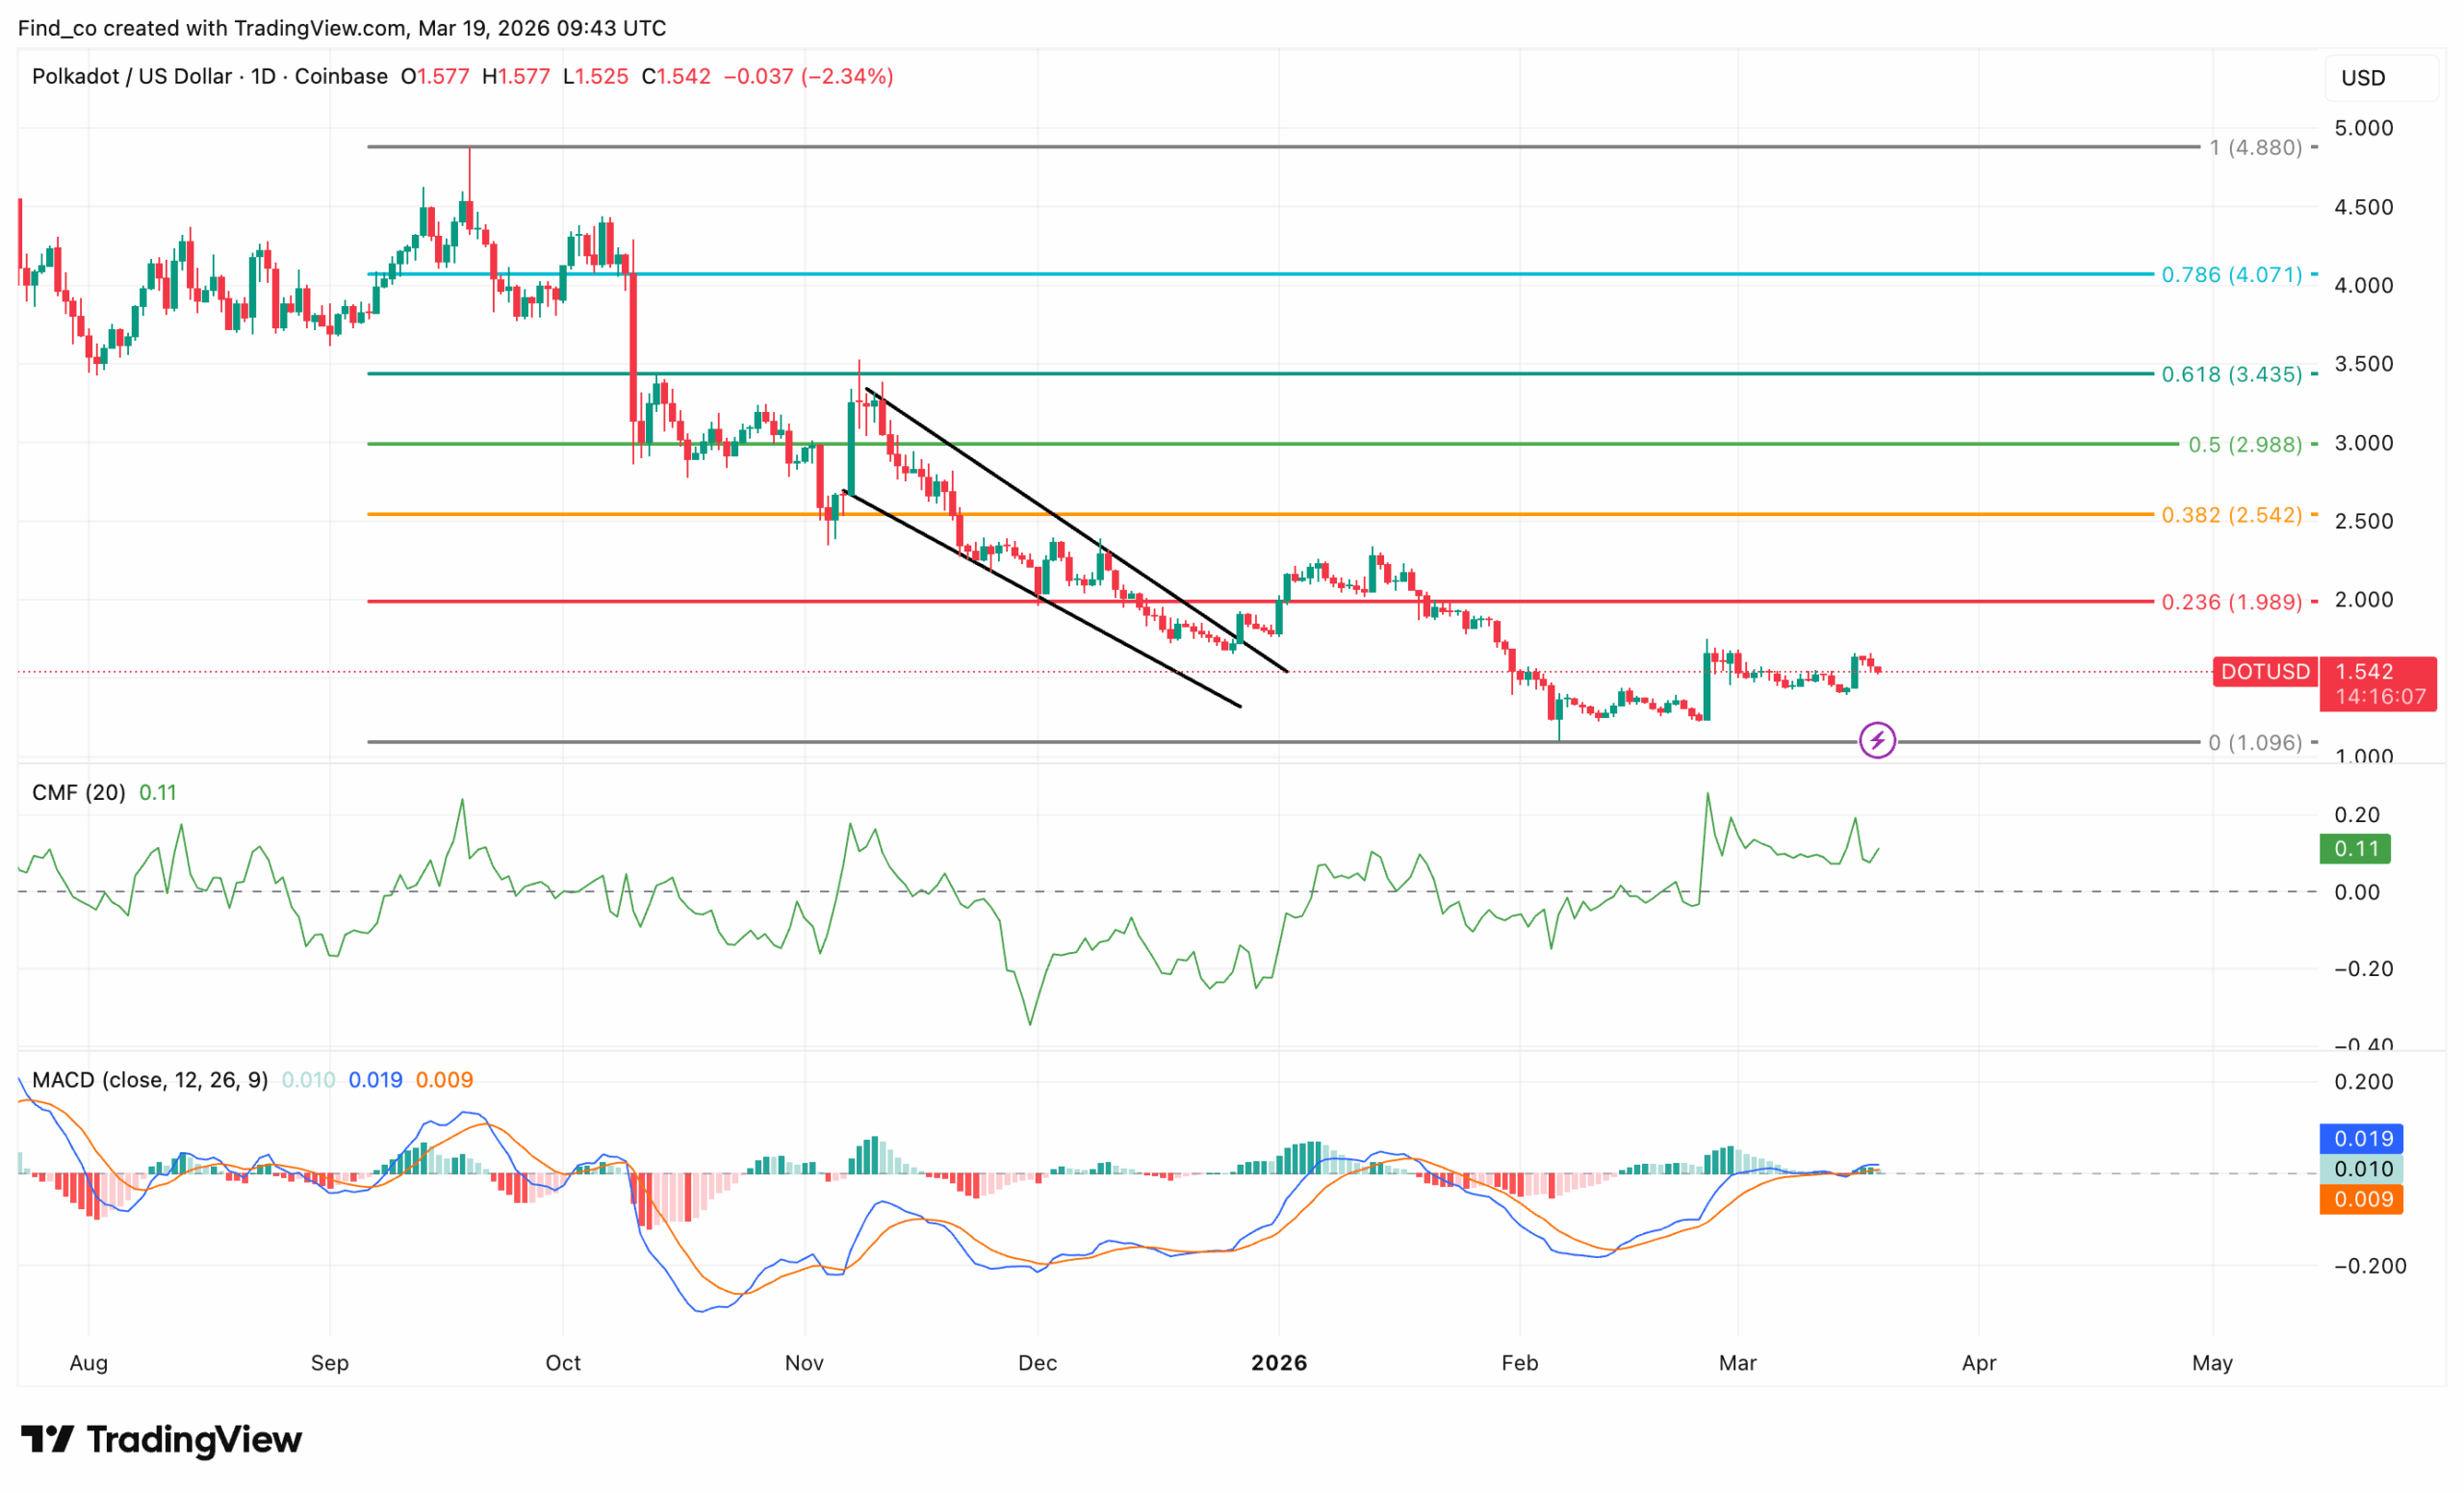
The daily chart shows a clear downtrend that began after DOT lost the $3.46 level (0.618 Fib). Since then, DOT’s price has printed consistently lower highs and lower lows.
More importantly, the descending channel formation through February confirms sustained seller dominance. However, momentum is shifting.
Recently, DOT bounced from the $1.10 base (0 Fib), which now acts as strong support. At the same time, the price has broken out of the descending channel, signaling a potential trend transition.
Still, the breakout lacks conviction for now.
Meanwhile, the $2 region (0.236 Fib) stands as immediate resistance. Furthermore, Polkadot’s price already faced rejection near this zone, indicating that sellers remain active on rallies.
If bulls fail to reclaim this level, the recovery risks turning into another lower high.
On the indicator side, the Chaikin Money Flow (CMF) has turned positive.
Therefore, this shift indicates capital inflows are gradually returning to the market. So, while accumulation is present, it is not yet strong enough to confirm a full reversal.
At the same time, the Moving Average Convergence Divergence (MACD) is attempting a bullish crossover. Histogram bars are flipping green, and the signal lines are converging upward.
This suggests improving momentum. Yet, the move is still in its early stages, meaning confirmation is needed before calling a sustained uptrend.
Looking ahead, the structure remains fragile. If DOT’s price reclaims $2 and holds above it, momentum could accelerate toward $2.56 (0.382 Fib).
On the flip side, failure to build strength above current levels likely sends the price back toward the $1.30 demand zone.
Disclaimer:
The information provided in this article is for informational purposes only. It is not intended to be, nor should it be construed as, financial advice. We do not make any warranties regarding the completeness, reliability, or accuracy of this information. All investments involve risk, and past performance does not guarantee future results. We recommend consulting a financial advisor before making any investment decisions.
Victor Olanrewaju is a crypto analyst and reporter at CCN with deep roots in on-chain research and technical analysis. His crypto journey began in 2017, but it was the 2020 Uniswap airdrop that sparked a full-time pivot into the space.
With a foundation in copywriting, Victor honed his craft creating high-converting content for leading crypto brokers — most notably an XRP price prediction that ranked #1 on Google during the 2021 bull run.
He later joined AMBCrypto in 2022, where he combined storytelling with technical and on-chain analysis to cover key market narratives.
In 2024, he expanded his expertise at BeInCrypto, collaborating with analysts and using tools like Glassnode, Santiment, and IntoTheBlock to break down Bitcoin and altcoin trends.
At CCN, Victor covers the top cryptocurrencies, memecoins, macro shifts, blending real-time insights with deep-dive metrics.
He holds a Bachelor’s degree in Physics from the University of Ibadan, equipping him to simplify complex data for a wide audience. Follow his work or connect on LinkedIn or X.