Polkadot’s price has fallen from its monthly high after buying volume dropped.
Attention has now turned to the $1 psychological level amid the price decline.
OI, the funding rate has decreased while indicators suggest DOT will continue to fall.
Polkadot’s (DOT) coin is at risk of giving back the gains it made in mid-March.
The mid-March gains were themselves driven by specific, time-limited catalysts. The February CPI data, which printed slightly below expectations at 2.4%, removed a key macro headwind.
Bitcoin’s brief stabilisation above $74,000 reignited altcoin risk appetite. However, none of those catalysts has sustained its influence.
The CPI relief has been overtaken by energy-driven inflation from the Middle East conflict. With barely any buying volume, here is what lies ahead for Polkadot’s price.
Polkadot Collapses
At the time of writing, Polkadot’s price is stuck in a grinding downtrend. Currently, it does not seem like the structure is improving.
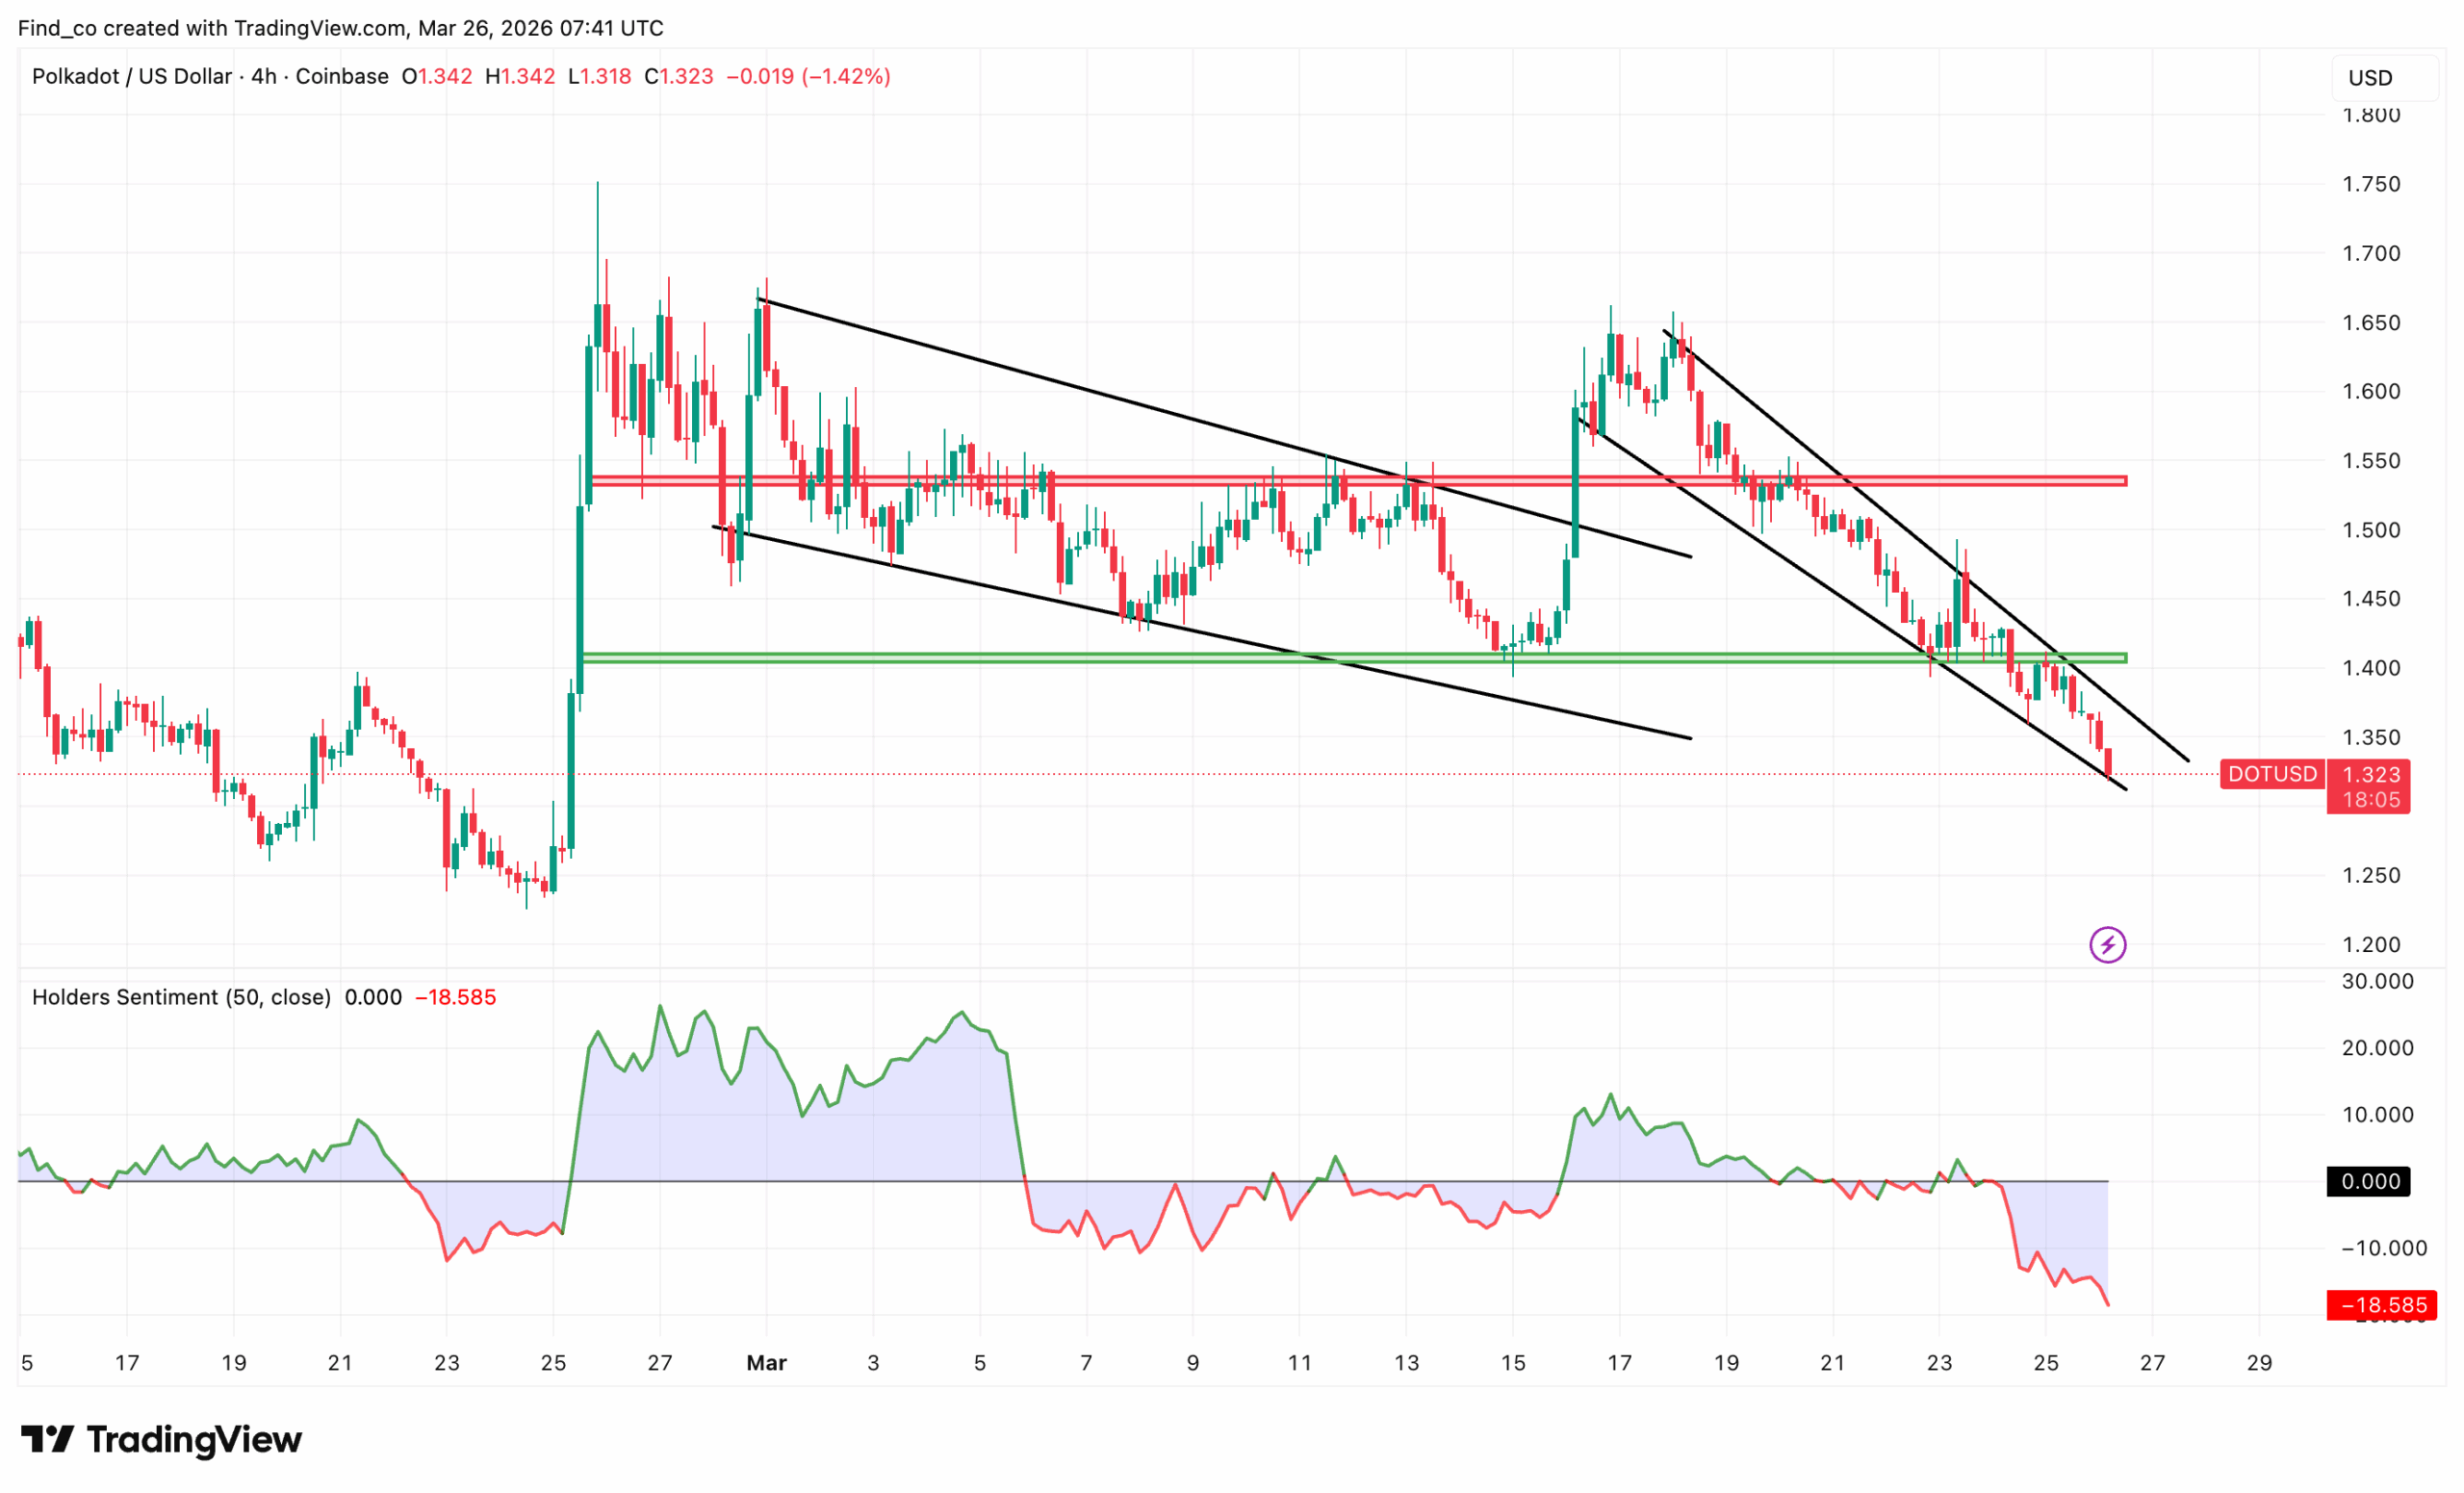
Looking at the 4-hour chart, DOT/USD trades at $1.32. Notably, the price action tells a story of two failed recoveries.
Following a spike to $1.75 on Feb. 23, DOT’s price formed a first descending channel that carried lower into early March.
A brief rally to $1.66 around March 17 offered hope. But instead of breaking free, Polkadot’s price simply formed a second, steeper descending channel, rejecting the red resistance zone at $1.55 and accelerating lower once again.
Currently, Polkadot’s price has broken below the green support zone at $1.40. Losing it is a bearish development that opens the door toward $1.25 and potentially lower.
The Holders’ Sentiment deepens the concern. At -18.585, it has just printed its most negative reading across the entire chart window.
Sentiment collapsed this week, suggesting DOT holders are actively losing confidence.
Historically, such extreme negative readings can precede contrarian bounces. However, the price structure must confirm any reversal.
Until DOT reclaims $1.40 and breaks above the descending channel, sellers may remain firmly in control.
Why $1 Has Become Critical for DOT
As a result of the current setup, the $1 threshold has become a crucial level to watch.
Notably, the $1 region carries weight that extends beyond round-number psychology for Polkadot’s price.
It represents the lower boundary of the price range within which DOT has historically experienced its most durable long-term accumulation.
A confirmed close below $1 would eliminate that demand floor.
Furthermore, sub-$1 trading would carry a specific and damaging narrative consequence for Polkadot.
The altcoin trading below $1, regardless of the macro conditions driving it, generates headlines and social media commentary that suppresses new buyer interest and accelerates existing holder exits.
However, it significantly extends it beyond the levels that pure technical analysis would identify as the key support.
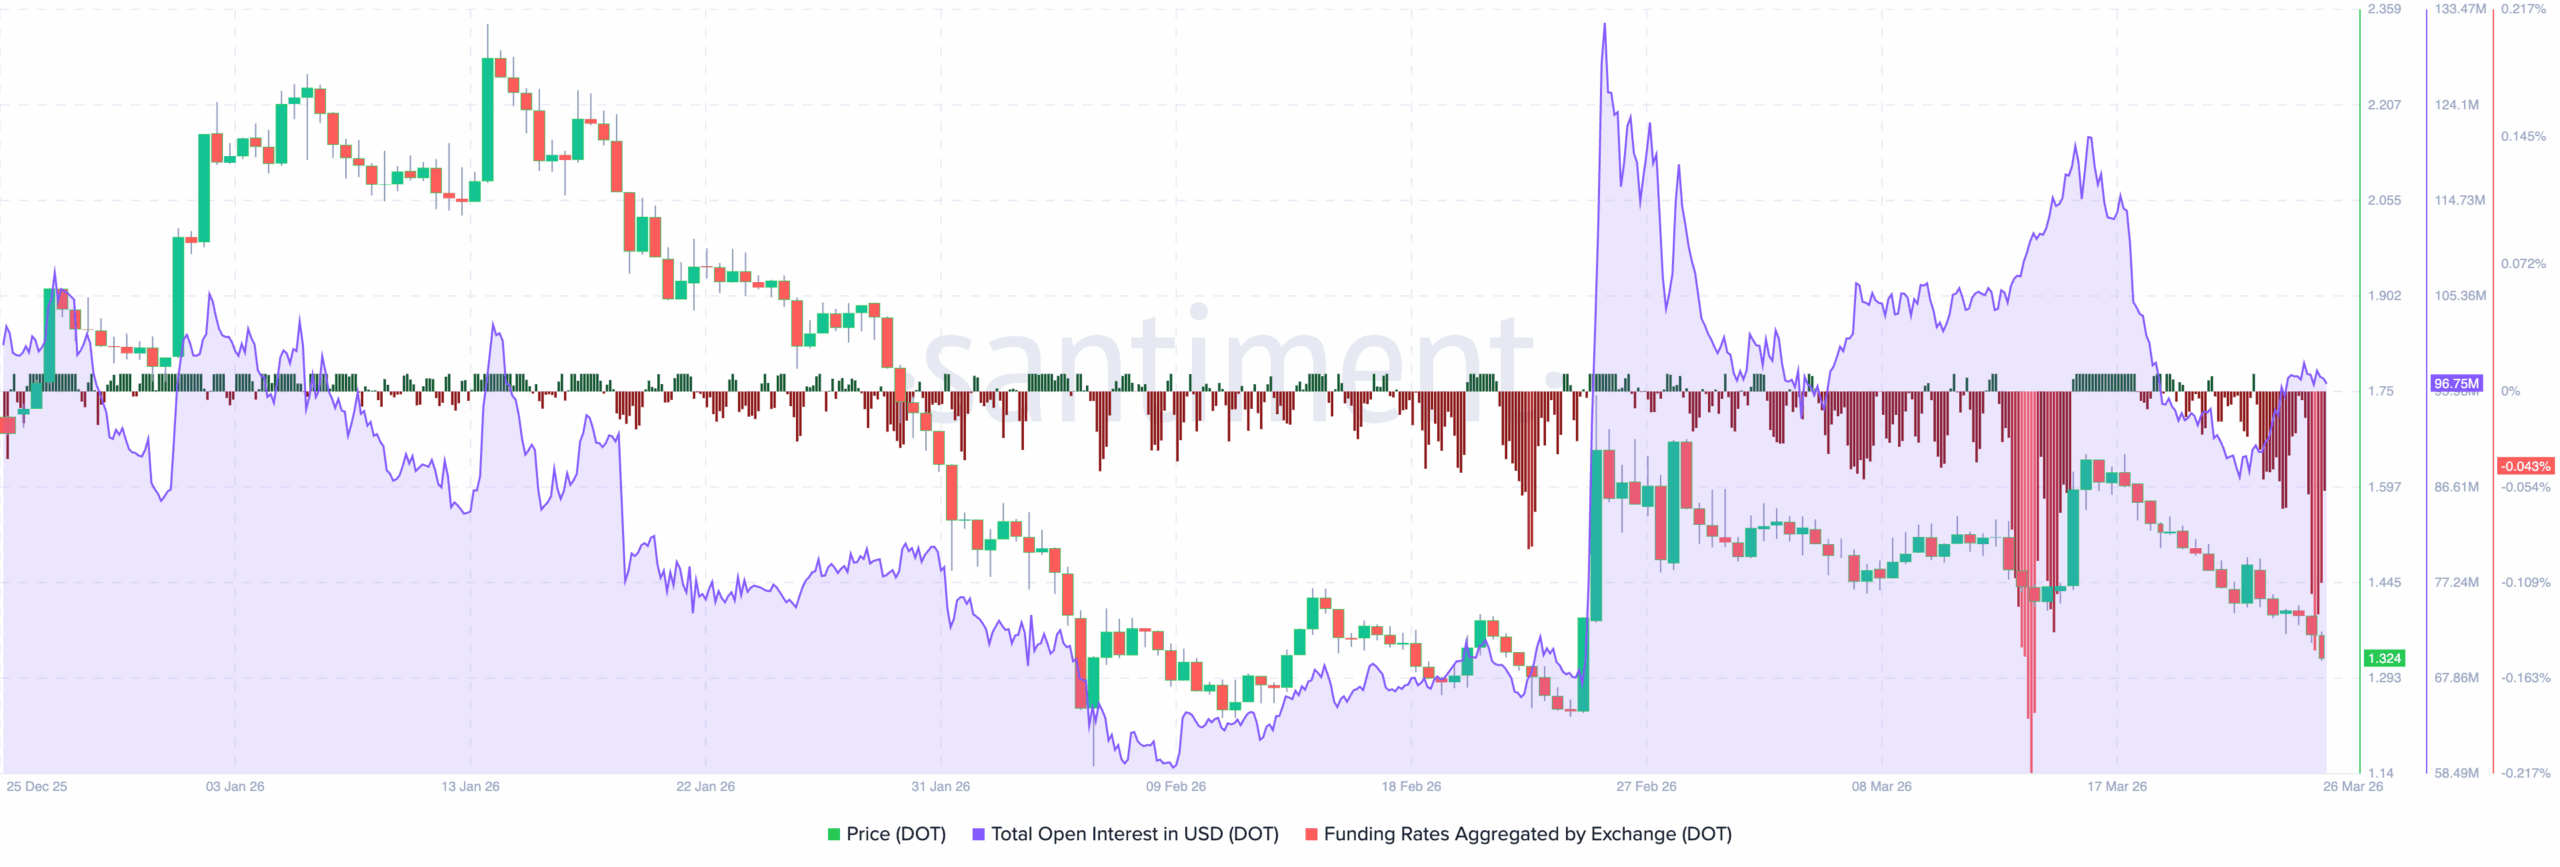
The Open Interest (OI) story is striking. After spiking to $135 million during the Feb. 23 price surge, the OI collapsed.
Since then, it has drifted steadily lower, now sitting near $98.75 million. Declining open interest alongside falling prices confirms that traders are closing positions and not building new longs.
That’s not a sign of a healthy correction. Besides that, the funding rate tells the sharpest story.
Currently at -0.043%, it has been persistently negative throughout March. Negative funding means short sellers are paying longs to keep their positions open.
While that confirms bearish momentum, it simultaneously builds the conditions for a short squeeze. Notably, a similar setup occurred in early February.
DOT Open Interest and Funding Rate | Credit: Santiment
During that period, funding went negative, OI fell, and the price was depressed to near $1.29. What followed was the explosive Feb. 23 rally to $1.75.
While the pattern is familiar, it does not seem like Polkadot’s price will follow this same trend this time.
DOT Price Prediction: Lower
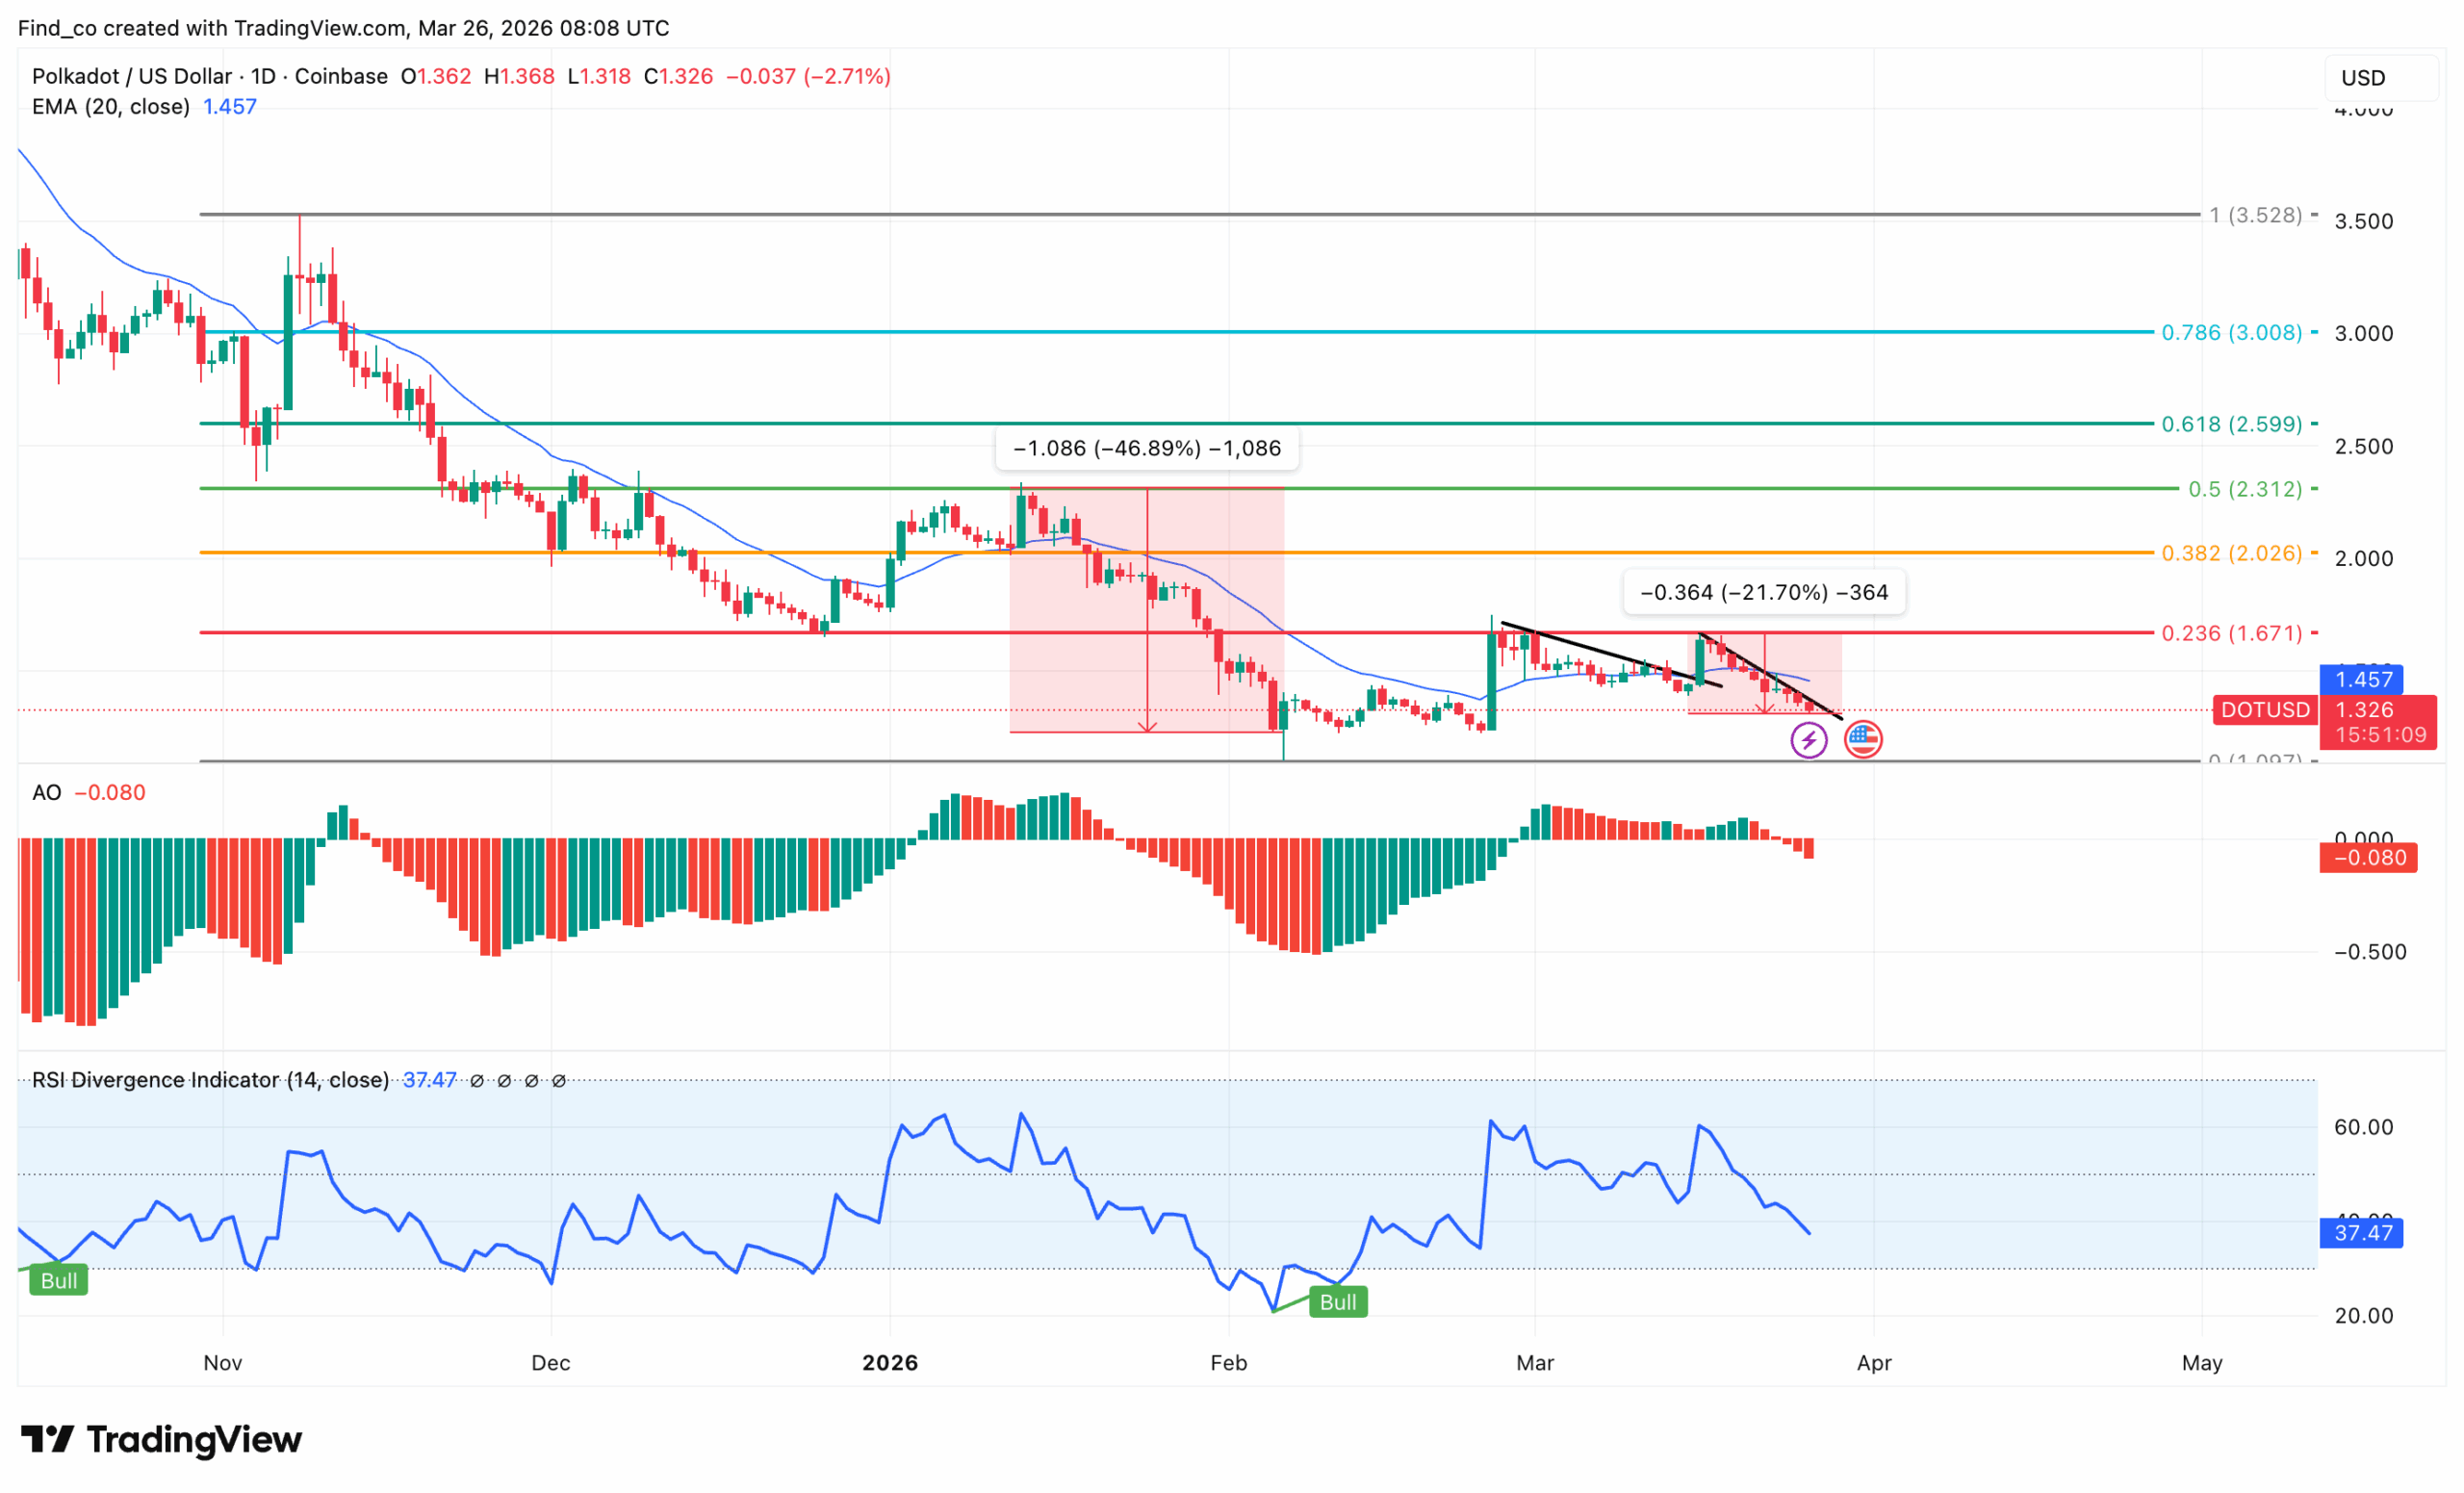
On the daily chart, DOT dropped to $1.33 on March 26, and the Fibonacci map reveals just how bad the current position is.
The decline has been relentless. From highs near $3.53, DOT’s price has shed 46.89% in the first leg down, then a further 21.70% in the current downtrend.
At the time of writing, Polkadot’s price sits just above the zero Fibonacci level at $1.10.
The 20 EMA at $1.46 sits well above as overhead resistance, adding further weight to any recovery attempt.
The indicators offer little comfort. The Awesome Oscillator (AO) reads -0.080, negative and declining after a brief green period in early March.
Momentum is firmly in bearish territory. Meanwhile, the RSI at 37.47 is approaching oversold levels but hasn’t reached the extreme lows that previously triggered the bullish divergence signals in October and February.
That’s actually the most important nuance here. Both prior RSI bullish divergence signals preceded significant bounces.
The RSI is falling again, but hasn’t yet reached those prior divergence lows.
A third divergence signal forming near current levels could be the most powerful yet, given the extreme negative funding rates and deeply negative holder sentiment already in place.
On the contrary, if buying pressure increases, this trend might change. In that scenario, DOT’s price might break past the resistance line and surge to $1.67.
Disclaimer:
The information provided in this article is for informational purposes only. It is not intended to be, nor should it be construed as, financial advice. We do not make any warranties regarding the completeness, reliability, or accuracy of this information. All investments involve risk, and past performance does not guarantee future results. We recommend consulting a financial advisor before making any investment decisions.
Victor Olanrewaju is a crypto analyst and reporter at CCN with deep roots in on-chain research and technical analysis. His crypto journey began in 2017, but it was the 2020 Uniswap airdrop that sparked a full-time pivot into the space.
With a foundation in copywriting, Victor honed his craft creating high-converting content for leading crypto brokers — most notably an XRP price prediction that ranked #1 on Google during the 2021 bull run.
He later joined AMBCrypto in 2022, where he combined storytelling with technical and on-chain analysis to cover key market narratives.
In 2024, he expanded his expertise at BeInCrypto, collaborating with analysts and using tools like Glassnode, Santiment, and IntoTheBlock to break down Bitcoin and altcoin trends.
At CCN, Victor covers the top cryptocurrencies, memecoins, macro shifts, blending real-time insights with deep-dive metrics.
He holds a Bachelor’s degree in Physics from the University of Ibadan, equipping him to simplify complex data for a wide audience. Follow his work or connect on LinkedIn or X.