The February CPI revealed headline inflation cooled, coming in slightly below the 2.5% consensus.
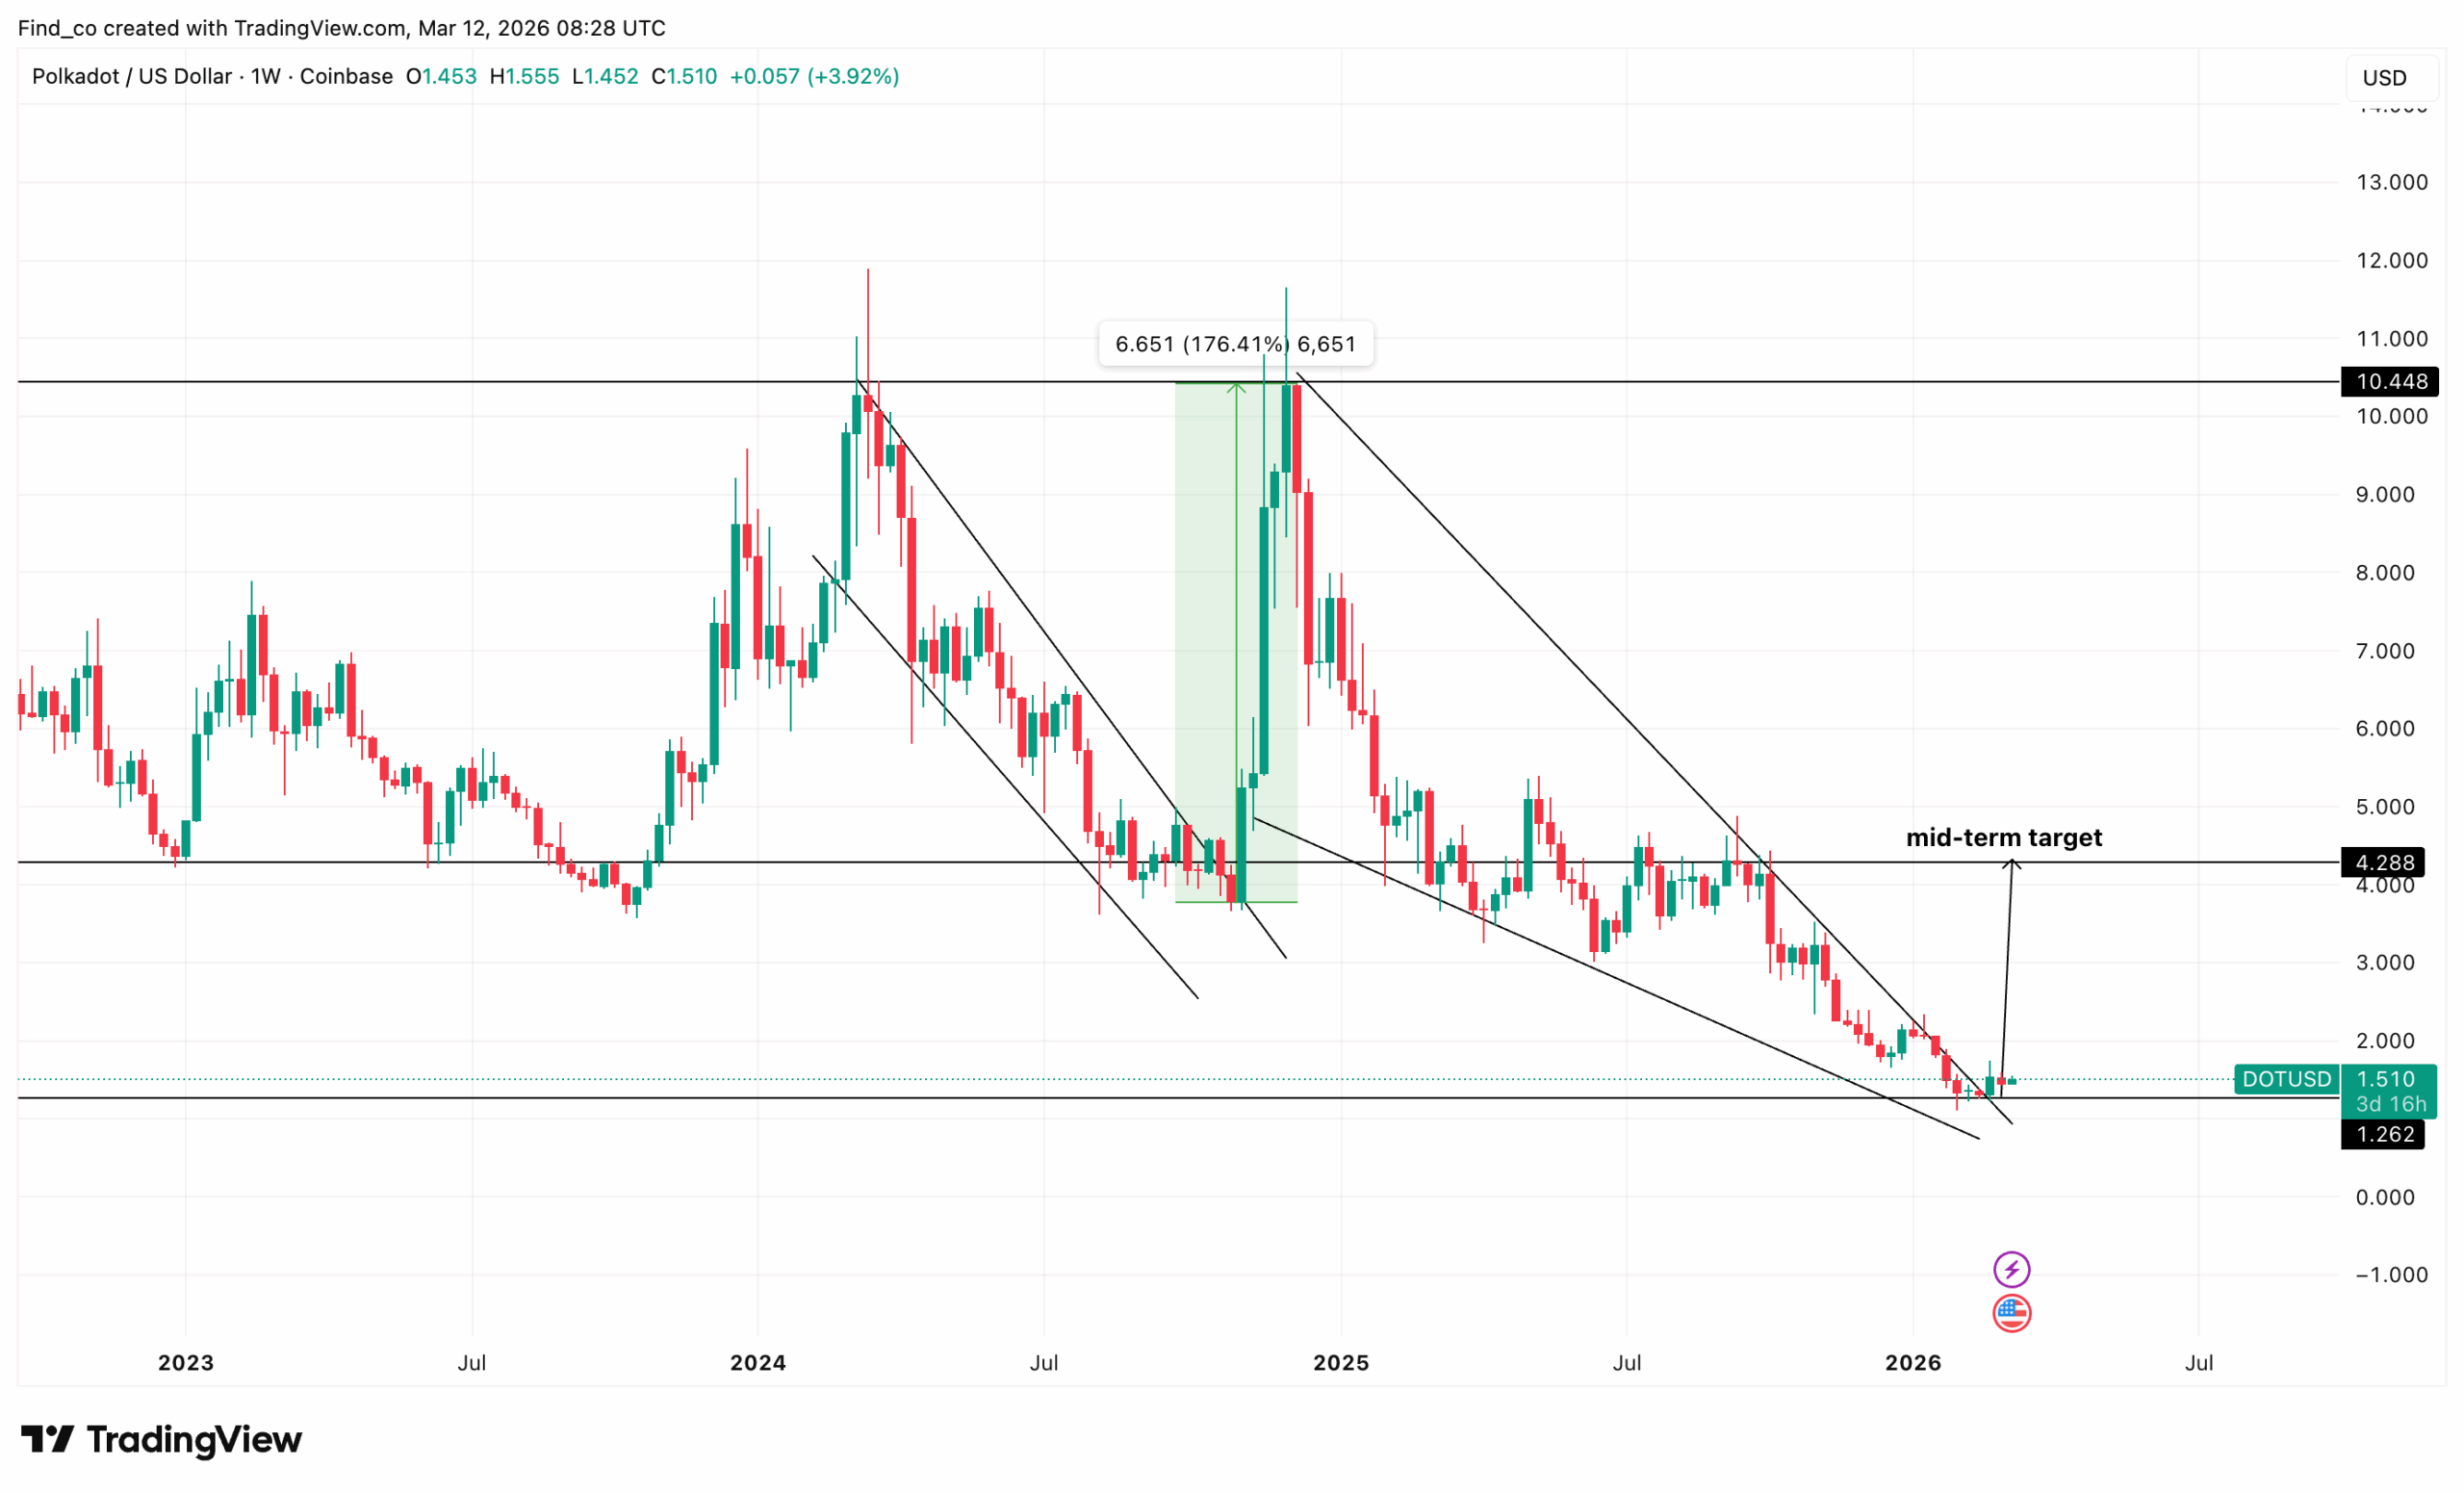
On the weekly chart, Polkadot’s price is flirting with the apex of a major descending channel.
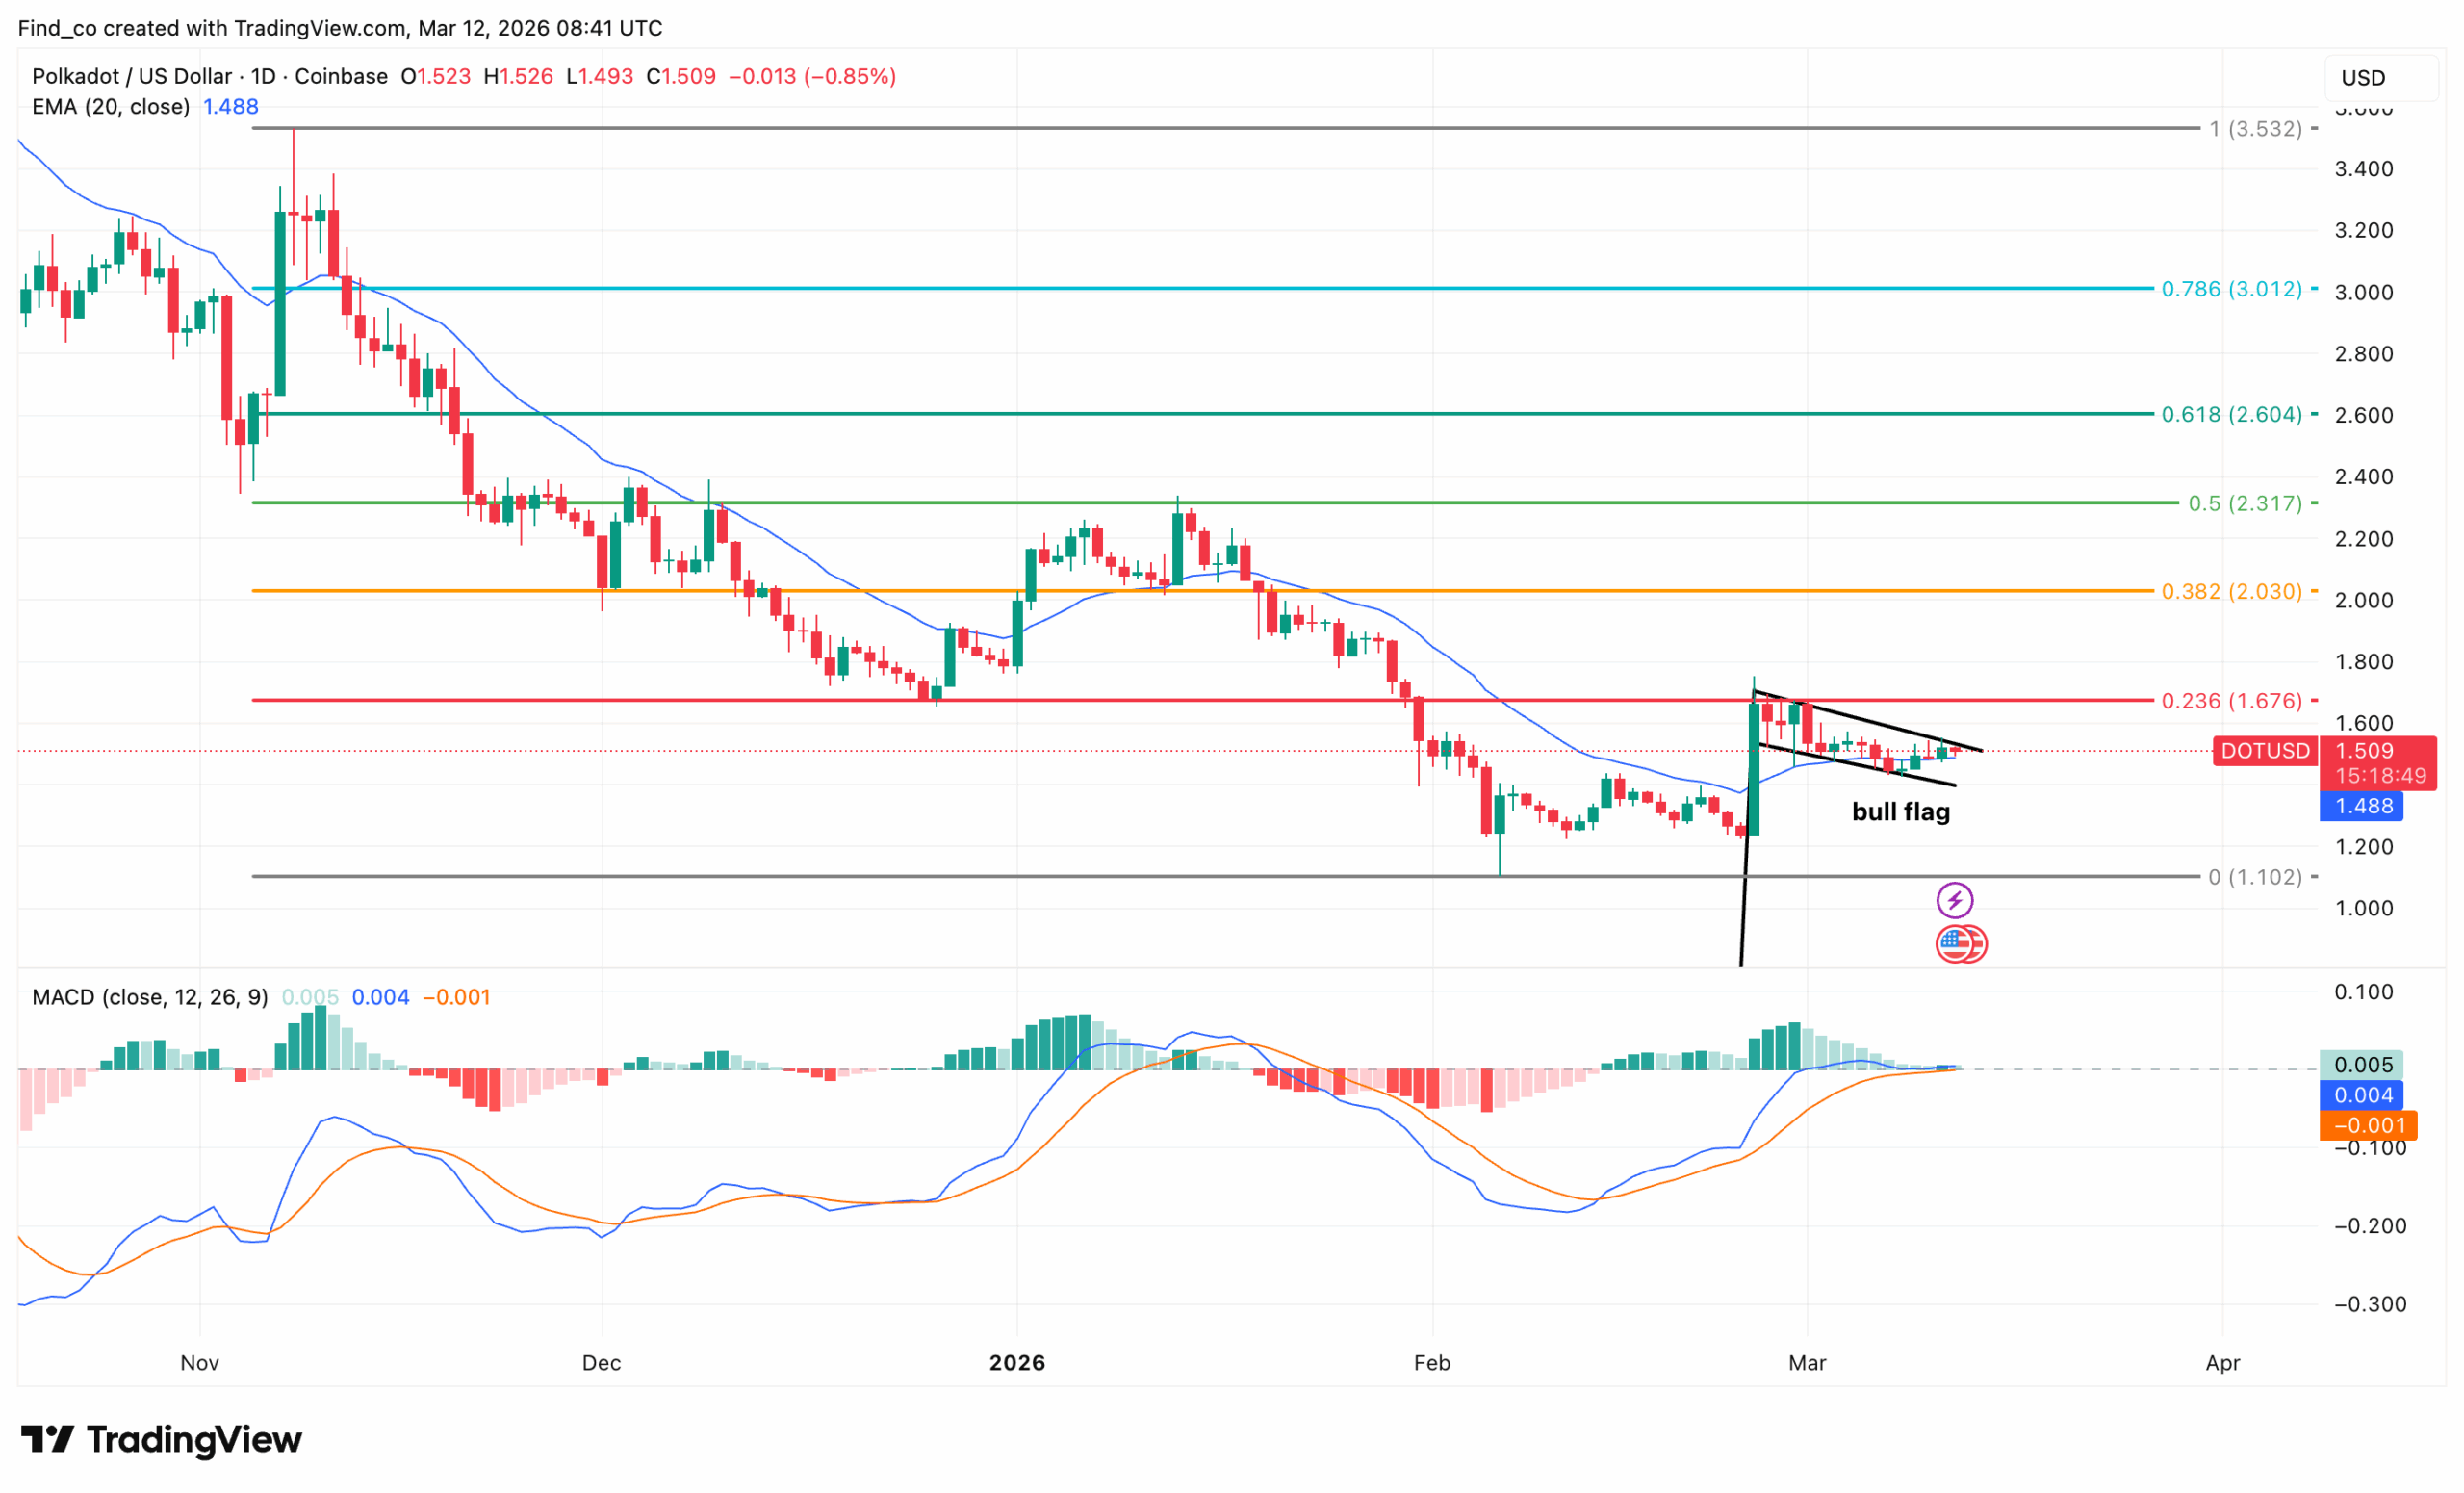
DOT is consolidating in a bull flag pattern between $1.49 and $1.52 on the daily chart.
Timing is everything in crypto.
On March 11, the Bureau of Labor Statistics released the February 2026 Consumer Price Index (CPI) report.
The data landed exactly the way risk assets needed it to. Headline inflation came in at 2.4% year-over-year, slightly below the 2.5% consensus expectation. Core CPI held exactly in line at 2.5% annually and 0.2% month-over-month.
While this did not trigger a broader market rebound, it offered a sign of relief. As a result, altcoins, including Polkadot (DOT), did not drop.
In this analysis, CCN explains how this could drive the Polkadot price higher after its 17% rally over the last 30 days.
Polkadot
Looking at the weekly chart, DOT’s current position is starkly out of historical context.
DOT trades at $1.51, up 3.92% this week. At the time of writing, the coin is flirting with the apex of a descending channel that has carved the price down from the $11.48 peak in late 2024.
The channel is tightening to a point here — the same wedge compression pattern visible in the mid-2024 structure that preceded a 176.41% rally to $11.48.
That prior setup is indicated directly on the chart. Polkadot’s price compressed into a wedge near $4.00, broke out, and surged 176% to the highs.
The current compression is occurring at a far lower base — near the multi-year $1.262 support.
But if history rhymes, the DOT mid-term target of $4.288 could be feasible. However, that will only be the case if the cryptocurrency holds the horizontal resistance level.
Besides that, traders also need to watch out for the weekly support at $1.26. If Polkadot’s price falls out of this range, the expected breakout might not occur.
Let us be precise about what this report means. The February 2026 CPI breakdown tells a clear story.
Metric
Actual
Expectation
Status
Headline CPI (Year-over-Year)
2.4%
2.5%
Slightly Below
Headline CPI (Month-over-Month)
0.3%
0.3%
In Line
Core CPI (Year-over-Year)
2.5%
2.5%
In Line
Core CPI (Month-over-Month)
0.2%
0.2%
In Line
This is not a dramatic cooling. However, it is meaningfully constructive.
A headline print that comes in below expectations, even by a tenth of a percentage point, shifts Federal Reserve rate cut probability calculations in a direction that benefits risk assets.
Equally important, the core figures holding precisely in line removes the scenario that markets feared most.
Notably, this surprise acceleration in underlying inflation would have forced the Fed into a hawkish pivot at the worst possible moment.
The report also carries a critical timing dimension that adds to its significance. It captures February data, recorded just before the dramatic spike in global energy prices triggered by the escalating conflict in Iran and the associated tensions in the Strait of Hormuz.
DOT Price Analysis
In the meantime, the daily chart has identified a key pattern: a bull flag forming directly above the 20-EMA.
DOT trades at $1.51, consolidating tightly between $1.493 and $1.526.
That tight-range consolidation after the recovery from the $ 1.10 support is the flag. From CCN’s findings, this could act as a. brief pause before the next leg, with the flagpole being the recovery candle from February’s lows.
Furthermore, the 20-EMA at $1.49 is rising and providing support beneath DOT’s price.
In addition, the Moving Average Convergence Divergence (MACD) is the cleanest confirmation. The line (0.005) has crossed above the signal (0.004), indicating a bullish crossover with histograms turning green for the first time since early February.
By the look of things, Polkadot’s price will likely break the flag’s upper boundary.
Disclaimer:
The information provided in this article is for informational purposes only. It is not intended to be, nor should it be construed as, financial advice. We do not make any warranties regarding the completeness, reliability, or accuracy of this information. All investments involve risk, and past performance does not guarantee future results. We recommend consulting a financial advisor before making any investment decisions.
Victor Olanrewaju is a crypto analyst and reporter at CCN with deep roots in on-chain research and technical analysis. His crypto journey began in 2017, but it was the 2020 Uniswap airdrop that sparked a full-time pivot into the space.
With a foundation in copywriting, Victor honed his craft creating high-converting content for leading crypto brokers — most notably an XRP price prediction that ranked #1 on Google during the 2021 bull run.
He later joined AMBCrypto in 2022, where he combined storytelling with technical and on-chain analysis to cover key market narratives.
In 2024, he expanded his expertise at BeInCrypto, collaborating with analysts and using tools like Glassnode, Santiment, and IntoTheBlock to break down Bitcoin and altcoin trends.
At CCN, Victor covers the top cryptocurrencies, memecoins, macro shifts, blending real-time insights with deep-dive metrics.
He holds a Bachelor’s degree in Physics from the University of Ibadan, equipping him to simplify complex data for a wide audience. Follow his work or connect on LinkedIn or X.