Data shows FET price will likely trade closer to $1 | Credit: Hameem Sarwar
Share
Key Takeaways
FET whales accumulate 100 million tokens as the altcoin breaks an eight-month slump.
OI has jumped by 20%, indicating increased capital and rising speculative interest.
If the FET price breaks above this $0.27 ceiling, it could open the door to $0.34.
FET, native to the Artificial Superintelligence Alliance, has recently outperformed many other cryptos.
As a result, there has been speculation that the cryptocurrency’s value might rise. While this is due to the position of some indicators, on-chain data shows that there is more to it.
In this analysis, CCN explains why FET’s price could extend the rally and its potential targets.
FET Buyers Dominate Market Structure
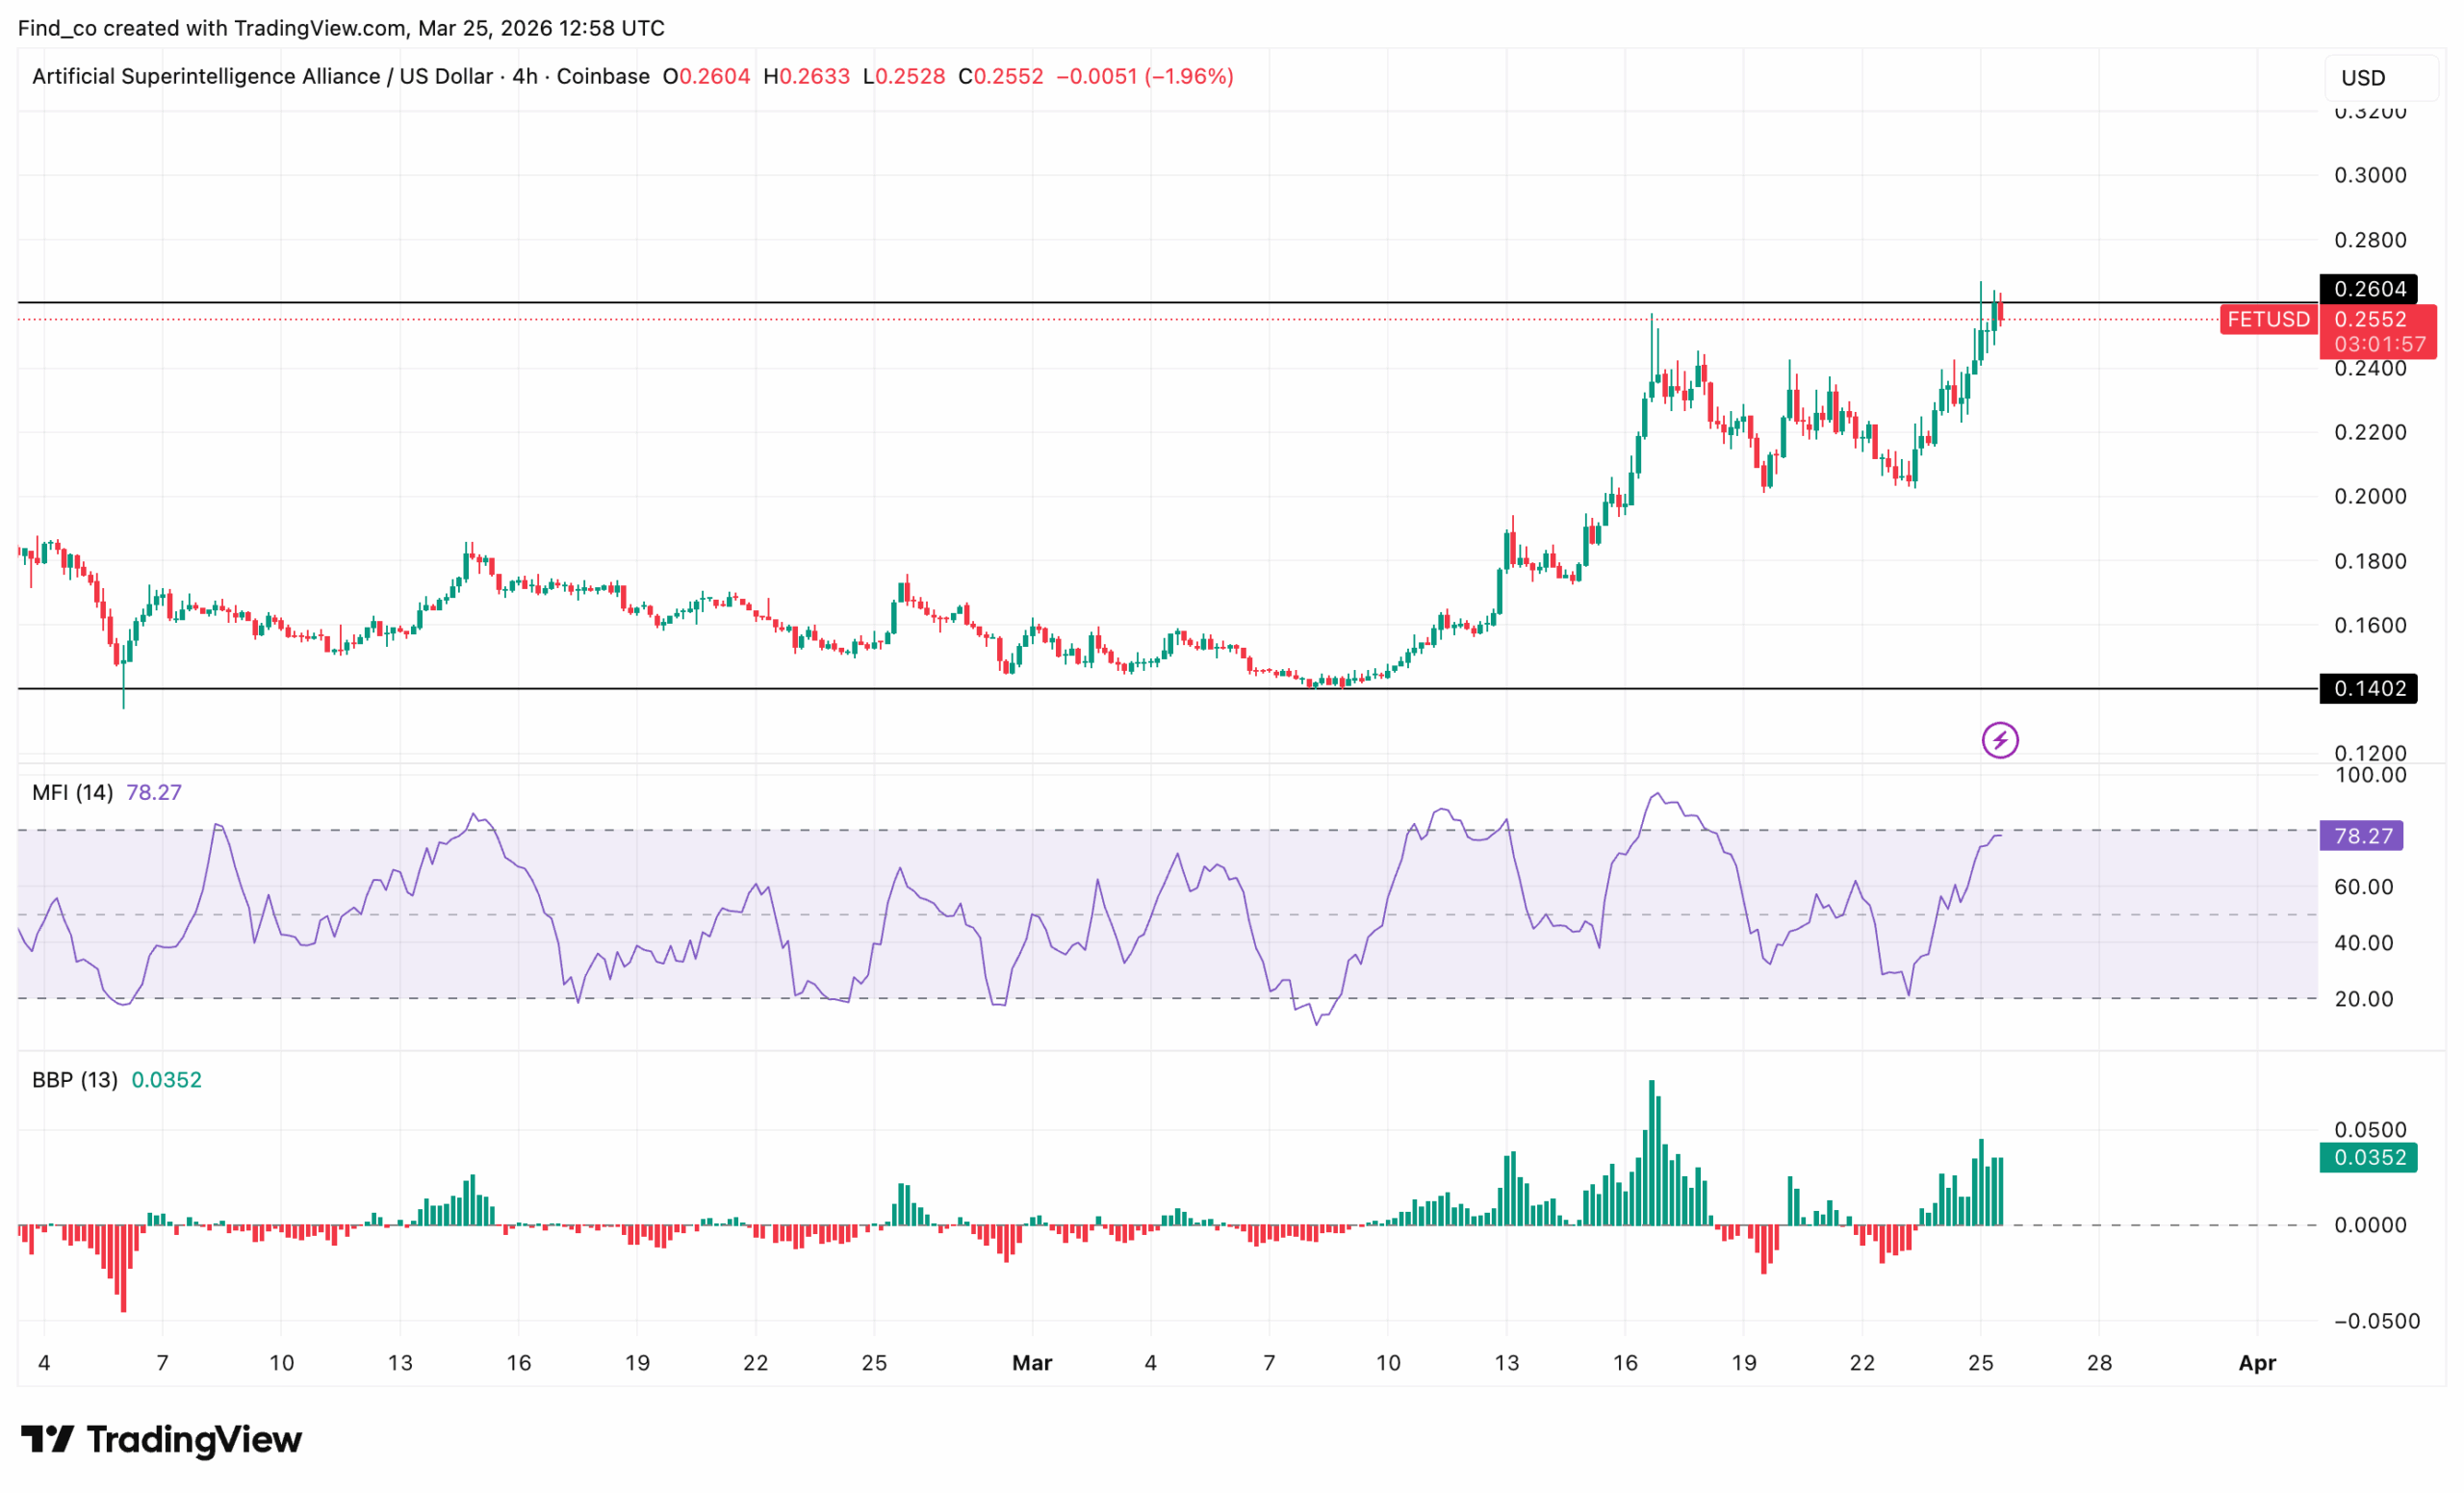
FET is approaching a critical resistance zone after a sustained bullish recovery. Price action is tightening around $0.26, signaling a potential breakout.
The coin has shifted from a prolonged consolidation into a clear uptrend. After forming a base around $0.15, buyers stepped in, driving demand higher.
As a result, FET’s price printed higher highs and higher lows, confirming a bullish market structure.
On the 4-hour chart, the Money Flow Index (MFI) is hovering around 77. This suggests strong capital inflow into the asset.
However, it also indicates that the asset is approaching overbought conditions. The Bull Bear Power (BBP) has also flipped positive and is expanding. This reflects increasing buyer strength in the market.
Typically, rising green histogram bars show that bullish pressure is accelerating. Still, any sudden drop in BBP could signal weakening momentum.
Whales Add to Their Position
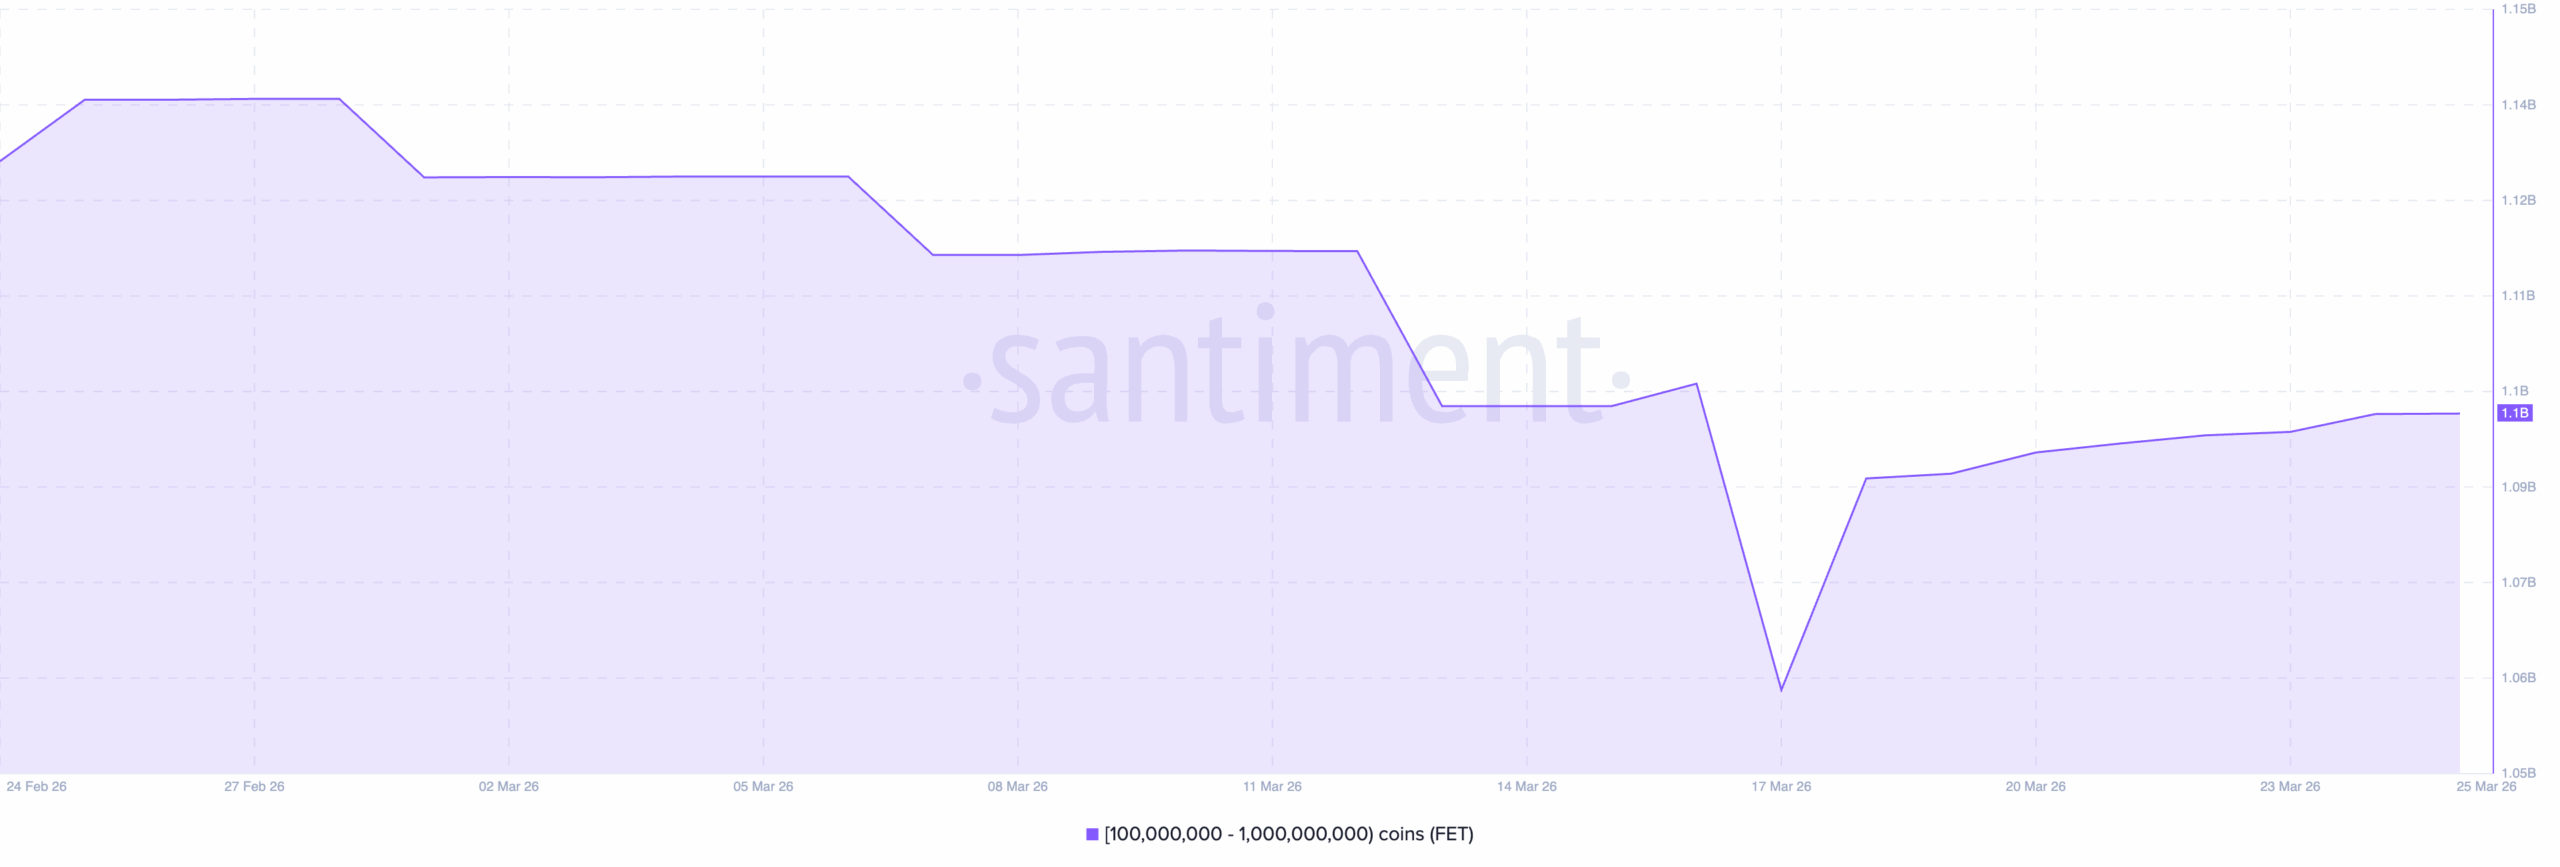
Amid that, mn-chain data reveals that large wallet addresses have collectively absorbed approximately 100 million FET tokens within the past week.
For instance, on March 17, the number of FET held by whales was 1 billion. Today, it has increased to 1.1 billion.
The move carries weight that extends beyond the headline number.
It reflects deliberate, high-conviction positioning by participants whose transaction sizes require both market access and forward-looking thesis construction that retail accumulation alone cannot produce.
The timing of the accumulation is analytically significant. FET’s price had recently completed a 239-day resistance break accompanied by a 56% surge — one of the most technically consequential moves in the token’s recent history.
The whale accumulation arriving in the wake of that technical development suggests that sophisticated participants are treating the resistance break as a validated structural shift rather than a temporary momentum event.
They are not buying the initial surge. They are buying the confirmation that the surge represents.
Derivative Market Activity Rises
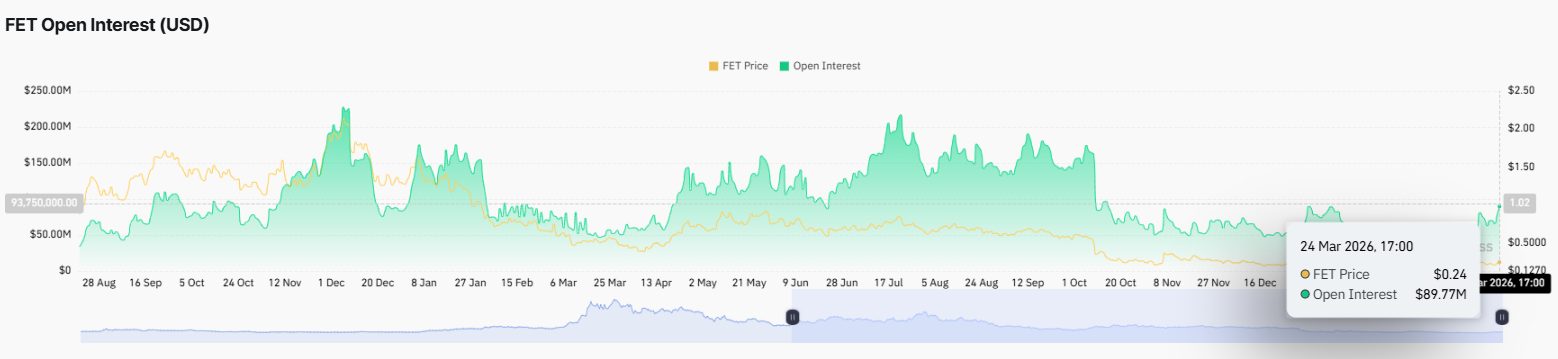
Meanwhile, the derivative chart also reflects a similar movement.
The Open Interest (OI) has surged by 20%, signaling growing trader participation in the current move. The surge suggests that both speculative and directional bets are building momentum, which could amplify volatility as the price approaches key resistance near $0.27.
Higher OI alongside rising prices often points to a strengthening trend rather than a simple retracement.
However, rapid OI increase can also precede sharper swings, making careful position management crucial.
Overall, the jump in open interest confirms that market participants are actively backing the upside. If sustained, this could drive FET’s price further high.
FET Price Analysis: Bulls Eye $0.40
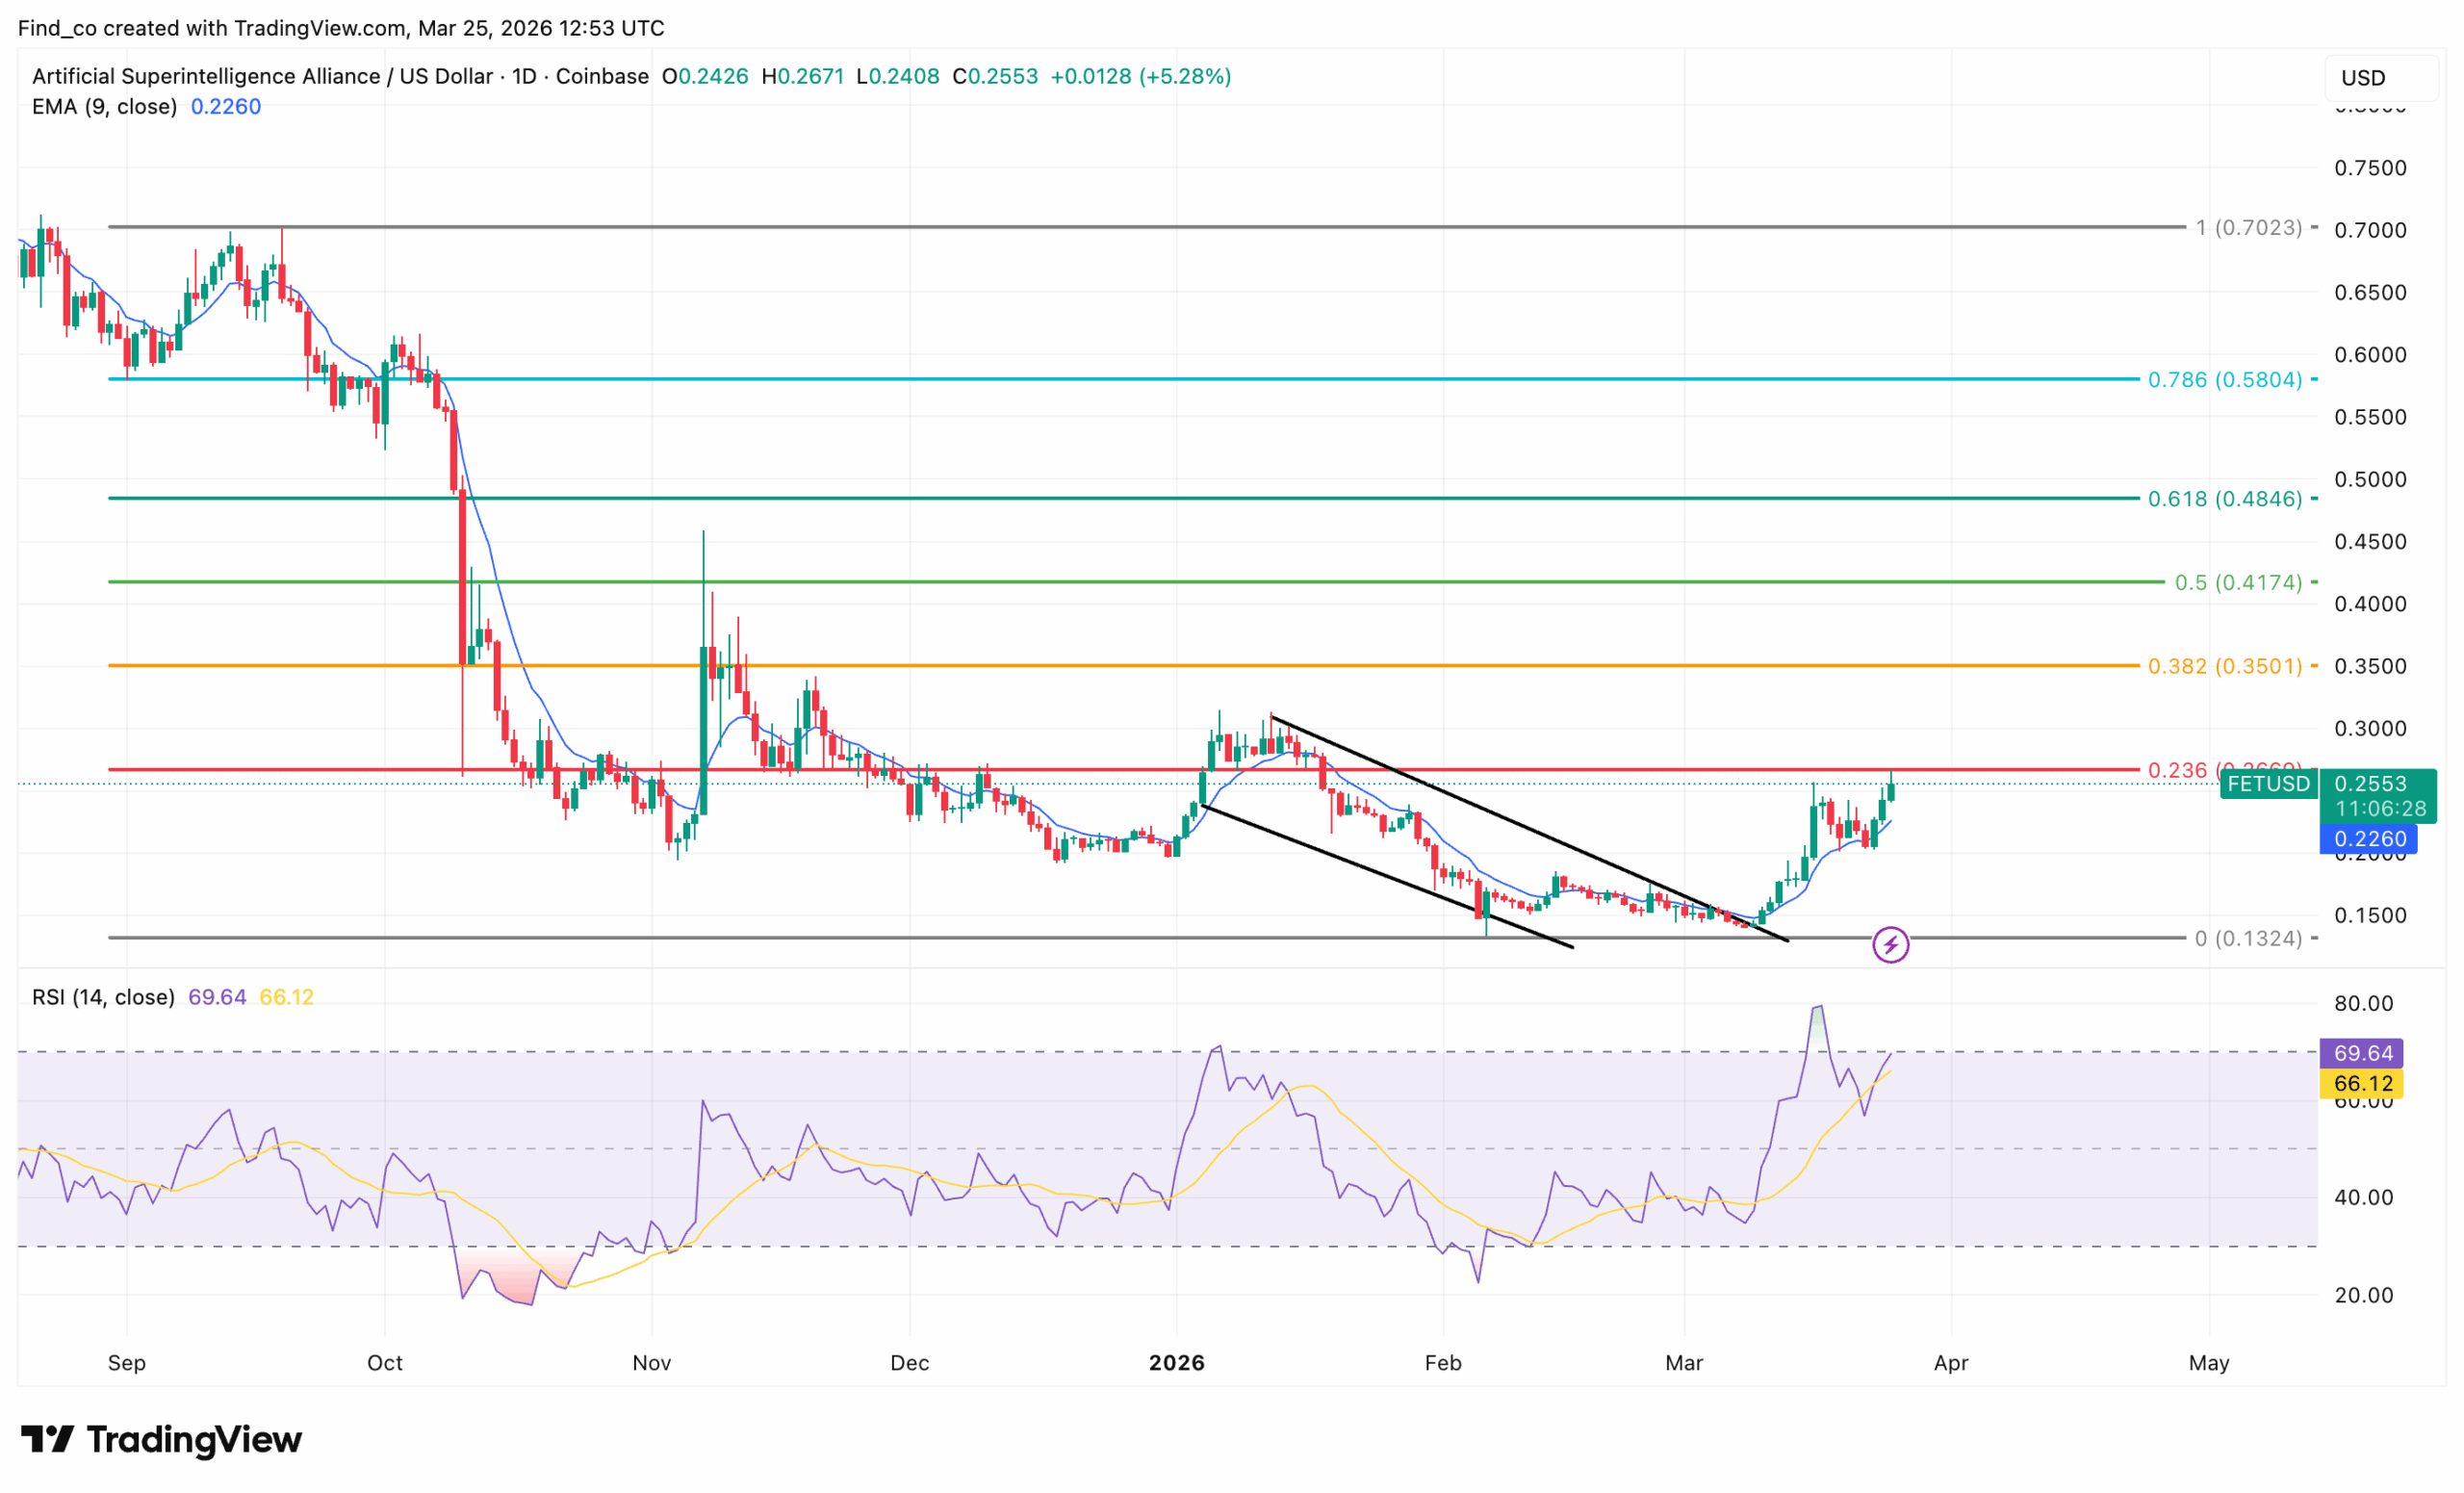
On the daily chart, FET is attempting a structural shift after a prolonged downtrend, with price now pressing firmly against the $0.25-$0.26 zone.
The cryptocurrency has rebounded sharply from the $0.13 base, forming higher lows and breaking above its descending trendline. This signals weakening bearish pressure.
More importantly, the 20-day Exponential Moving Average (EMA) has flipped to dynamic support. FET’s price recently retested this level and held, confirming buyer interest on dips.
This transition is a classic early bullish signal, as short-term momentum now favors continuation rather than rejection.
Meanwhile, the Relative Strength Index (RSI) is near 69, indicating strong momentum but nearing overbought conditions. Therefore, upside remains intact, but caution is warranted.
If buyers sustain pressure, a trend reversal becomes increasingly likely.
However, momentum is approaching a critical test. The 0.236 Fibonacci level near $0.27 acts as immediate resistance, and FET’s price is now consolidating just below it.
Disclaimer:
The information provided in this article is for informational purposes only. It is not intended to be, nor should it be construed as, financial advice. We do not make any warranties regarding the completeness, reliability, or accuracy of this information. All investments involve risk, and past performance does not guarantee future results. We recommend consulting a financial advisor before making any investment decisions.
Victor Olanrewaju is a crypto analyst and reporter at CCN with deep roots in on-chain research and technical analysis. His crypto journey began in 2017, but it was the 2020 Uniswap airdrop that sparked a full-time pivot into the space.
With a foundation in copywriting, Victor honed his craft creating high-converting content for leading crypto brokers — most notably an XRP price prediction that ranked #1 on Google during the 2021 bull run.
He later joined AMBCrypto in 2022, where he combined storytelling with technical and on-chain analysis to cover key market narratives.
In 2024, he expanded his expertise at BeInCrypto, collaborating with analysts and using tools like Glassnode, Santiment, and IntoTheBlock to break down Bitcoin and altcoin trends.
At CCN, Victor covers the top cryptocurrencies, memecoins, macro shifts, blending real-time insights with deep-dive metrics.
He holds a Bachelor’s degree in Physics from the University of Ibadan, equipping him to simplify complex data for a wide audience. Follow his work or connect on LinkedIn or X.