Home / Analysis / Crypto / Technical Analysis / Polkadot (DOT) Price Explodes 55%: How Trump’s State of the Union Address and a Grayscale ETF Filing Fueled the Rally
Is Polkadot’s 25% rally a bull trap | Credit: Derek Fenech
Share
Key Takeaways
Polkadot surged 25% in a single day, adding $552 million to its market capitalization.
A surprise Grayscale ETF filing for Polkadot acted as a major institutional catalyst.
Technical indicators have flipped bullish, though DOT faces a critical test at the $1.70.
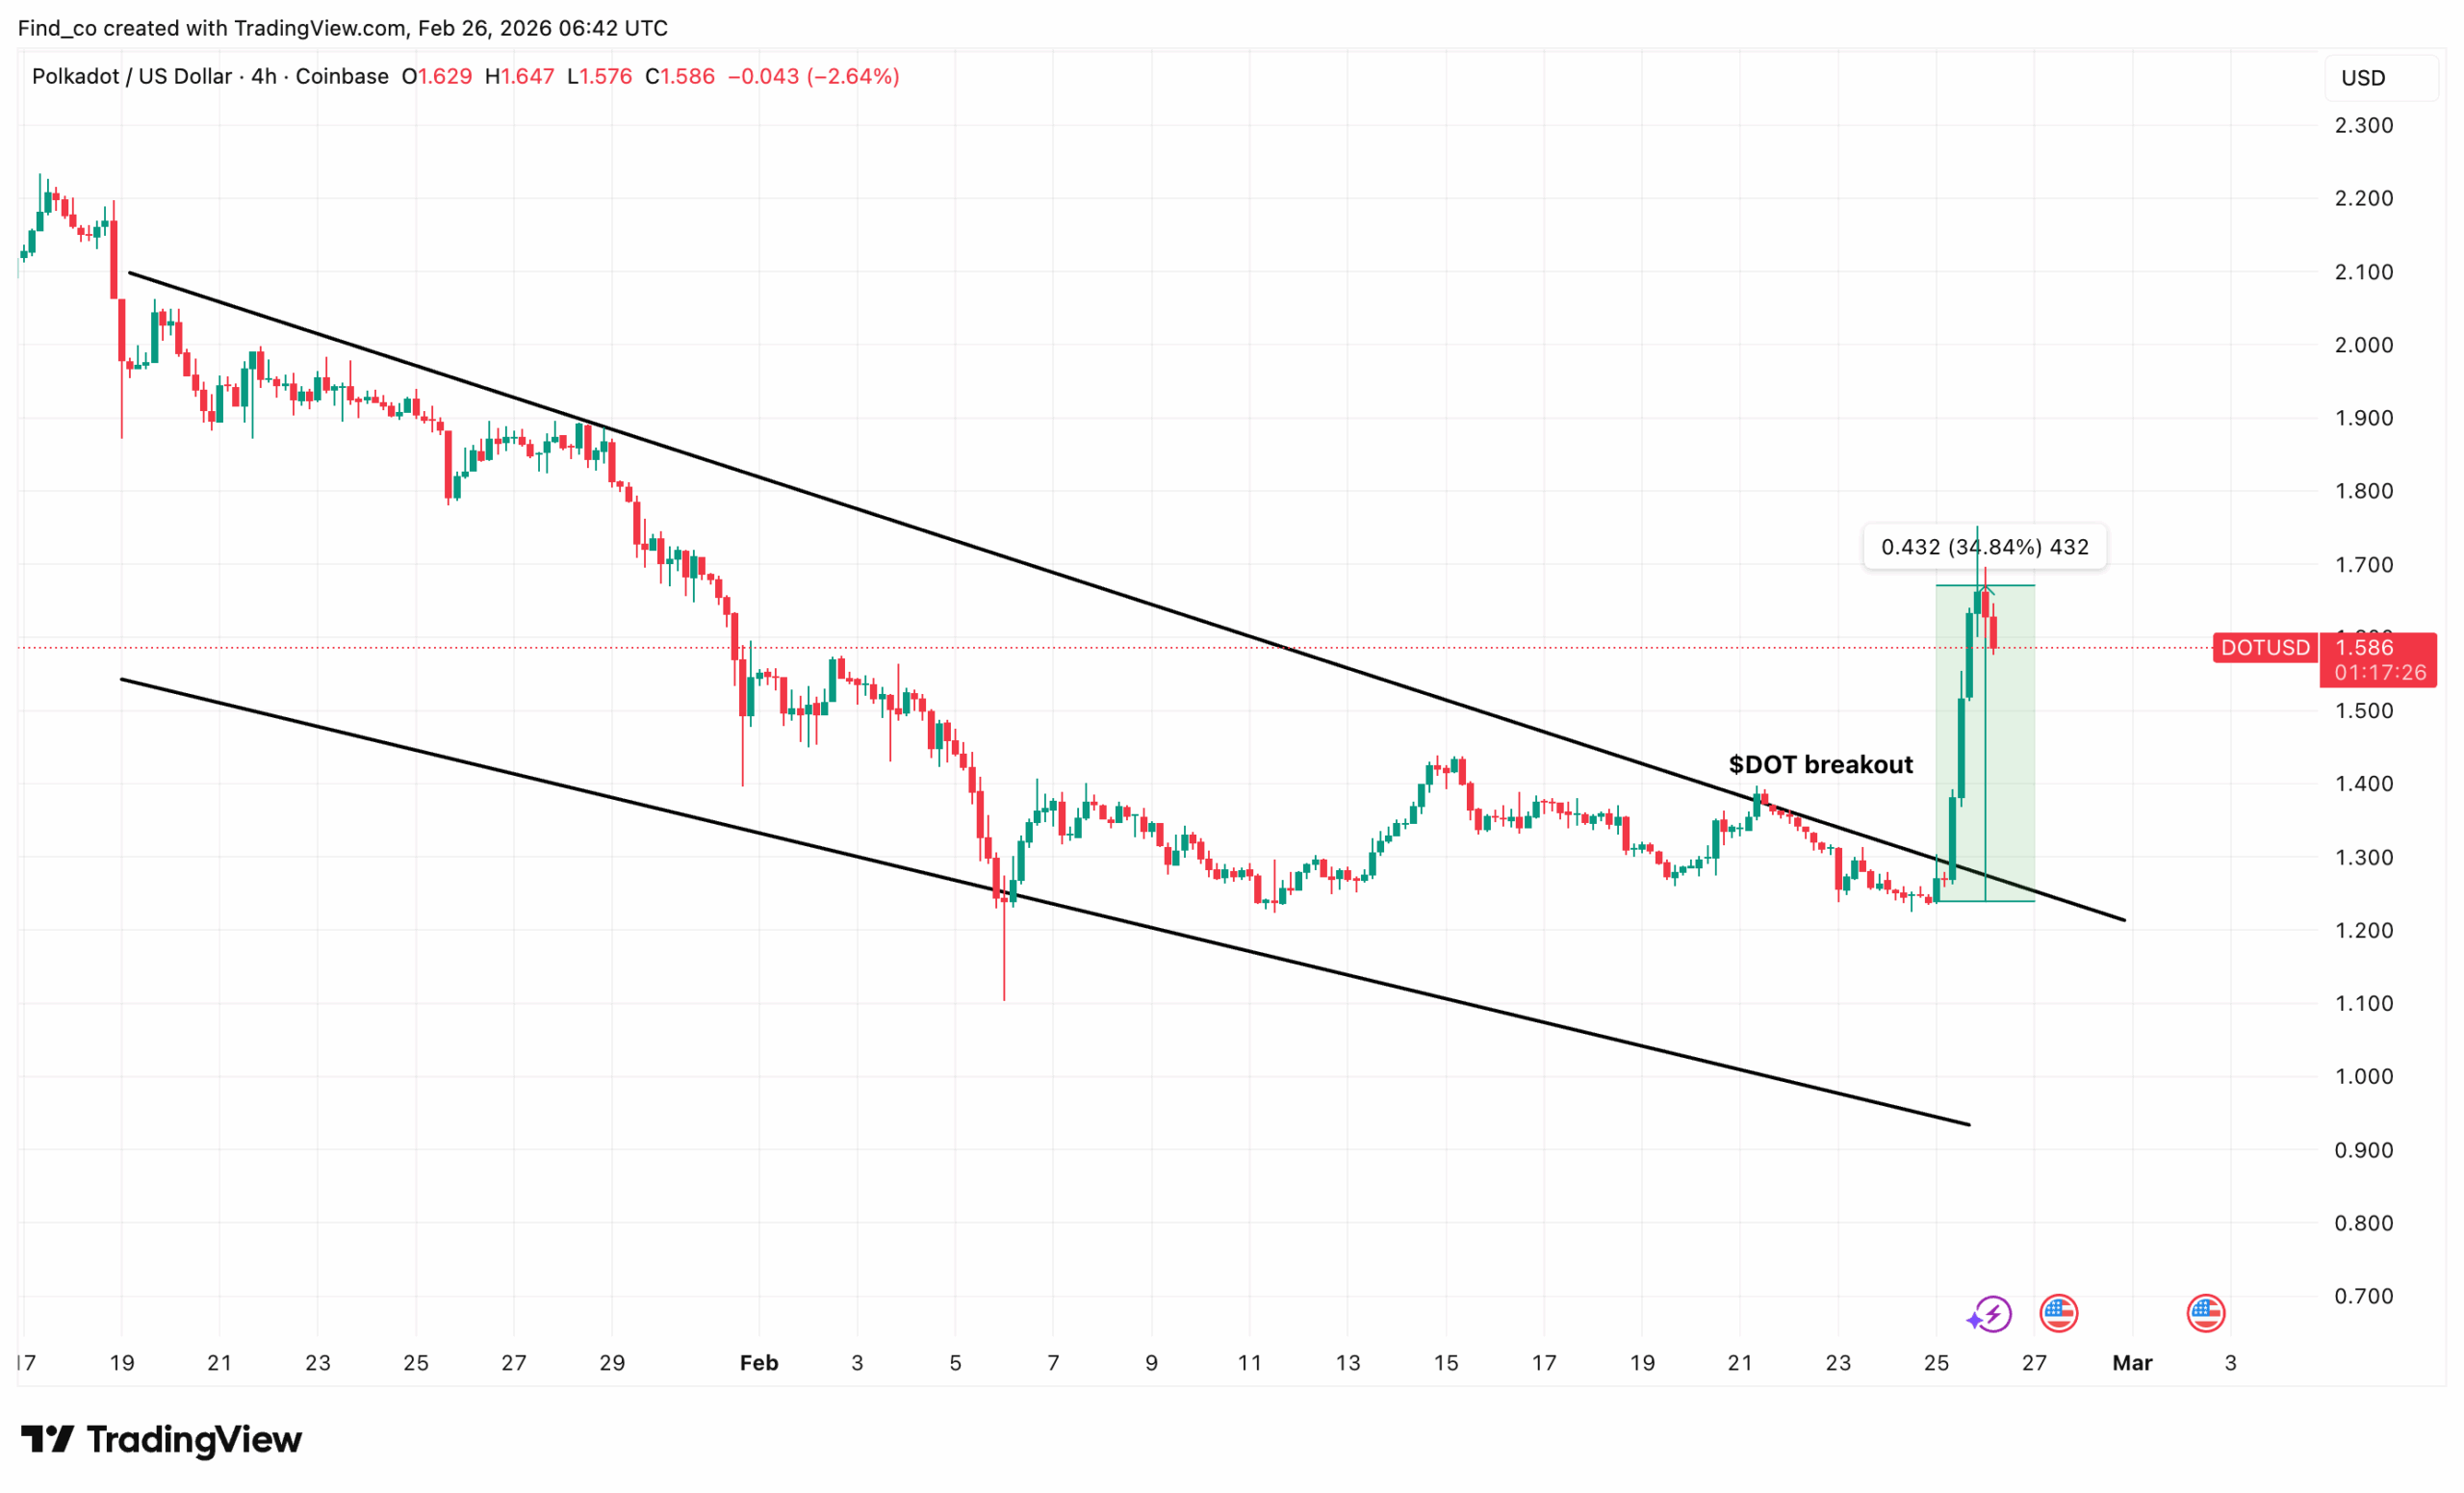
Polkadot (DOT) delivered the crypto rally nobody expected. The cryptocurrency surged 25% in the last 24 hours, adding a staggering $552 million to its market capitalization.
Trading volume exploded to $351.68 million as the token climbed from a daily low of $1.24 to a session high of $1.60, marking DOT’s strongest single-day performance in months
Two major events drove this rally — President Donald Trump’s State of the Union address and a surprise ETF filing by Grayscale Investments. Here is how it all happened and what lies ahead for the Polkadot coin price.
How the Polkadot Coin Rally Happened
Markets were already on edge. Crypto investors had been watching Washington closely.
Then Trump delivered his address, and the market responded immediately.
His address touched on America’s role in the global digital economy.
Get These Top Crypto Casino Offers Now!
Sponsored
Disclosure
We sometimes use affiliate links in our content, when clicking on those we might receive a commission at no extra cost to you. By using this website you agree to our terms and conditions and privacy policy.
While he did not mention Polkadot by name, pro-crypto sentiment in his remarks rippled across the market. As a result, altcoins with strong fundamentals, like DOT, benefited the most.
“The stock market has set 53 all-time record highs since the election,” he said. “Everyone’s up, way up.” Trump said.
Furthermore, claimed $18 trillion in global investment had poured into the U.S. economy since he took office. He also touted falling inflation and surging equity markets.
The message was clear: the American economy is roaring.
Several cryptocurrencies climbed, but Polkadot coin moved fastest. Yet, the rally did not happen in isolation.
Institutional investors took notice. Confidence in DOT grew quickly, and buy orders flooded in.
So why does a Grayscale ETF filing matter so much? Grayscale manages billions in crypto assets. When it files for an ETF, it signals that a token has institutional-grade potential.
Investors read this as a vote of confidence. Furthermore, an approved ETF would let traditional investors access DOT without holding the asset directly. That dramatically expands the potential buyer pool.
Polkadot itself has strong technical foundations. It connects multiple blockchains through its parachain architecture. This allows different networks to share data and security without sacrificing speed.
Developers continue to build on the platform, and its ecosystem has grown steadily throughout 2024 and into 2025.
Still, traders might need to approach the DOT price surge with caution.
Quick price movements driven by news can reverse just as quickly.
Moreover, the Grayscale ETF filing is not an approval, as regulators must still review and decide. That process can take months.
Bull Trap or Not?
However, the momentum behind DOT is hard to ignore. As mentioned earlier, trading volume spiked dramatically during the rally.
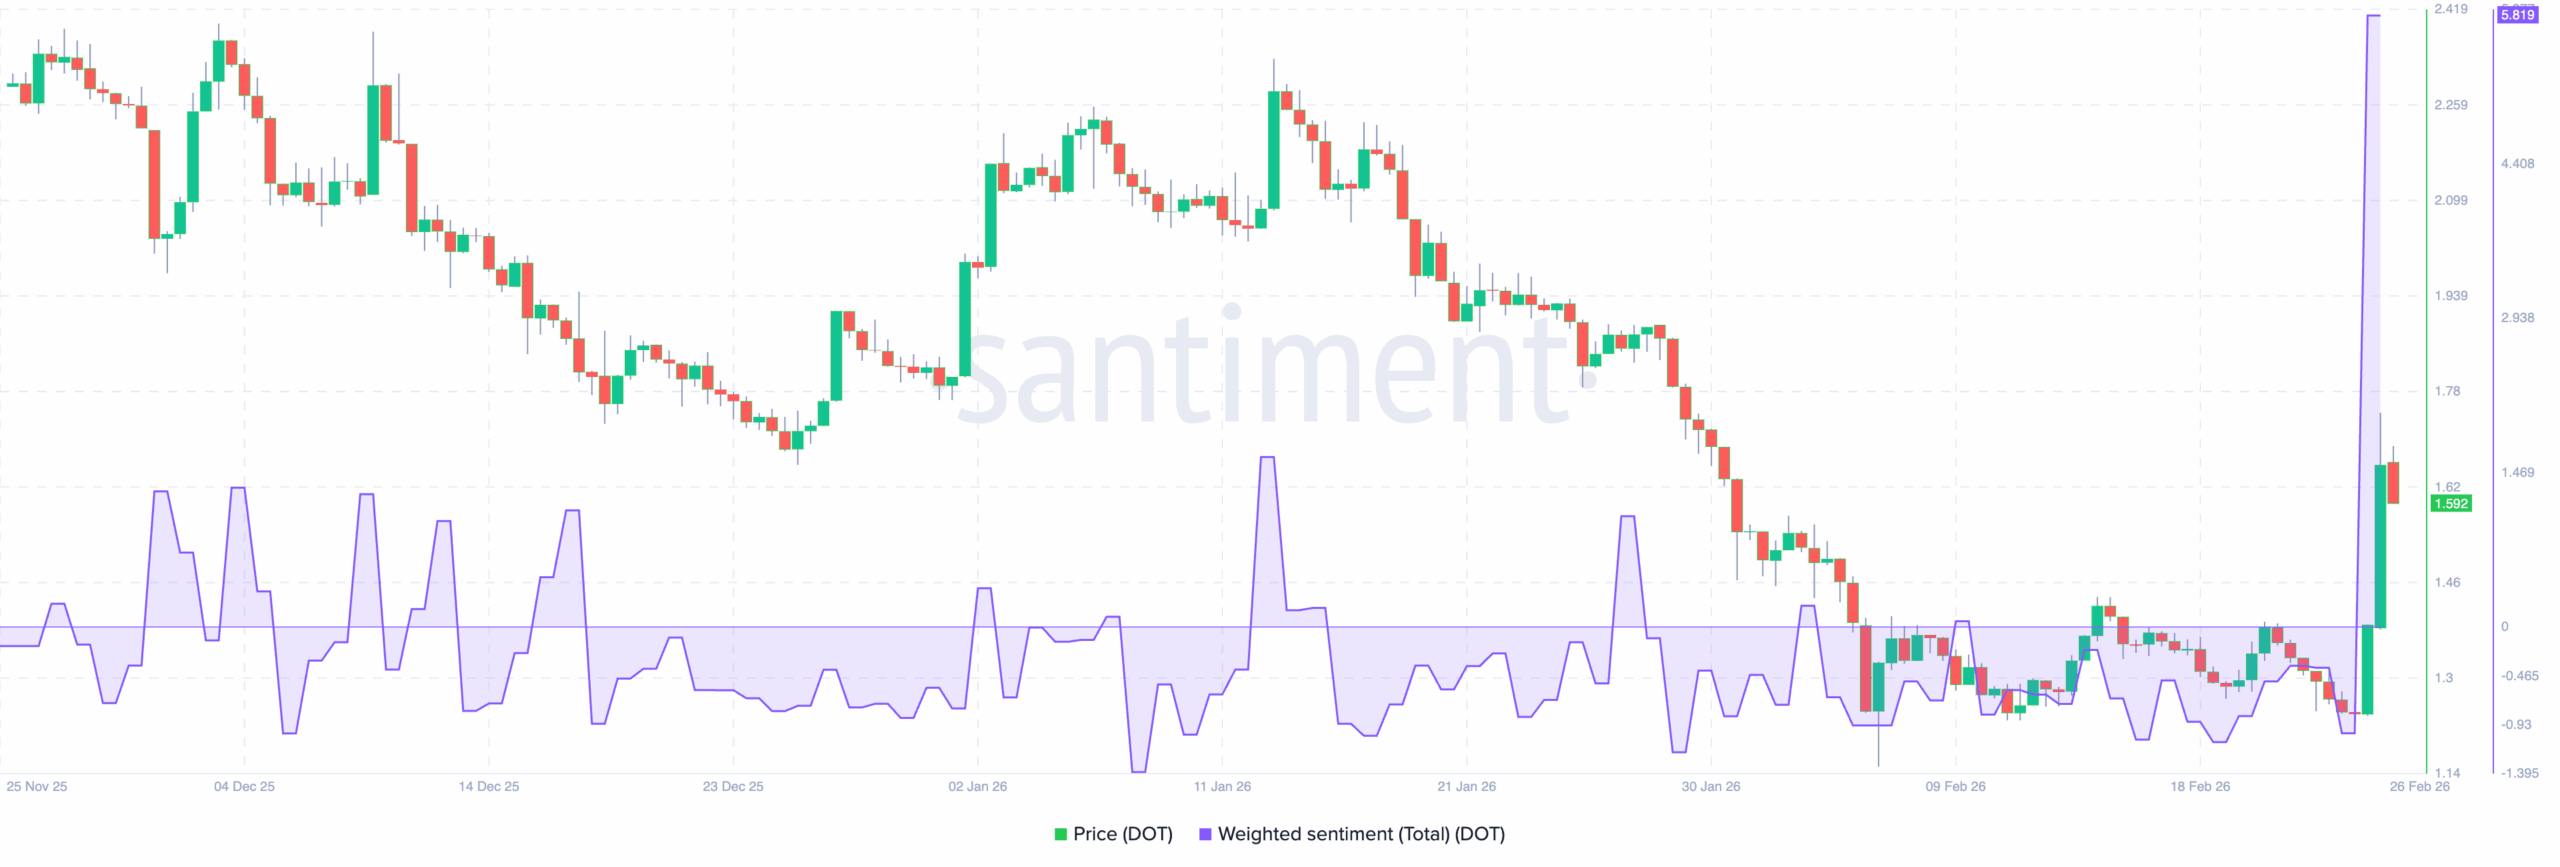
Meanwhile, social media mentions and the Weighted Sentiment around the Polkadot coin surged to their highest levels in months.
According to Santiment data, the crowd has turned extremely bullish on Polkadot. However, history suggests that it could be a warning sign.
Santiment’s weighted sentiment for DOT has spiked to 5.82 today, Feb. 26, the highest reading since November 2024.
Typically, when social commentary turns aggressively positive, the price is approaching the top.
Look back at the chart. Prior positive sentiment spikes (visible in December and early January) did not prevent further Polkadot price declines.
But the difference here is that DOT’s price has rallied. So, if buying pressure increases, the extremely positive sentiment might not drag the price down.
However, if crowd enthusiasm declines, it could be a red flag for the Polkadot price action.
Analysts are now watching key resistance levels. If DOT holds above its current price, many believe a further move upward is possible.
Conversely, failure to hold these levels could trigger profit-taking and a pullback.
The broader crypto market also rallied on the same day. Bitcoin and Ethereum both posted gains.
Nevertheless, Polkadot outperformed them both. That relative strength suggests the Grayscale filing had an outsized impact specifically on DOT.
DOT Price Prediction: Higher
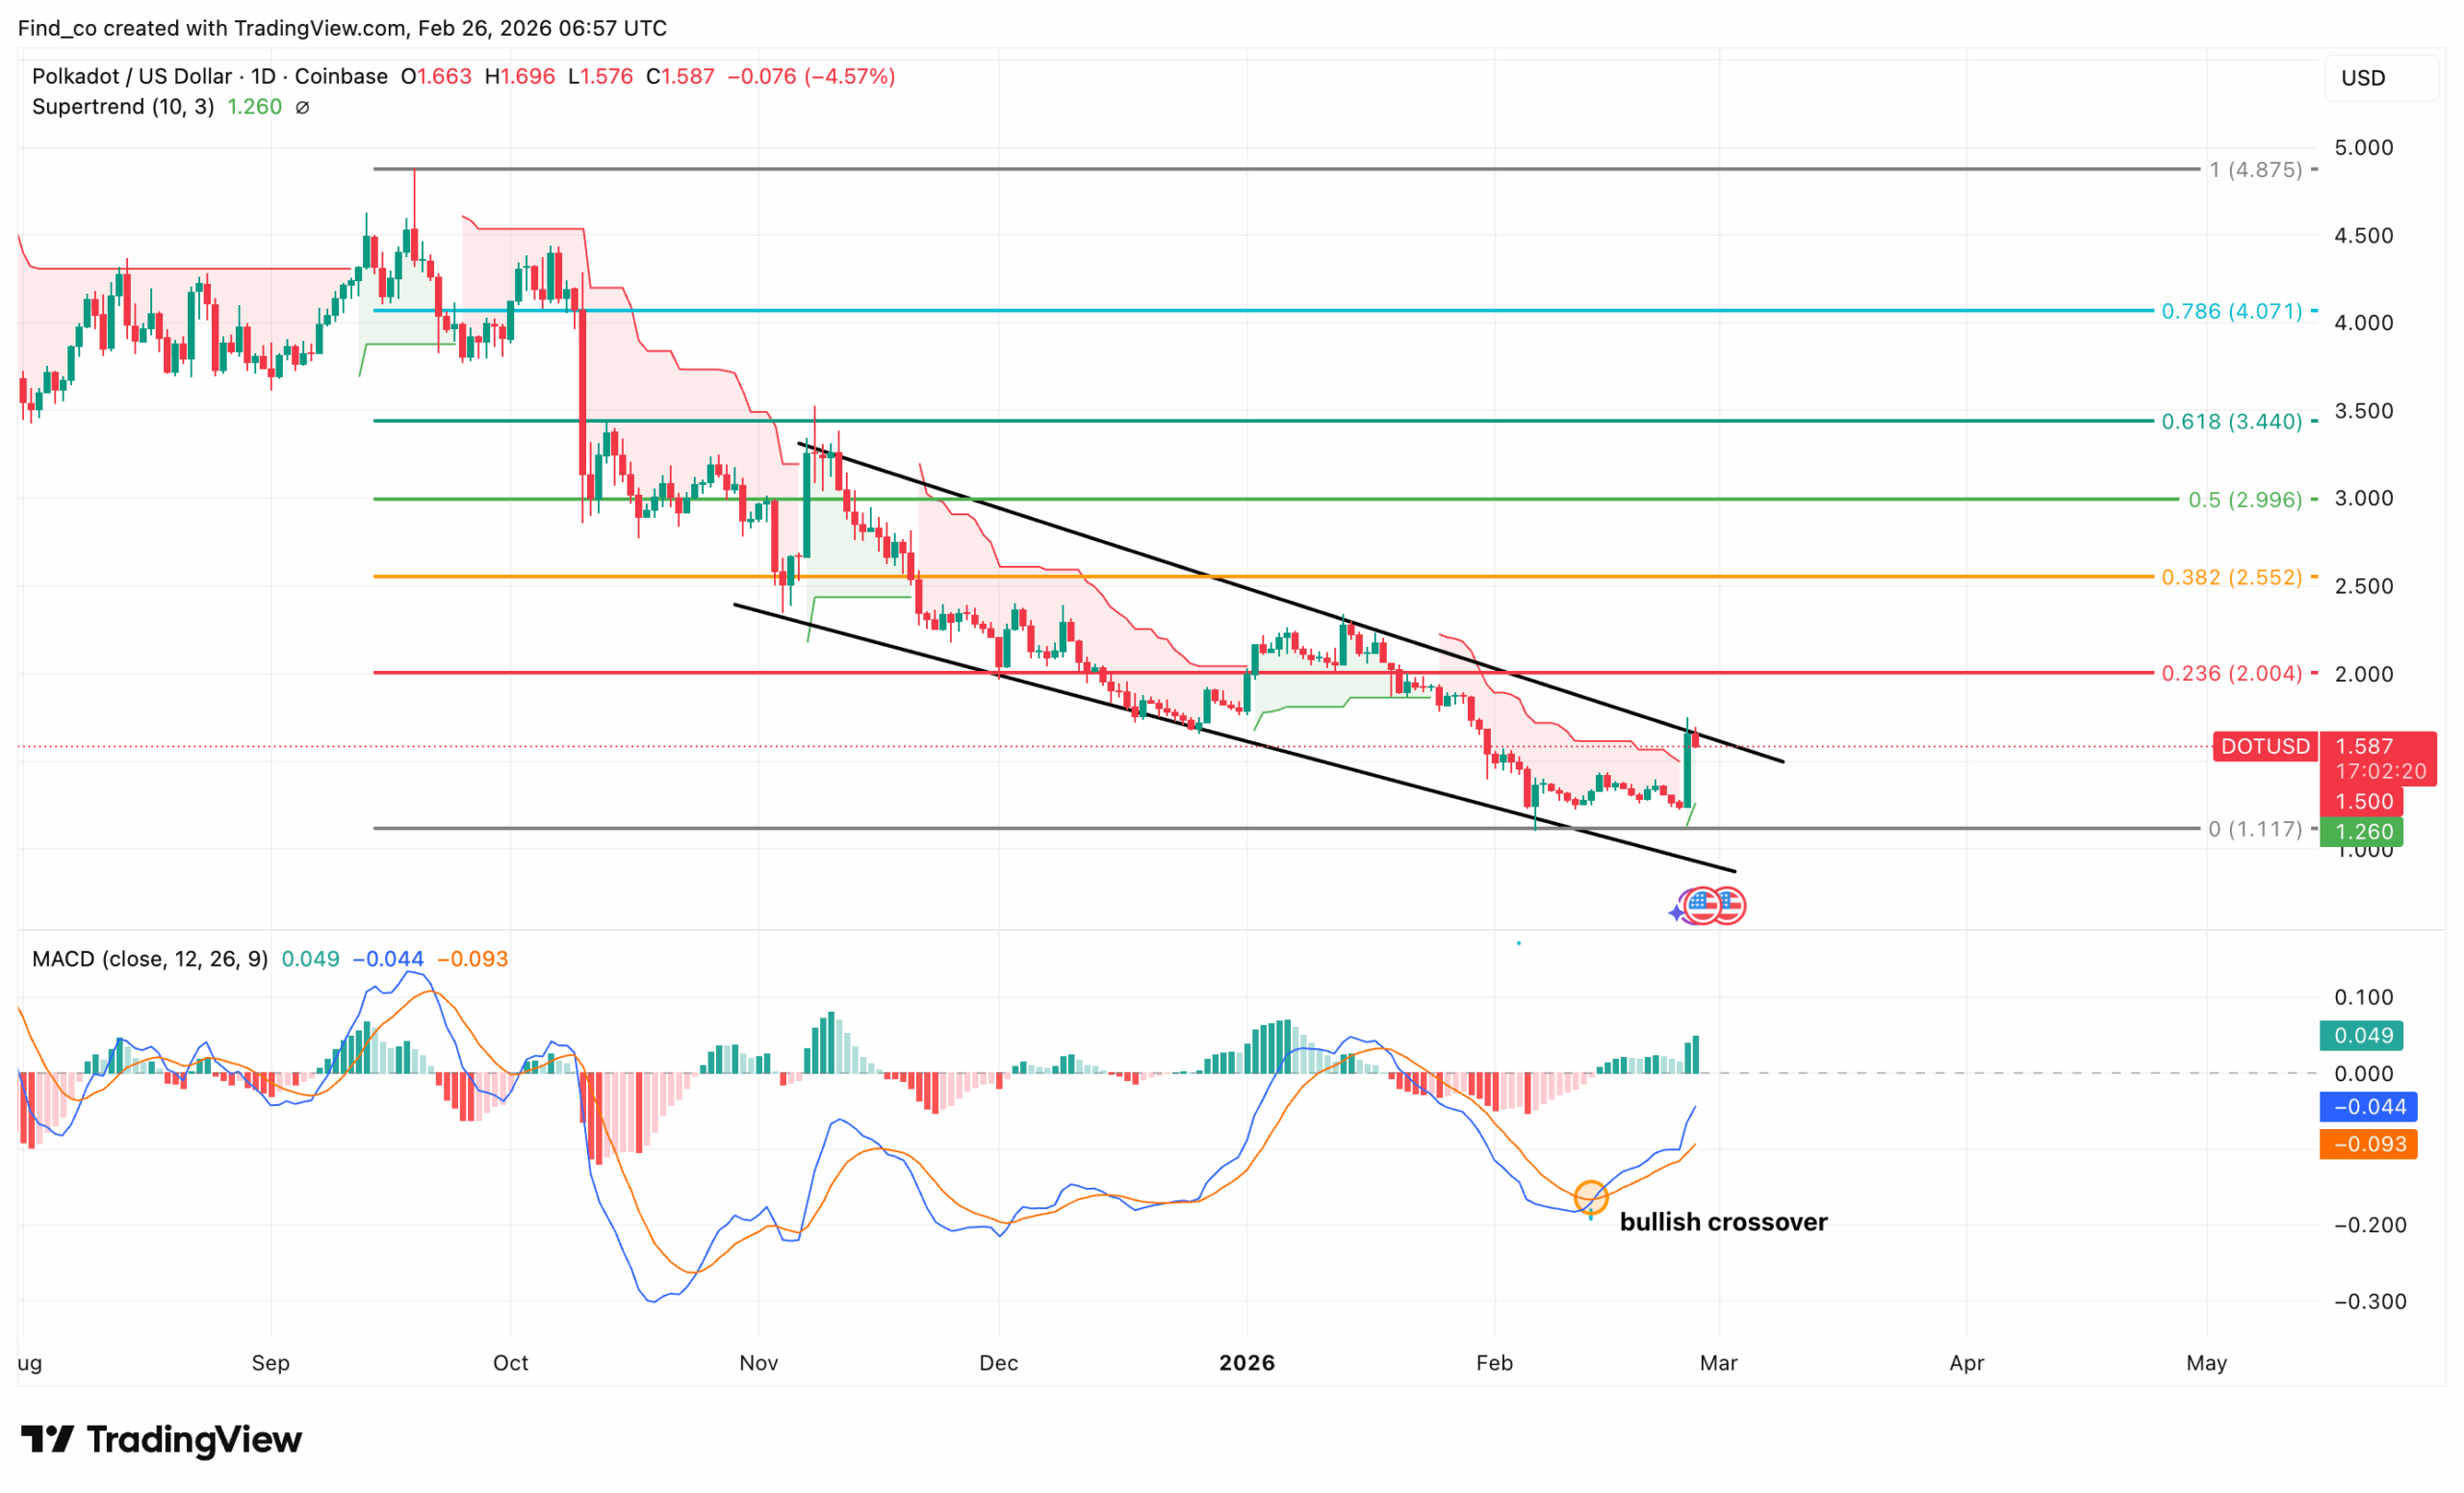
From a technical perspective, CCN observed that something is shifting in Polkadot’s chart on the daily timeframe
DOT trades at $1.59 after giving back some of yesterday’s bounce from near the zero Fib floor at $1.117.
That bounce was significant. Price surged aggressively off the channel’s lower boundary, producing the largest single green candle since October.
The Moving Average Convergence Divergence (MACD) is the headline indicator here. Looking closely, the indicator has formed a bullish crossover for the first time in months.
In addition, the Supertrend indicator has switched to bullish mode, as the green line is below DOT’s price. If this trend holds, the Polkadot coin could rise toward $2.
However, the descending channel is the key obstacle. While DOT has bounced hard from the lower boundary, it must now break above the upper trendline, currently near $1.70.
Disclaimer:
The information provided in this article is for informational purposes only. It is not intended to be, nor should it be construed as, financial advice. We do not make any warranties regarding the completeness, reliability, or accuracy of this information. All investments involve risk, and past performance does not guarantee future results. We recommend consulting a financial advisor before making any investment decisions.
Victor Olanrewaju is a crypto analyst and reporter at CCN with deep roots in on-chain research and technical analysis. His crypto journey began in 2017, but it was the 2020 Uniswap airdrop that sparked a full-time pivot into the space.
With a foundation in copywriting, Victor honed his craft creating high-converting content for leading crypto brokers — most notably an XRP price prediction that ranked #1 on Google during the 2021 bull run.
He later joined AMBCrypto in 2022, where he combined storytelling with technical and on-chain analysis to cover key market narratives.
In 2024, he expanded his expertise at BeInCrypto, collaborating with analysts and using tools like Glassnode, Santiment, and IntoTheBlock to break down Bitcoin and altcoin trends.
At CCN, Victor covers the top cryptocurrencies, memecoins, macro shifts, blending real-time insights with deep-dive metrics.
He holds a Bachelor’s degree in Physics from the University of Ibadan, equipping him to simplify complex data for a wide audience. Follow his work or connect on LinkedIn or X.