However, momentum is now flattening, and DOT’s price is transitioning into a short-term balance.
Earlier, DOT trended lower with a clear sequence of lower highs and lower lows. Price compressed near the $1.30 support before buyers stepped in, shifting momentum.
Get These Top Crypto Casino Offers Now!
Sponsored
Disclosure
We sometimes use affiliate links in our content, when clicking on those we might receive a commission at no extra cost to you. By using this website you agree to our terms and conditions and privacy policy.
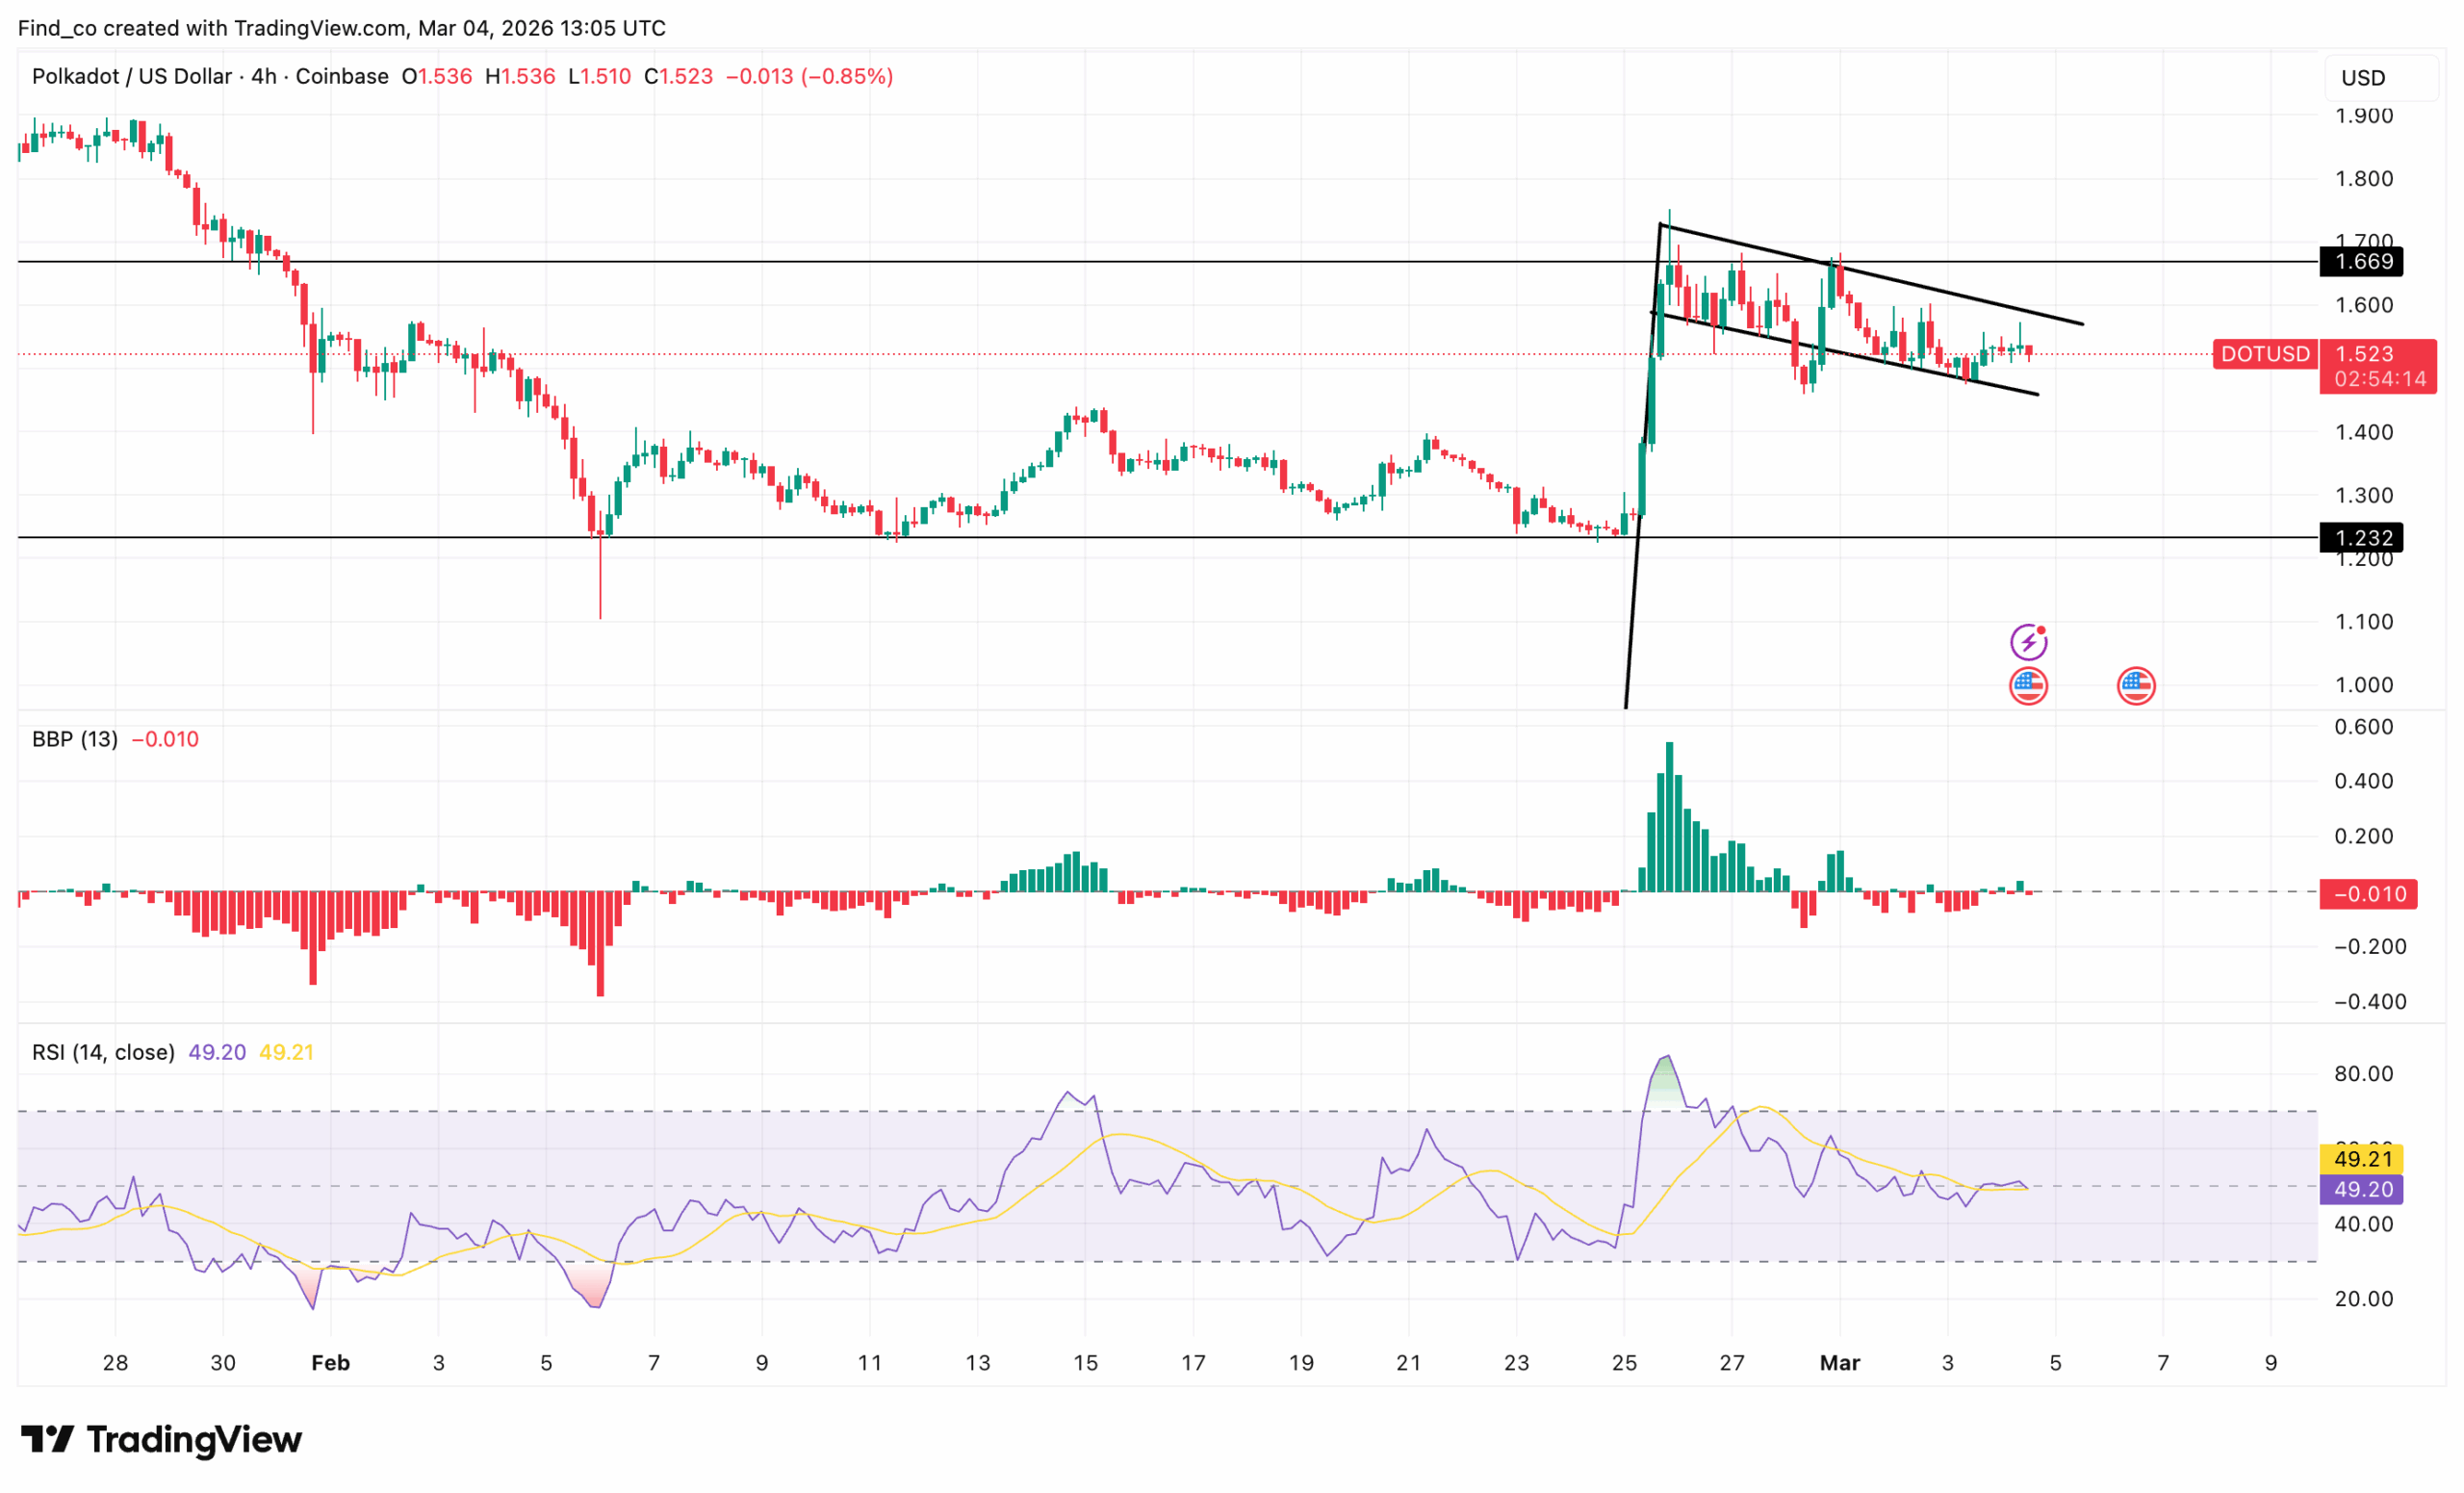
A strong impulsive candle in February triggered a vertical expansion from the $1.30 area to nearly $1.70. That move invalidated the prior short-term bearish structure.
However, follow-through stalled near the $1.75 resistance band, a clearly defined supply zone marked by historical rejections.
The relative strength index (RSI) spiked above 70 during the breakout, confirming a strong bullish crossover. However, it has now cooled to around 49.56, sitting directly at the midline.
The 50 level acts as a directional pivot. Holding above it favors continuation; meanwhile, sustained trading below it would suggest weakening structure.
On a similar note, the Bull Bear Power (BBP) projected a strong positive move during the rally, confirming aggressive buyer pressure.
Now, histogram bars hover slightly negative at -0.013, but contraction dominates. In other words, sellers are not in control, yet buyers do not have the upper hand, either.
The broader takeaway is clear. If Polkadot’s price reclaims $1.65 with strong volume, bulls could target the $1.99 macro resistance band.
A clean break above $1.99 would shift the structure toward a higher-high continuation phase.
DOT Supply Shock Incoming
Fundamentals are aligning as the price approaches a decisive level. On March 3, Polkadot confirmed its economic upgrade will begin rolling out in 10 days, introducing a major tokenomics reset.
The update caps total DOT supply at 2.1 billion, cuts emissions by 53.6%, and reduces the unbonding period from 28 days to just 24–48 hours.
“Enhanced tokenomics increases DOT scarcity and introduces new governance and staking mechanisms.” The team noted
With $1.99 acting as the immediate resistance, tighter supply and lower inflation could strengthen the bullish case.
If demand accelerates during the rollout, Polkadot’s price could push above $1.99 with greater conviction.
DOT Price Rebound Faces $1.99 Test
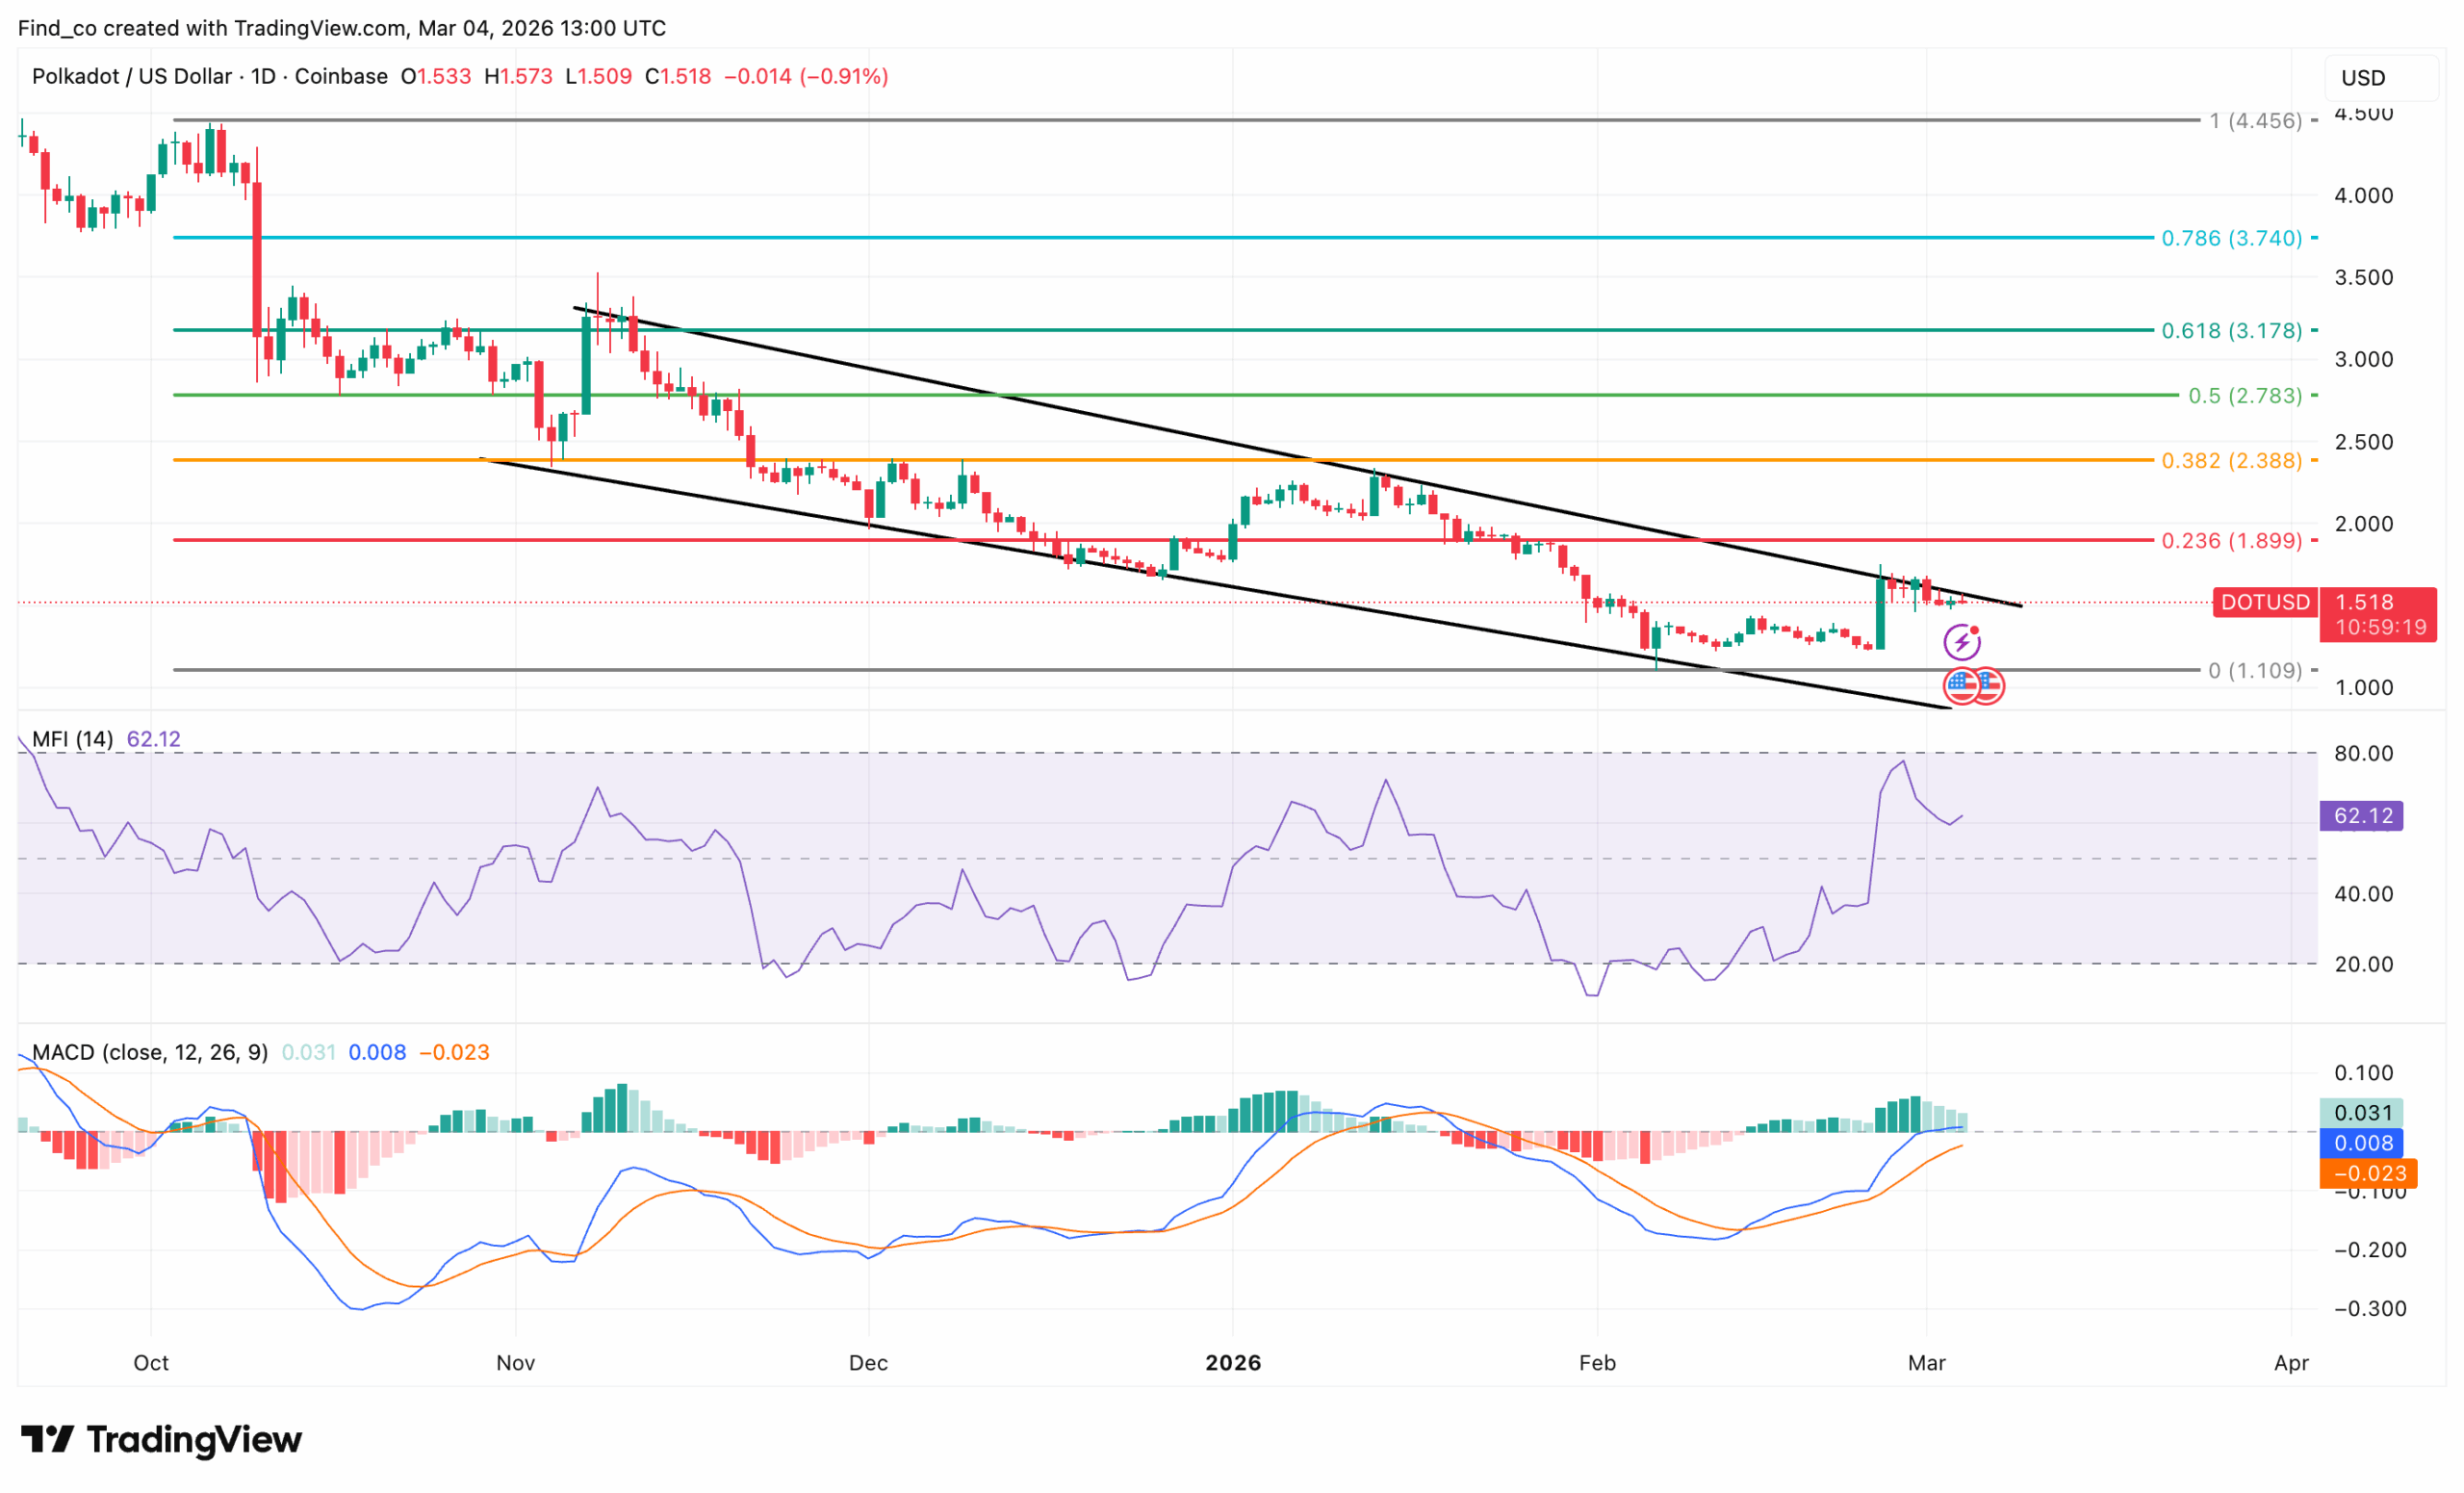
On the daily chart, Polkadot’s price appears to be holding near $1.52 after breaking its daily descending trendline.
While momentum increases, the path to $2 remains technically contested.
Price recently rebounded from the $1.09 macro base, printing a higher low. That shift marked the first structural improvement in months.
Since then, buyers have pushed DOT back above $1.50, reinforcing short-term recovery.
Nevertheless, overhead resistance is clear.
The first barrier stands at $1.65, a recent rejection zone on lower timeframes. A break above that area would strengthen upside continuation.
However, the major level to watch sits at $1.99, which aligns with the 0.236 Fibonacci retracement level.
That level matters. A strong daily close above $1.99 would confirm bullish continuation and likely trigger a massive move toward $2.50.
Short-term indicators support cautious optimism. The Money Flow Index (MFI) holds above 60, signaling renewed capital inflows.
Meanwhile, the moving average convergence divergence (MACD) has flipped bullish, with histogram bars expanding modestly.
Disclaimer:
The information provided in this article is for informational purposes only. It is not intended to be, nor should it be construed as, financial advice. We do not make any warranties regarding the completeness, reliability, or accuracy of this information. All investments involve risk, and past performance does not guarantee future results. We recommend consulting a financial advisor before making any investment decisions.
Victor Olanrewaju is a crypto analyst and reporter at CCN with deep roots in on-chain research and technical analysis. His crypto journey began in 2017, but it was the 2020 Uniswap airdrop that sparked a full-time pivot into the space.
With a foundation in copywriting, Victor honed his craft creating high-converting content for leading crypto brokers — most notably an XRP price prediction that ranked #1 on Google during the 2021 bull run.
He later joined AMBCrypto in 2022, where he combined storytelling with technical and on-chain analysis to cover key market narratives.
In 2024, he expanded his expertise at BeInCrypto, collaborating with analysts and using tools like Glassnode, Santiment, and IntoTheBlock to break down Bitcoin and altcoin trends.
At CCN, Victor covers the top cryptocurrencies, memecoins, macro shifts, blending real-time insights with deep-dive metrics.
He holds a Bachelor’s degree in Physics from the University of Ibadan, equipping him to simplify complex data for a wide audience. Follow his work or connect on LinkedIn or X.