Can PI, DOT, and XRP outperform BTC in March? | Credit: Hameem Sarwar
Share
Key Takeaways
DOT is approaching a supply shock in March, where a tokenomics overhaul will slash annual inflation.
PI is positioned as a high-risk, high-reward play, showing signs of a breakout from a descending channel.
XRP is currently trading at the apex of a descending trendline, with a potential breakout target of $2.09.
Bitcoin (BTC) price has continued to consolidate under heavy selling pressure. While that alone signals caution, it also creates an opportunity.
Historically, the best altcoin moves do not happen when Bitcoin is surging. Instead, they happen when Bitcoin is sideways or recovering.
With three significant catalysts converging in March 2026, Polkadot (DOT), Pi Network (PI), and XRP stand out as the altcoins most likely to deliver outperformance this month.
Polkadot (DOT)
Polkadot has a hard date that the entire market can trade around. On March 14, 2026 — “Pi Day” — the network executes its community-approved tokenomics overhaul.
Annual token issuance drops from 120 million to 56.88 million DOT, slashing inflation from roughly 10% to just 3.11%.
A hard supply cap of 2.1 billion DOT is simultaneously activated.
Get These Top Crypto Casino Offers Now!
Sponsored
Disclosure
We sometimes use affiliate links in our content, when clicking on those we might receive a commission at no extra cost to you. By using this website you agree to our terms and conditions and privacy policy.
This is DOT’s equivalent of a Bitcoin halving. Furthermore, two major ETF filings from Grayscale and 21Shares are building an institutional access narrative in parallel.
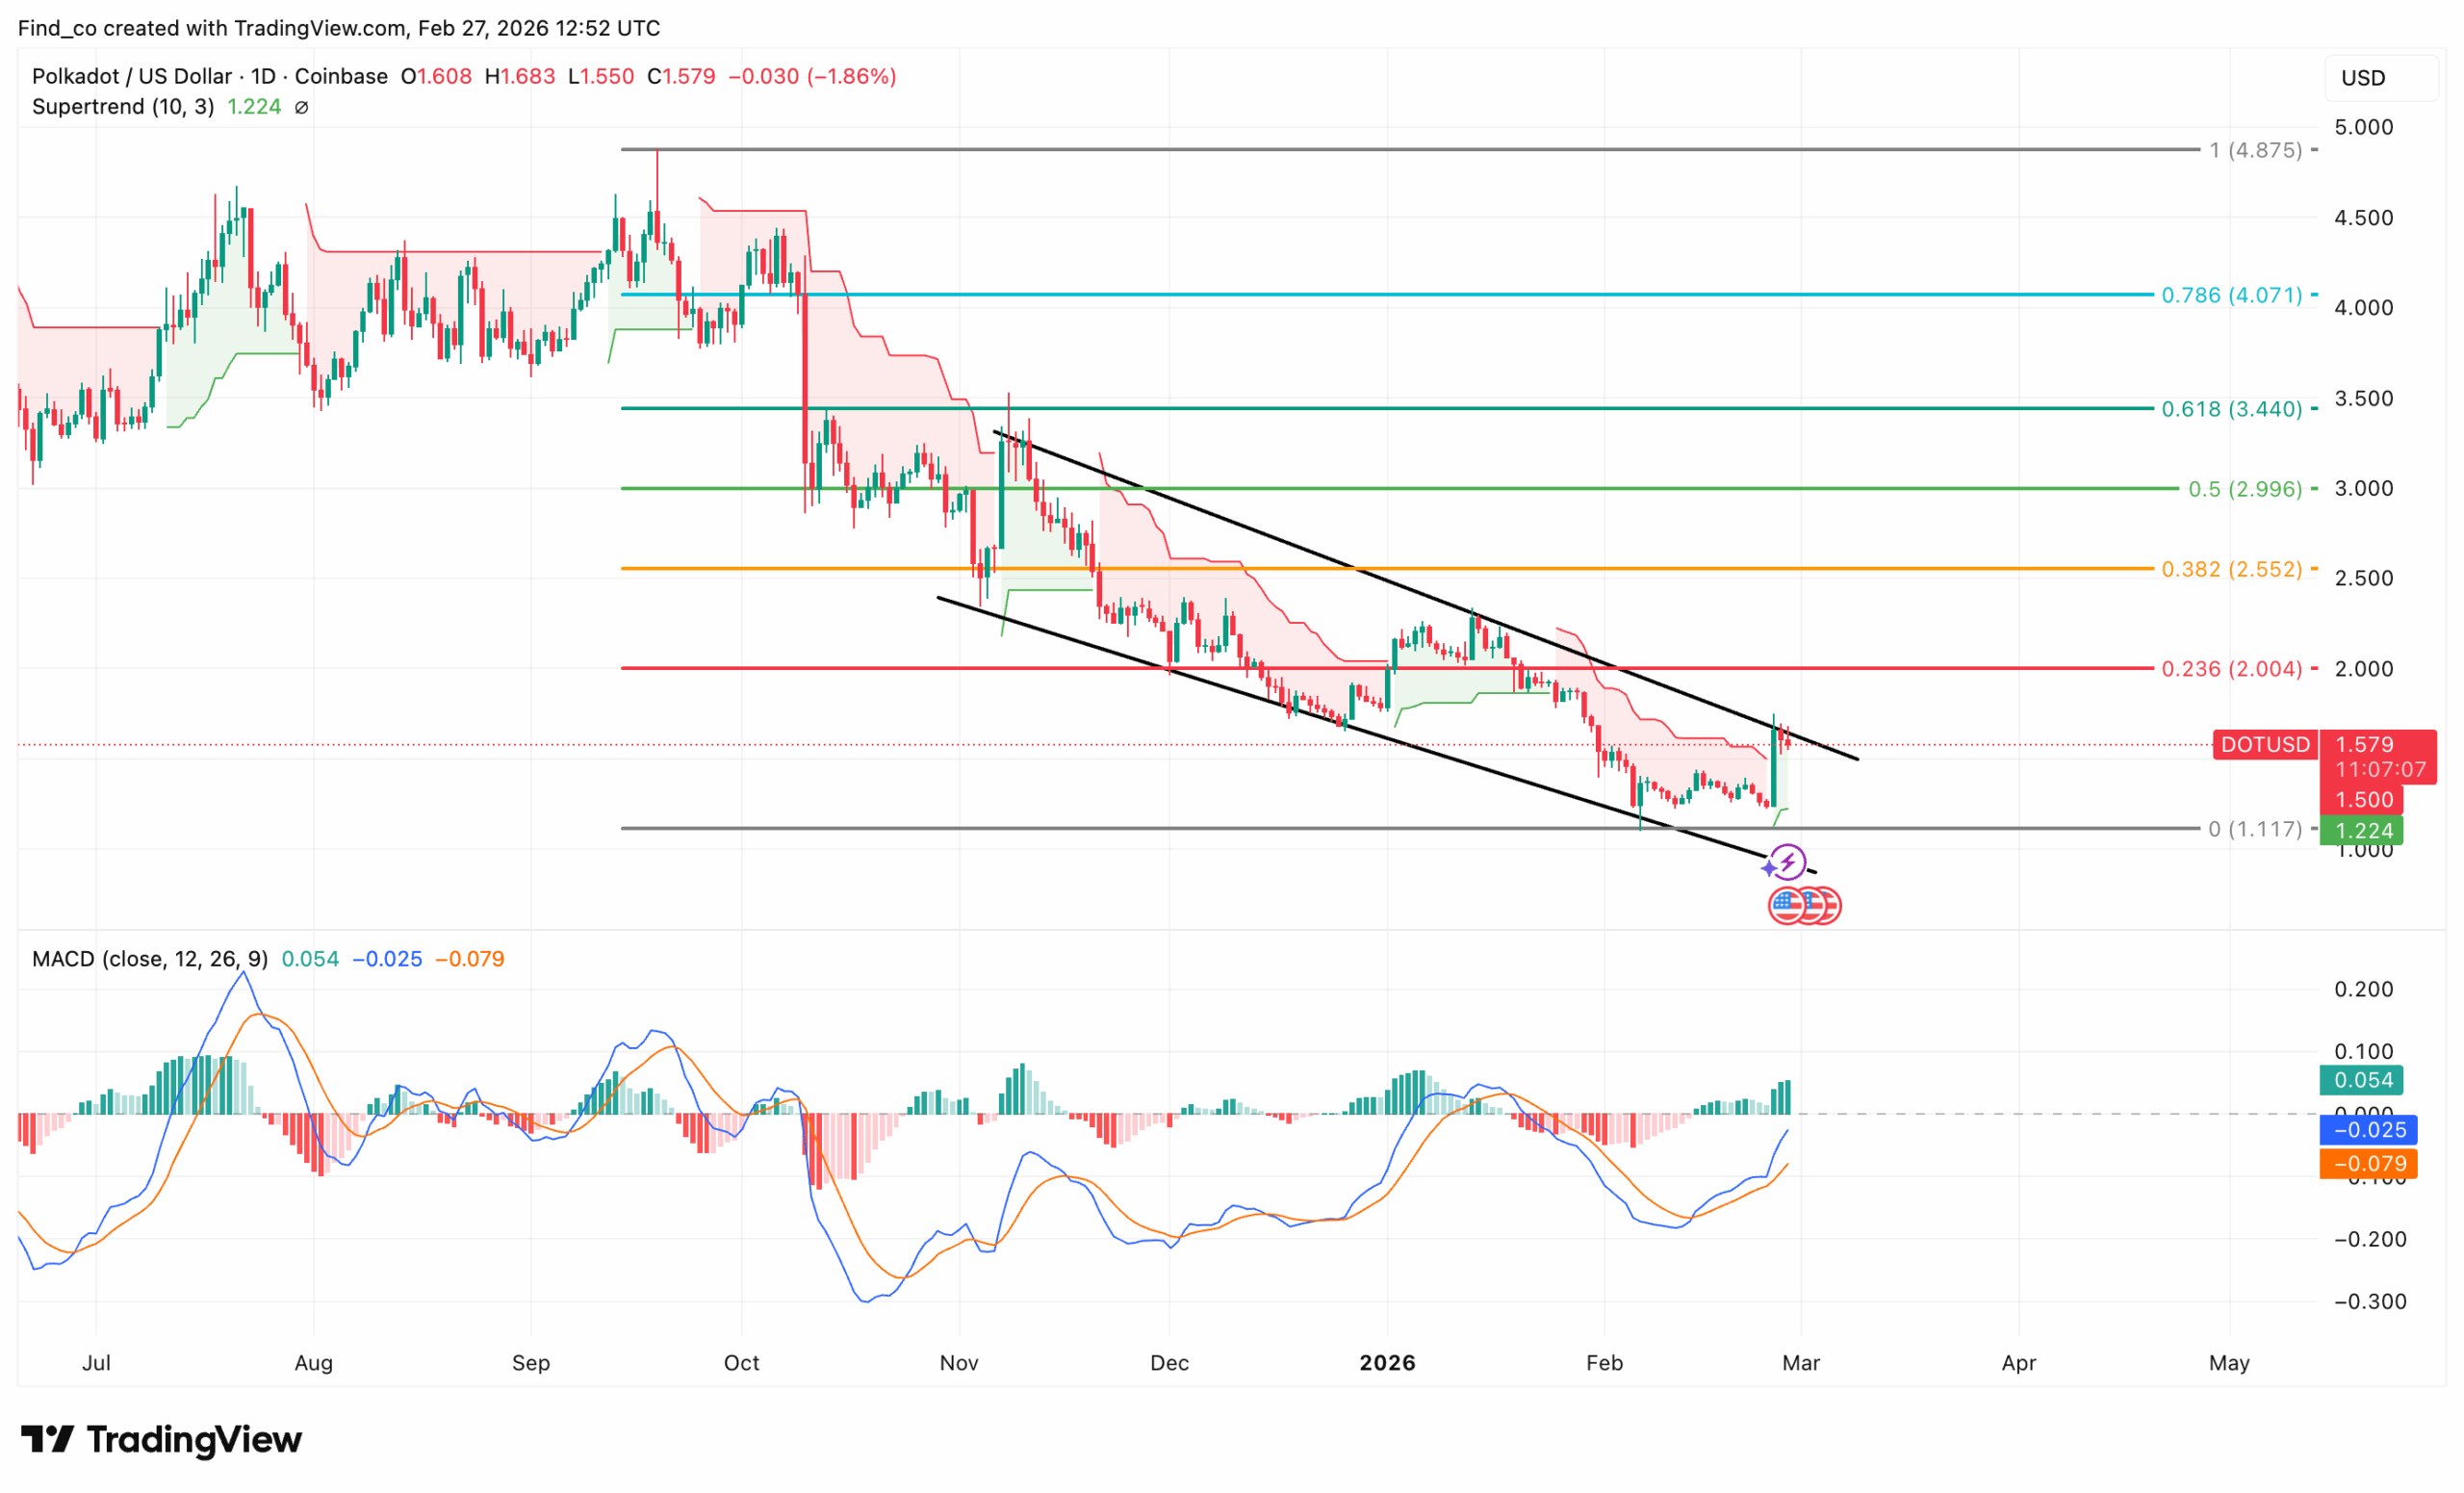
Polkadot is fighting for structure. DOT trades at $1.58, down 1.86% on the day. However, the daily chart is showing the most constructive setup in months.
The descending channel that has trapped the DOT price since October is being tested right now.
Price bounced off the zero Fib floor at $1.117 earlier this week.
However, the current candle is pressing against it. A daily close above the channel trendline would be the first structural break in over four months.
The Supertrend (10, 3) sits at $1.22, now below the current price after flipping earlier this week. DOT is holding above it.
That’s a meaningful development. Every day Polkadot’s price closes above $1.224, the bullish Supertrend reading is reinforced.
The MACD confirms the shift. The MACD line (0.054) has crossed above the signal line (-0.025), and histogram bars have turned green (the first bullish crossover on the daily chart) since the bear trend began.
The signal line remains negative at -0.025, meaning the crossover is fresh and untested, but the direction is unambiguous.
The first real target above the channel is $2.004 (0.236 Fib). That’s a 27% move from the current price.
However, if demand for DOT and other altcoins slides in March, this prediction might not come to pass. Instead, DOT might decline to $1.12.
Pi Network (PI)
Pi Network is the highest-risk, highest-reward pick of the three altcoins. The altcoin is currently sitting more than 95% below its February 2025 all-time high of $2.98.
The project is actively expanding its open mainnet; approximately 2.5 million previously restricted users were recently unblocked for migration.
Furthermore, Pi App Studio was updated in January 2026 with no-code payment integration tools.
Additionally, speculation is building about an exchange listing, with Kraken cited as a potential venue.
Therefore, the risk-reward is asymmetric. As such, any confirmed major listing in March would deliver explosive outperformance against Bitcoin almost instantly.
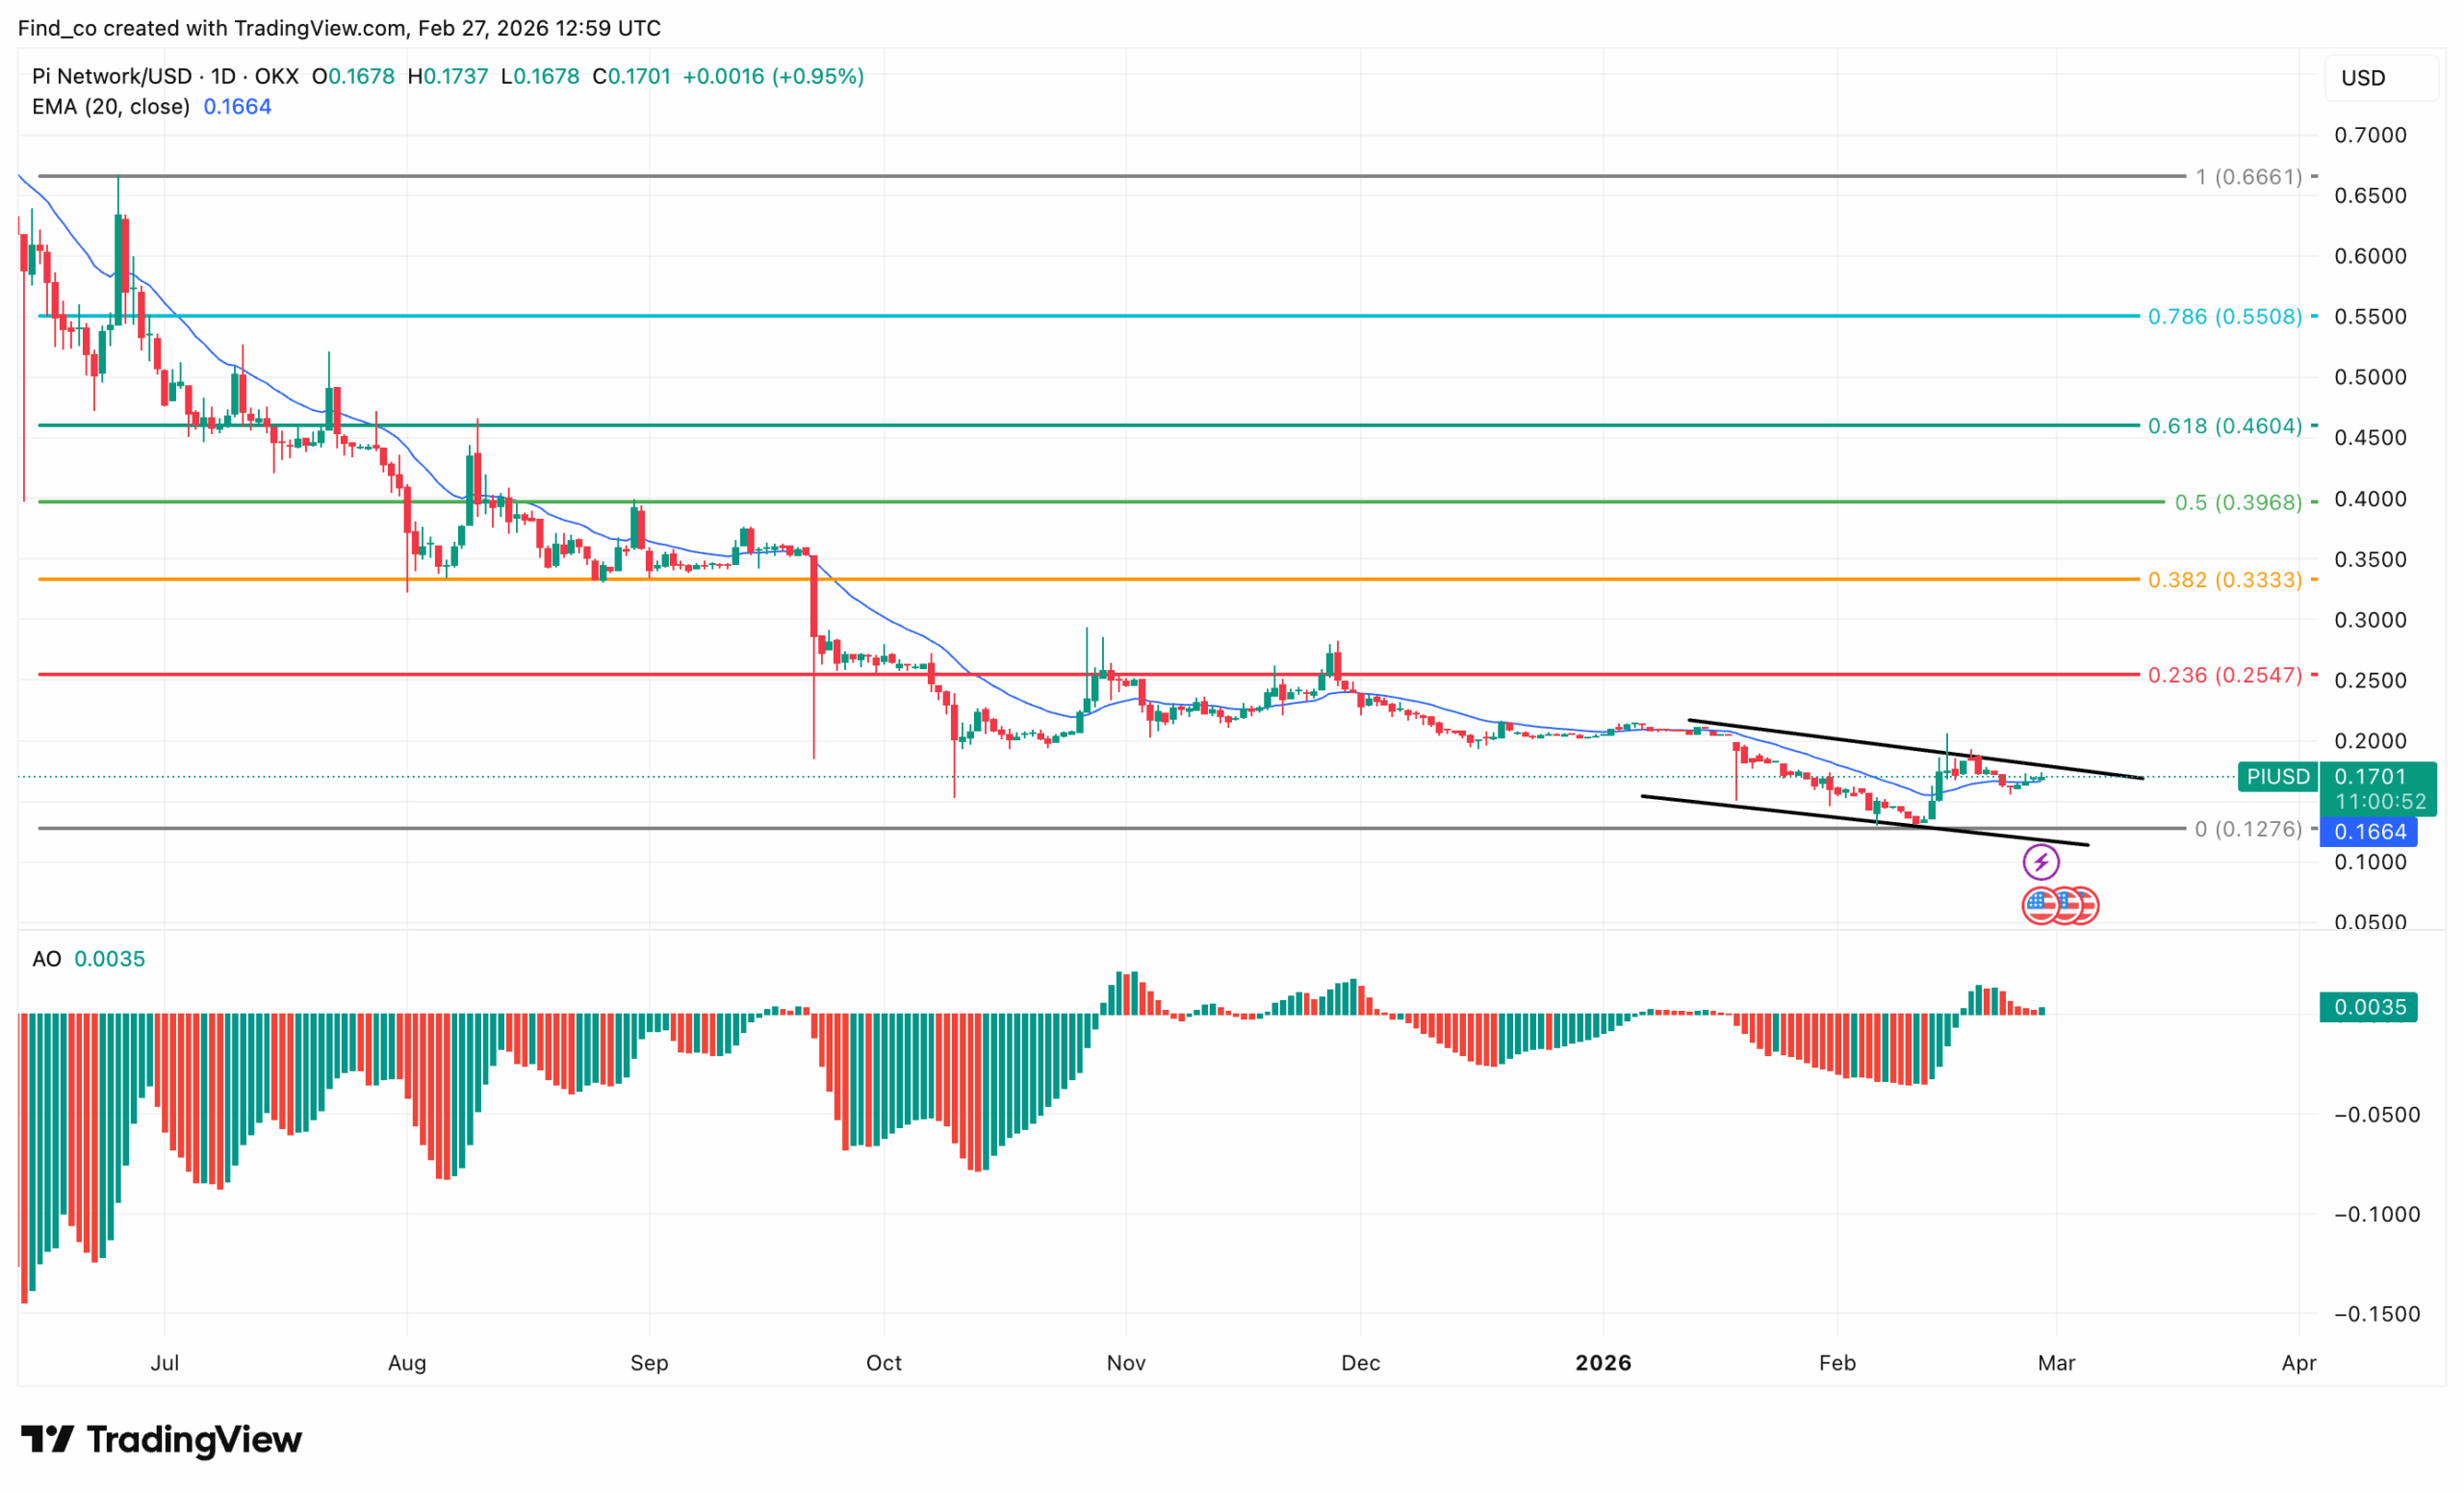
Pi Network is attempting a breakout from its tightest compression point since listing. At the time of writing, PI coin trades at $0.17, and has just broken above a descending channel.
Since the June launch high near $0.6661, PI has shed over 74% in a relentless downtrend, cutting through every Fibonacci level — 0.786, 0.618, 0.5, 0.382, and 0.236, without a notable recovery.
The zero Fib floor at $0.1276 is the last line before uncharted territory.
What’s changed this week is the microstructure.
A descending channel formed in January and February, compressing PI’s price toward that $0.1276 floor.
Furthermore, the price has now broken above the channel’s upper boundary and reclaimed the 20-EMA at $0.1664 — trading above it for the first time in weeks.
The Awesome Oscillator (AO) at 0.0035 has just crossed above zero. It’s a marginal reading, but the direction matters.
If sustained, the first real target is $0.25 (0.236 Fib), which is a 50% move from the current price.
That’s the minimum threshold bulls need to reclaim to suggest a recovery is underway.
However, PI needs sustained closes above $0.17 to confirm the break is real, not another false dawn.
XRP
XRP has the strongest structural foundation of the three. The SEC lawsuit ended in August 2025, removing the single largest overhang that had suppressed institutional participation for five years.
Since November 2025, spot XRP ETFs have attracted $1.37 billion in inflows, led by Franklin Templeton.
Furthermore, the XRP Ledger’s 2026 overhaul — adding zero-knowledge proofs and a native lending protocol that targets institutional DeFi users directly.
As a result, XRP is positioned, with its catalyst stack compounding rather than being isolated.
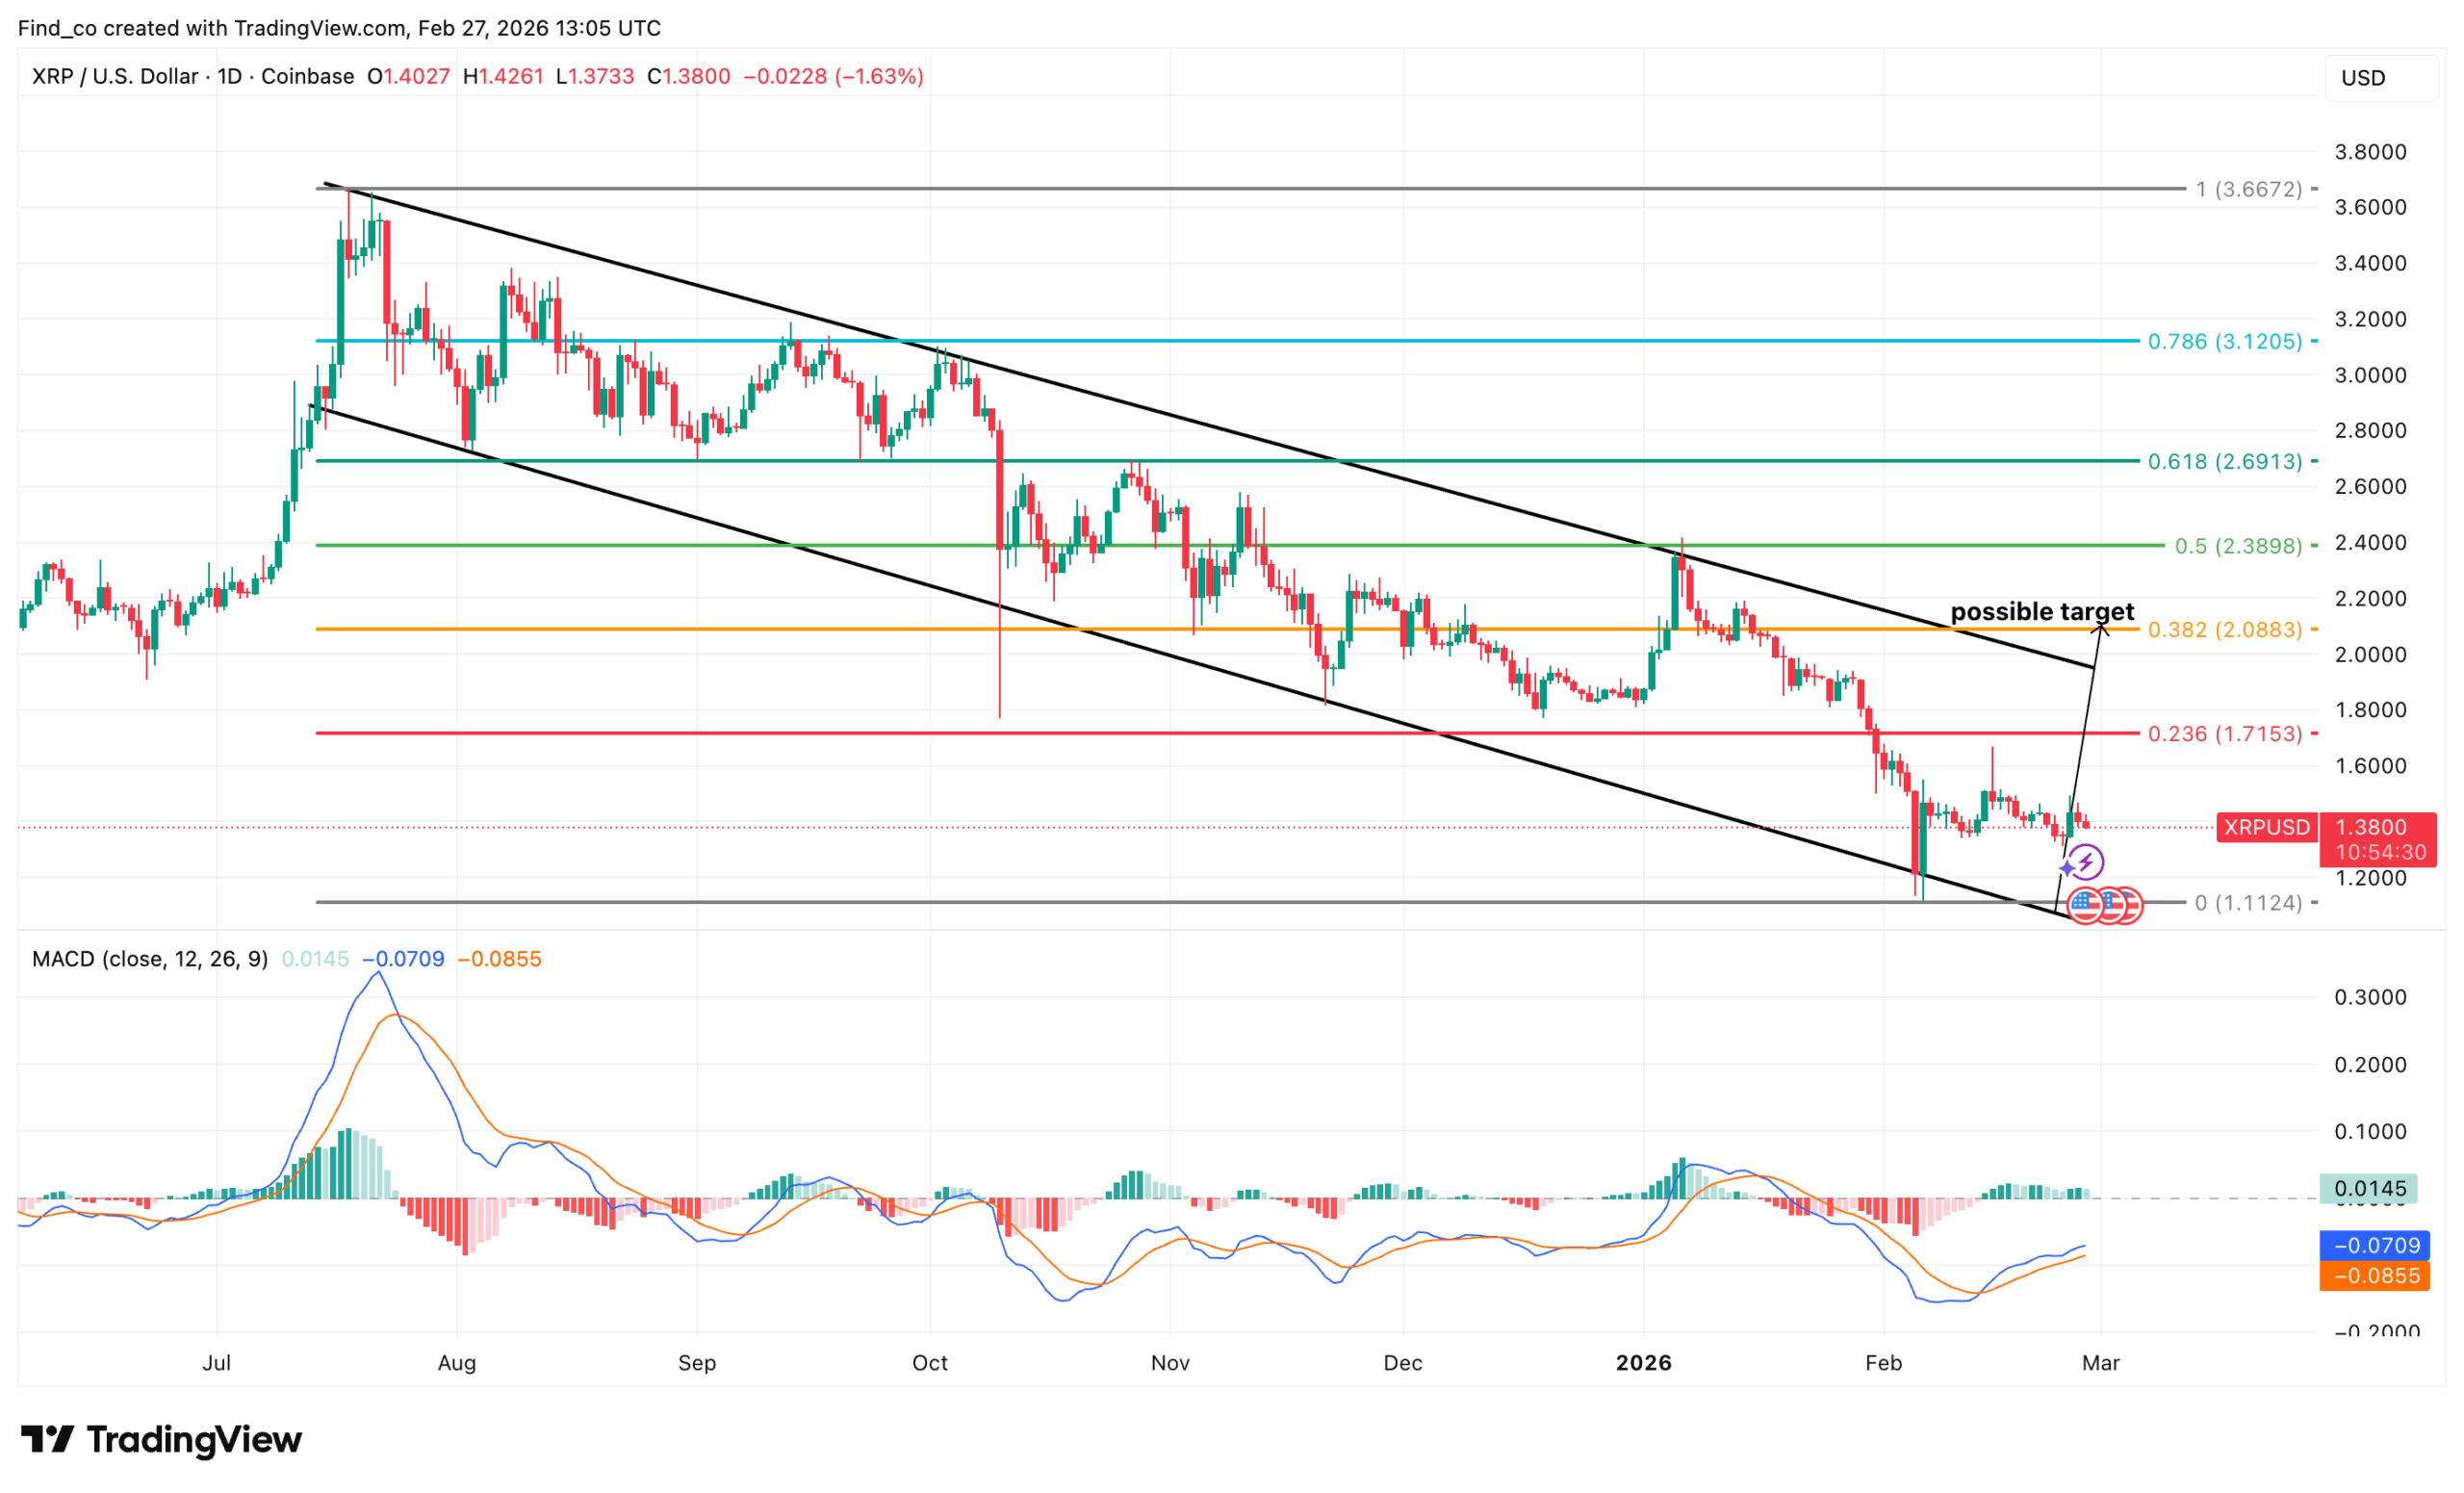
XRP is pressing against a make-or-break level. The token trades at $1.38, down 1.63% on the day, but sits directly at the apex of a massive descending triangle that has compressed the price since the July peak
The structure is unmistakable. A falling upper trendline has capped every rally since August — rejecting price at $3.20, $2.80, $2.40, and $2.10 in succession.
Below, a flat support floor near $1.20 has held on every test.
Those two lines now converge at the current price.
The chart annotates a possible target at $2.0883 (0.382 Fib) on a breakout above the trendline. That’s a 51% move from the current price.
A daily close above the descending trendline, currently near $1.50, triggers the bull case toward $1.7153 (0.236 Fib) first, then $2.09..
On the contrary, a breakdown below $1.20 invalidates the triangle support and opens a path to the 0 Fib at $1.1124.
Disclaimer:
The information provided in this article is for informational purposes only. It is not intended to be, nor should it be construed as, financial advice. We do not make any warranties regarding the completeness, reliability, or accuracy of this information. All investments involve risk, and past performance does not guarantee future results. We recommend consulting a financial advisor before making any investment decisions.
Victor Olanrewaju is a crypto analyst and reporter at CCN with deep roots in on-chain research and technical analysis. His crypto journey began in 2017, but it was the 2020 Uniswap airdrop that sparked a full-time pivot into the space.
With a foundation in copywriting, Victor honed his craft creating high-converting content for leading crypto brokers — most notably an XRP price prediction that ranked #1 on Google during the 2021 bull run.
He later joined AMBCrypto in 2022, where he combined storytelling with technical and on-chain analysis to cover key market narratives.
In 2024, he expanded his expertise at BeInCrypto, collaborating with analysts and using tools like Glassnode, Santiment, and IntoTheBlock to break down Bitcoin and altcoin trends.
At CCN, Victor covers the top cryptocurrencies, memecoins, macro shifts, blending real-time insights with deep-dive metrics.
He holds a Bachelor’s degree in Physics from the University of Ibadan, equipping him to simplify complex data for a wide audience. Follow his work or connect on LinkedIn or X.