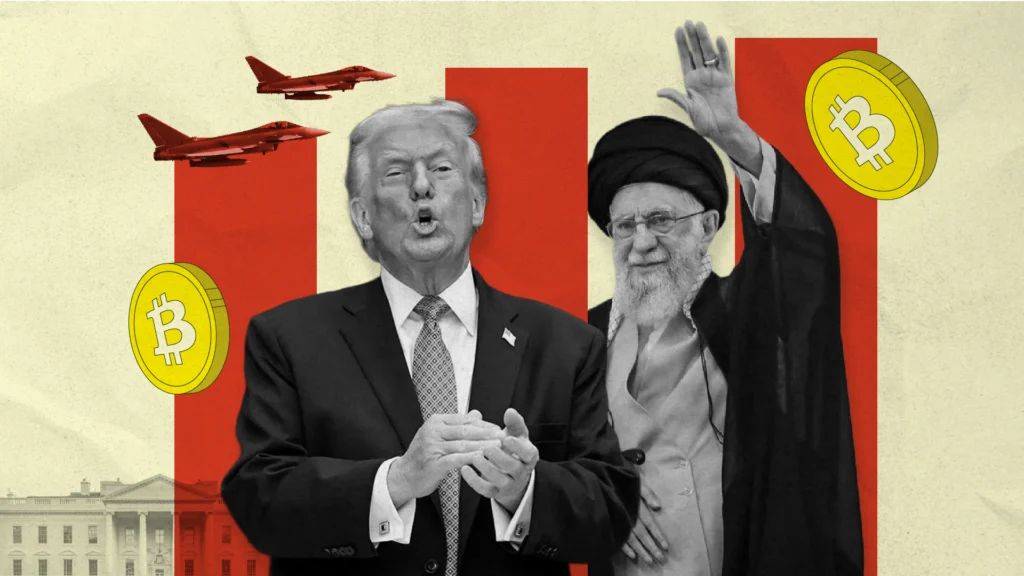
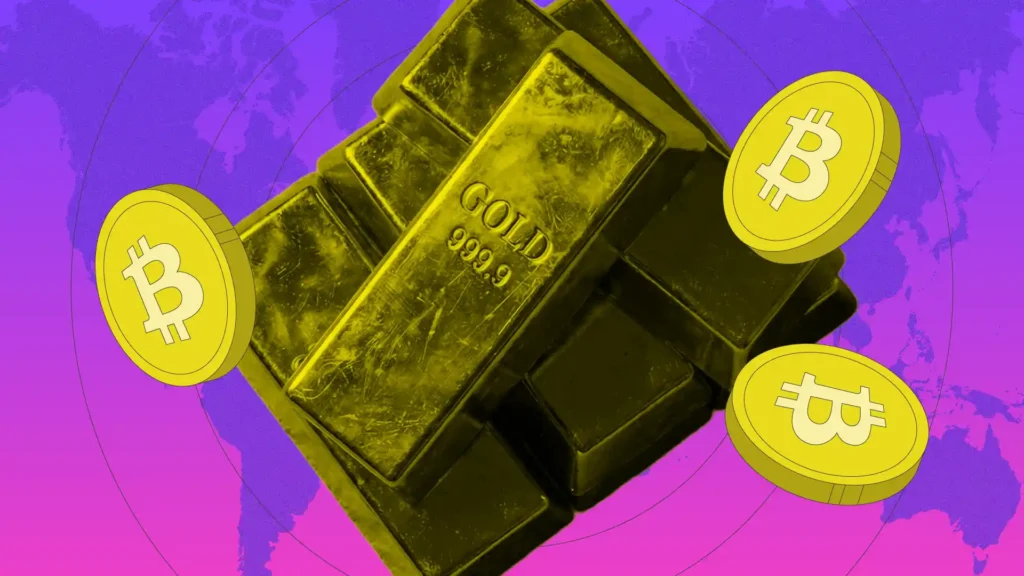
What next for BTC and oil price and U.S. Iran target end to the war? | Credit: Hameem Sarwar
Share
Key Takeaways
Oil prices fell to $100 amid signs that the Middle East geopolitical tension could end soon.
Bitcoin, on the other hand, jumped, while the USOR token climbed 50% over the last 24 hours.
This analysis reveals what lies ahead for BTC, global crude price, and the USOR cryptocurrency.
Global financial markets are executing one of the most significant de-escalation trades of the current conflict cycle as April begins.
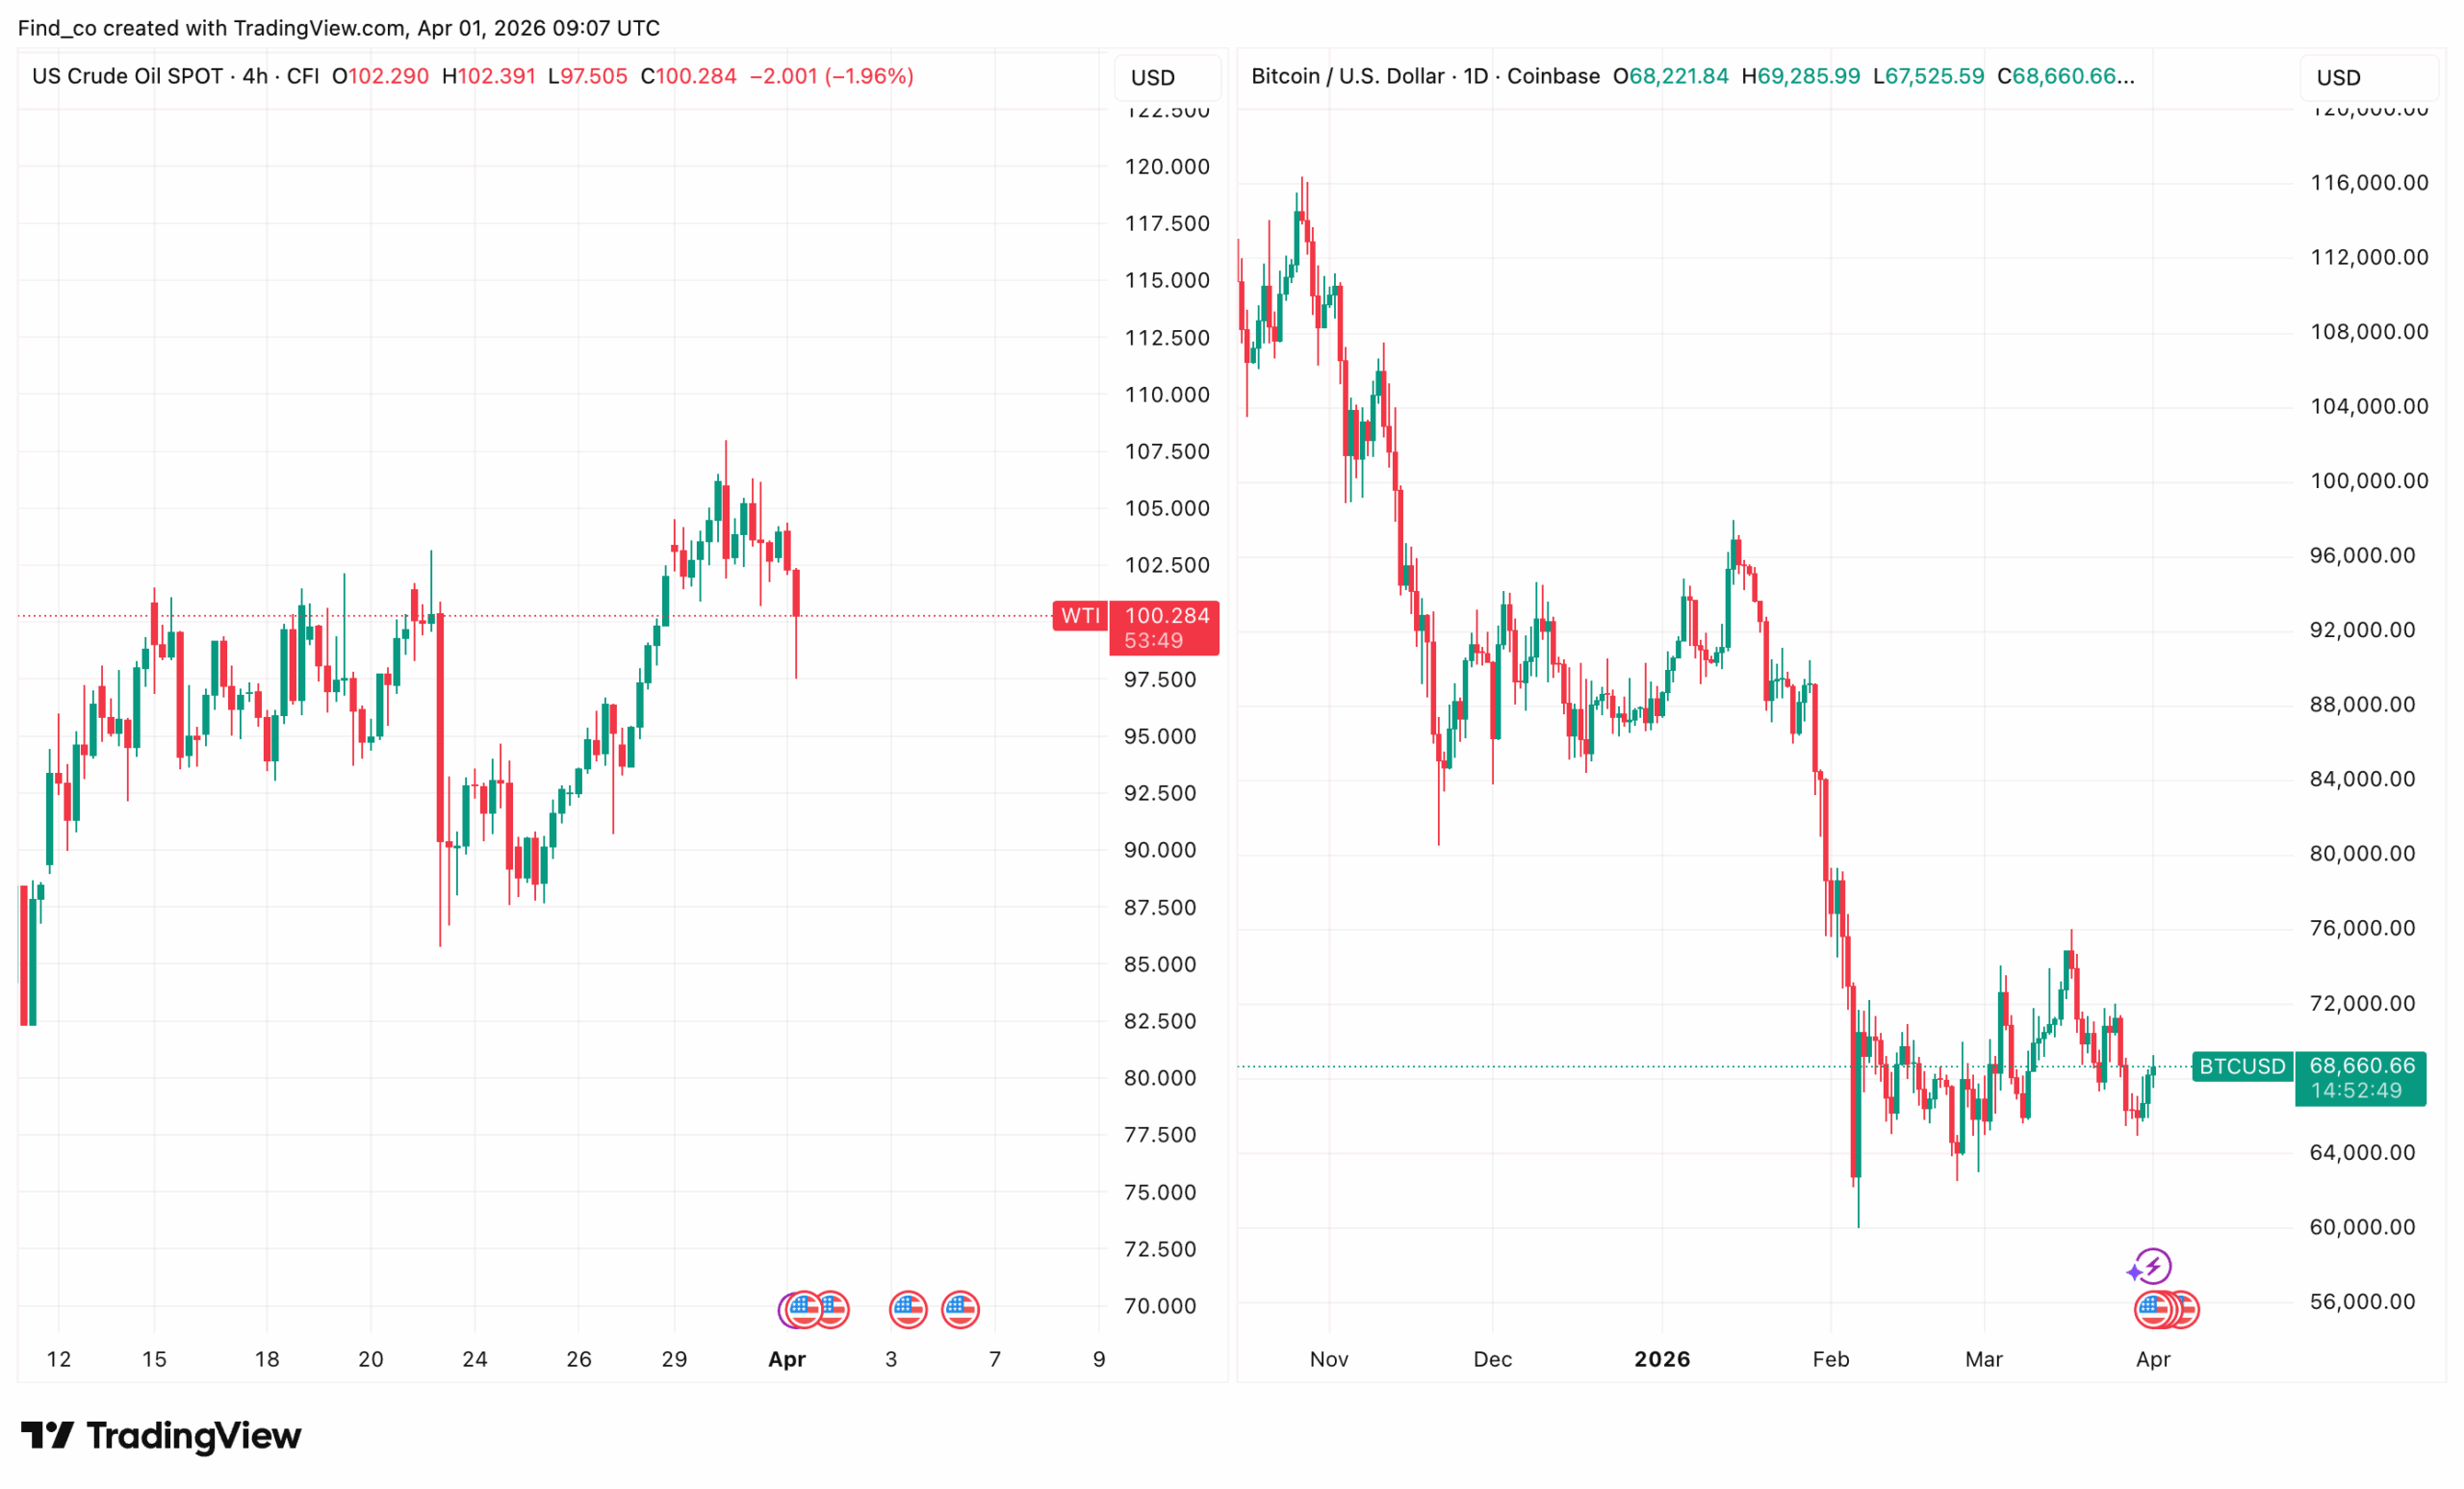
At the time of writing, crude oil prices are hovering around the $100 psychological floor.
Bitcoin (BTC), on the other hand, has advanced to $68,445. The VIX fear index has collapsed 12.4% to 18.40, while the Solana-based U.S. Oil (USOR) token has surged 50%.
But why has this happened, and what lies ahead?
What Happened?
The catalyst is a rare and simultaneous diplomatic signal from both sides of the conflict.
“I would say that within two weeks, maybe two weeks, maybe three. We’ll leave because there’s no reason for us to do this.” He said.
That statement arrived alongside Iranian President Masoud Pezeshkian’s confirmation to the European Council that Tehran possesses the necessary will to end the war, subject to receiving a 15-point mechanism of guarantees against future aggression.
Two signals. One direction. As a result, the broader financial market is pricing in a potential end to the Iran war.
What the Market Is Saying
The simultaneous movement across multiple asset classes on April 1 is not coincidental. It is the coherent expression of a single macro thesis repricing simultaneously.
Brent crude is trading at $105.19, down 3.13%, and testing the psychological floor that marks the line between an energy crisis and an energy shock.
WTI briefly slid below $100 for the first time in weeks, while Bitcoin’s move to $68,445 is equally instructive.
Bitcoin’s price rallied approximately 2.65% to around $68,207 on March 31, with Ethereum (ETH) gaining over 4%, and derivatives data showing traders unwinding bearish positions.
The continuation of that move into April 1 confirms the risk-on interpretation is sustaining rather than fading.
If Bitcoin’s price rebounds above $70,000 in the coming sessions, it could embolden bulls to push prices higher.
But that’s not all.
USOR Price Jumps: What Next?
Outside of oil and BTC, the USOR token has surged 50% in the last 24 hours.
In the early days of the Iran war, the Solana-based US Oil Reserve token rallied to incredible numbers. Later, it crashed, erasing all those gains despite the rise in oil prices.
Now, it is moving in the opposite direction to crude oil prices. But does that mean the USOR price will keep rising?
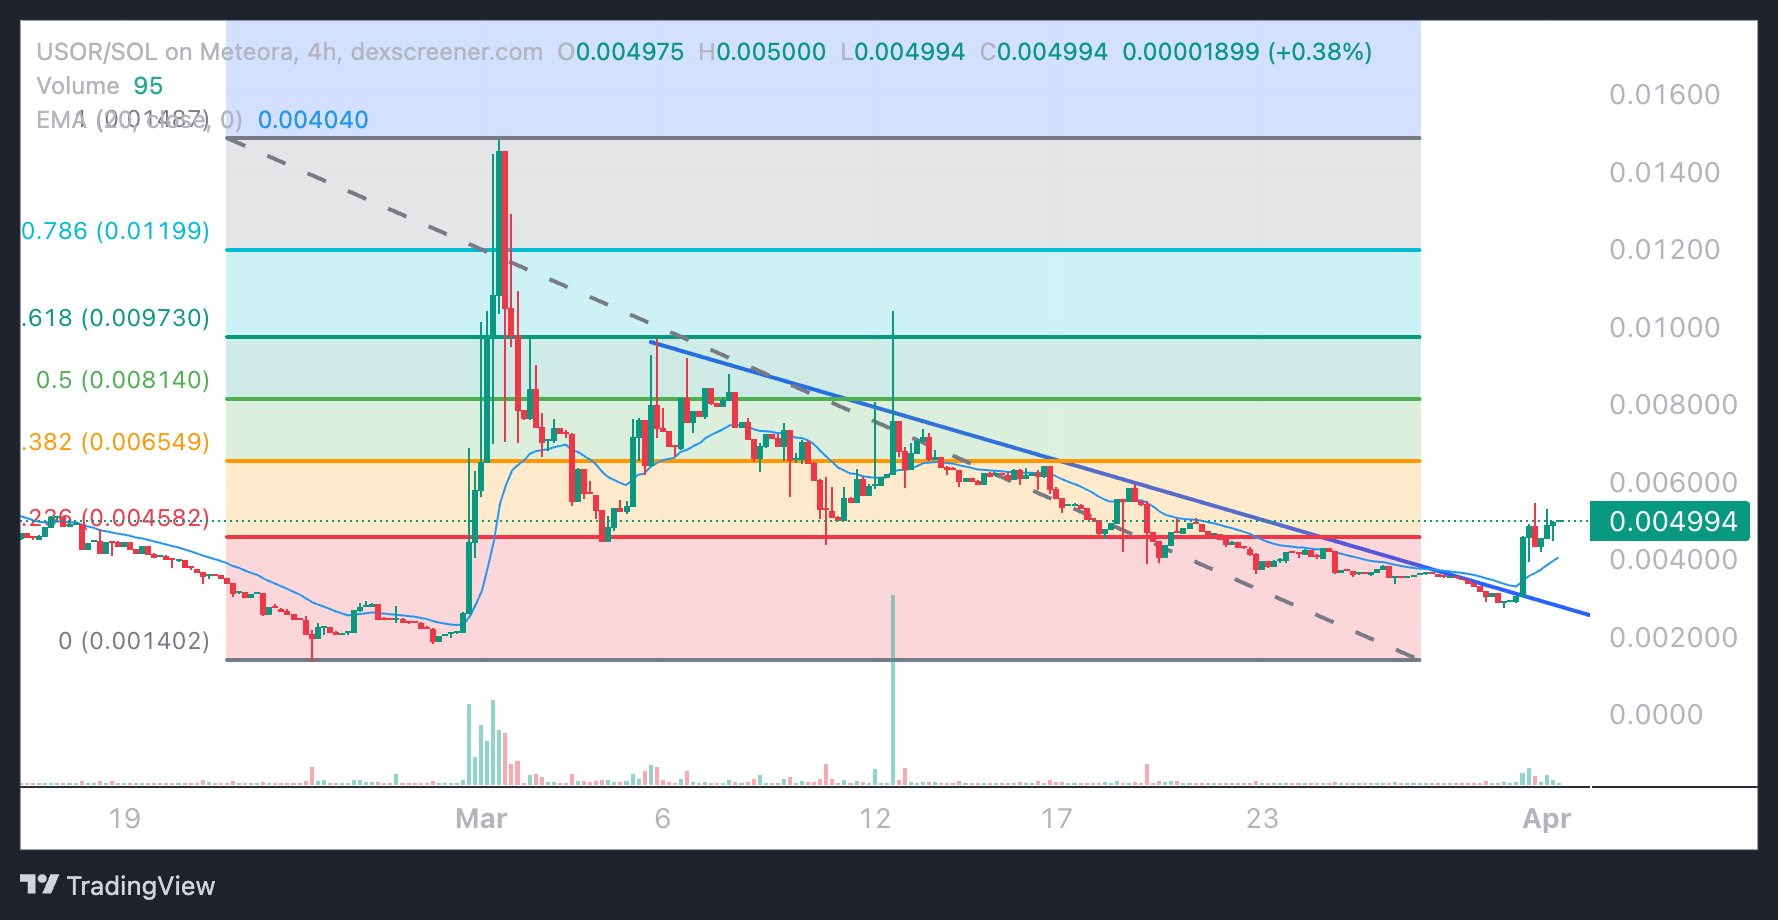
On the 4-hour chart, USOR trades at 0.0050 despite the modest daily move.
The dashed descending trendline captured every failed recovery attempt, pushing price toward lows near 0.0035 by late March, territory dangerously close to the zero Fibonacci floor at 0.001402.
Then, around April 1, something shifted. Price broke above both the descending channel’s upper boundary and the EMA at 0.0040 in the same move.
Furthermore, USOR has reclaimed the 0.236 Fibonacci level at 0.0046, which is the first meaningful Fibonacci recovery since the post-pump decline began.
Volume remains thin throughout March, which is a concern that any recovery must eventually address. Without volume expansion, breakouts in low-liquidity DEX pairs can reverse just as quickly as they emerge.
As it stands, the immediate targets for continued strength are the 0.382 level at 0.0065 and the 0.5 level at 0.0081.
However, the descending dashed trendline continues pressing lower, and USOR’s price must stay above the 0.004040 EMA to maintain this early recovery momentum.
Diplomacy Still Not Guaranteed
Iran’s position requires a precise rather than an optimistic reading. Pezeshkian’s confirmation of the necessary will to end the war is the most direct peace signal Tehran has issued since the conflict began on February 28.
However, the conditionality is specific and demanding. Iran is seeking guarantees through a 15-point mechanism covering cessation of US and Israeli military strikes, sanctions relief, and structural commitments against future aggression.
A 15-point framework aimed at resolving the conflict was presented to Iran via Pakistani intermediaries, and markets have since settled following the earlier bout of volatility.
The historical context of that framework matters.
Iran formally rejected a previous US-brokered 15-point ceasefire proposal, with Tehran’s foreign minister dismissing the plan as one-sided and maximalist, calling US claims of productive negotiations fake news.
The current diplomatic signal represents an evolution from that rejection rather than a resolution. So, Iran is now engaging with the framework’s existence rather than dismissing it outright.
A ceasefire would remove the headline risk that has kept Bitcoin range-bound. But a closed Strait of Hormuz, even after a U.S. withdrawal, would keep oil elevated and sticky inflation expectations, complicating the rate-cut path the market has been waiting for.
What to Expect From Bitcoin Price If War Ends
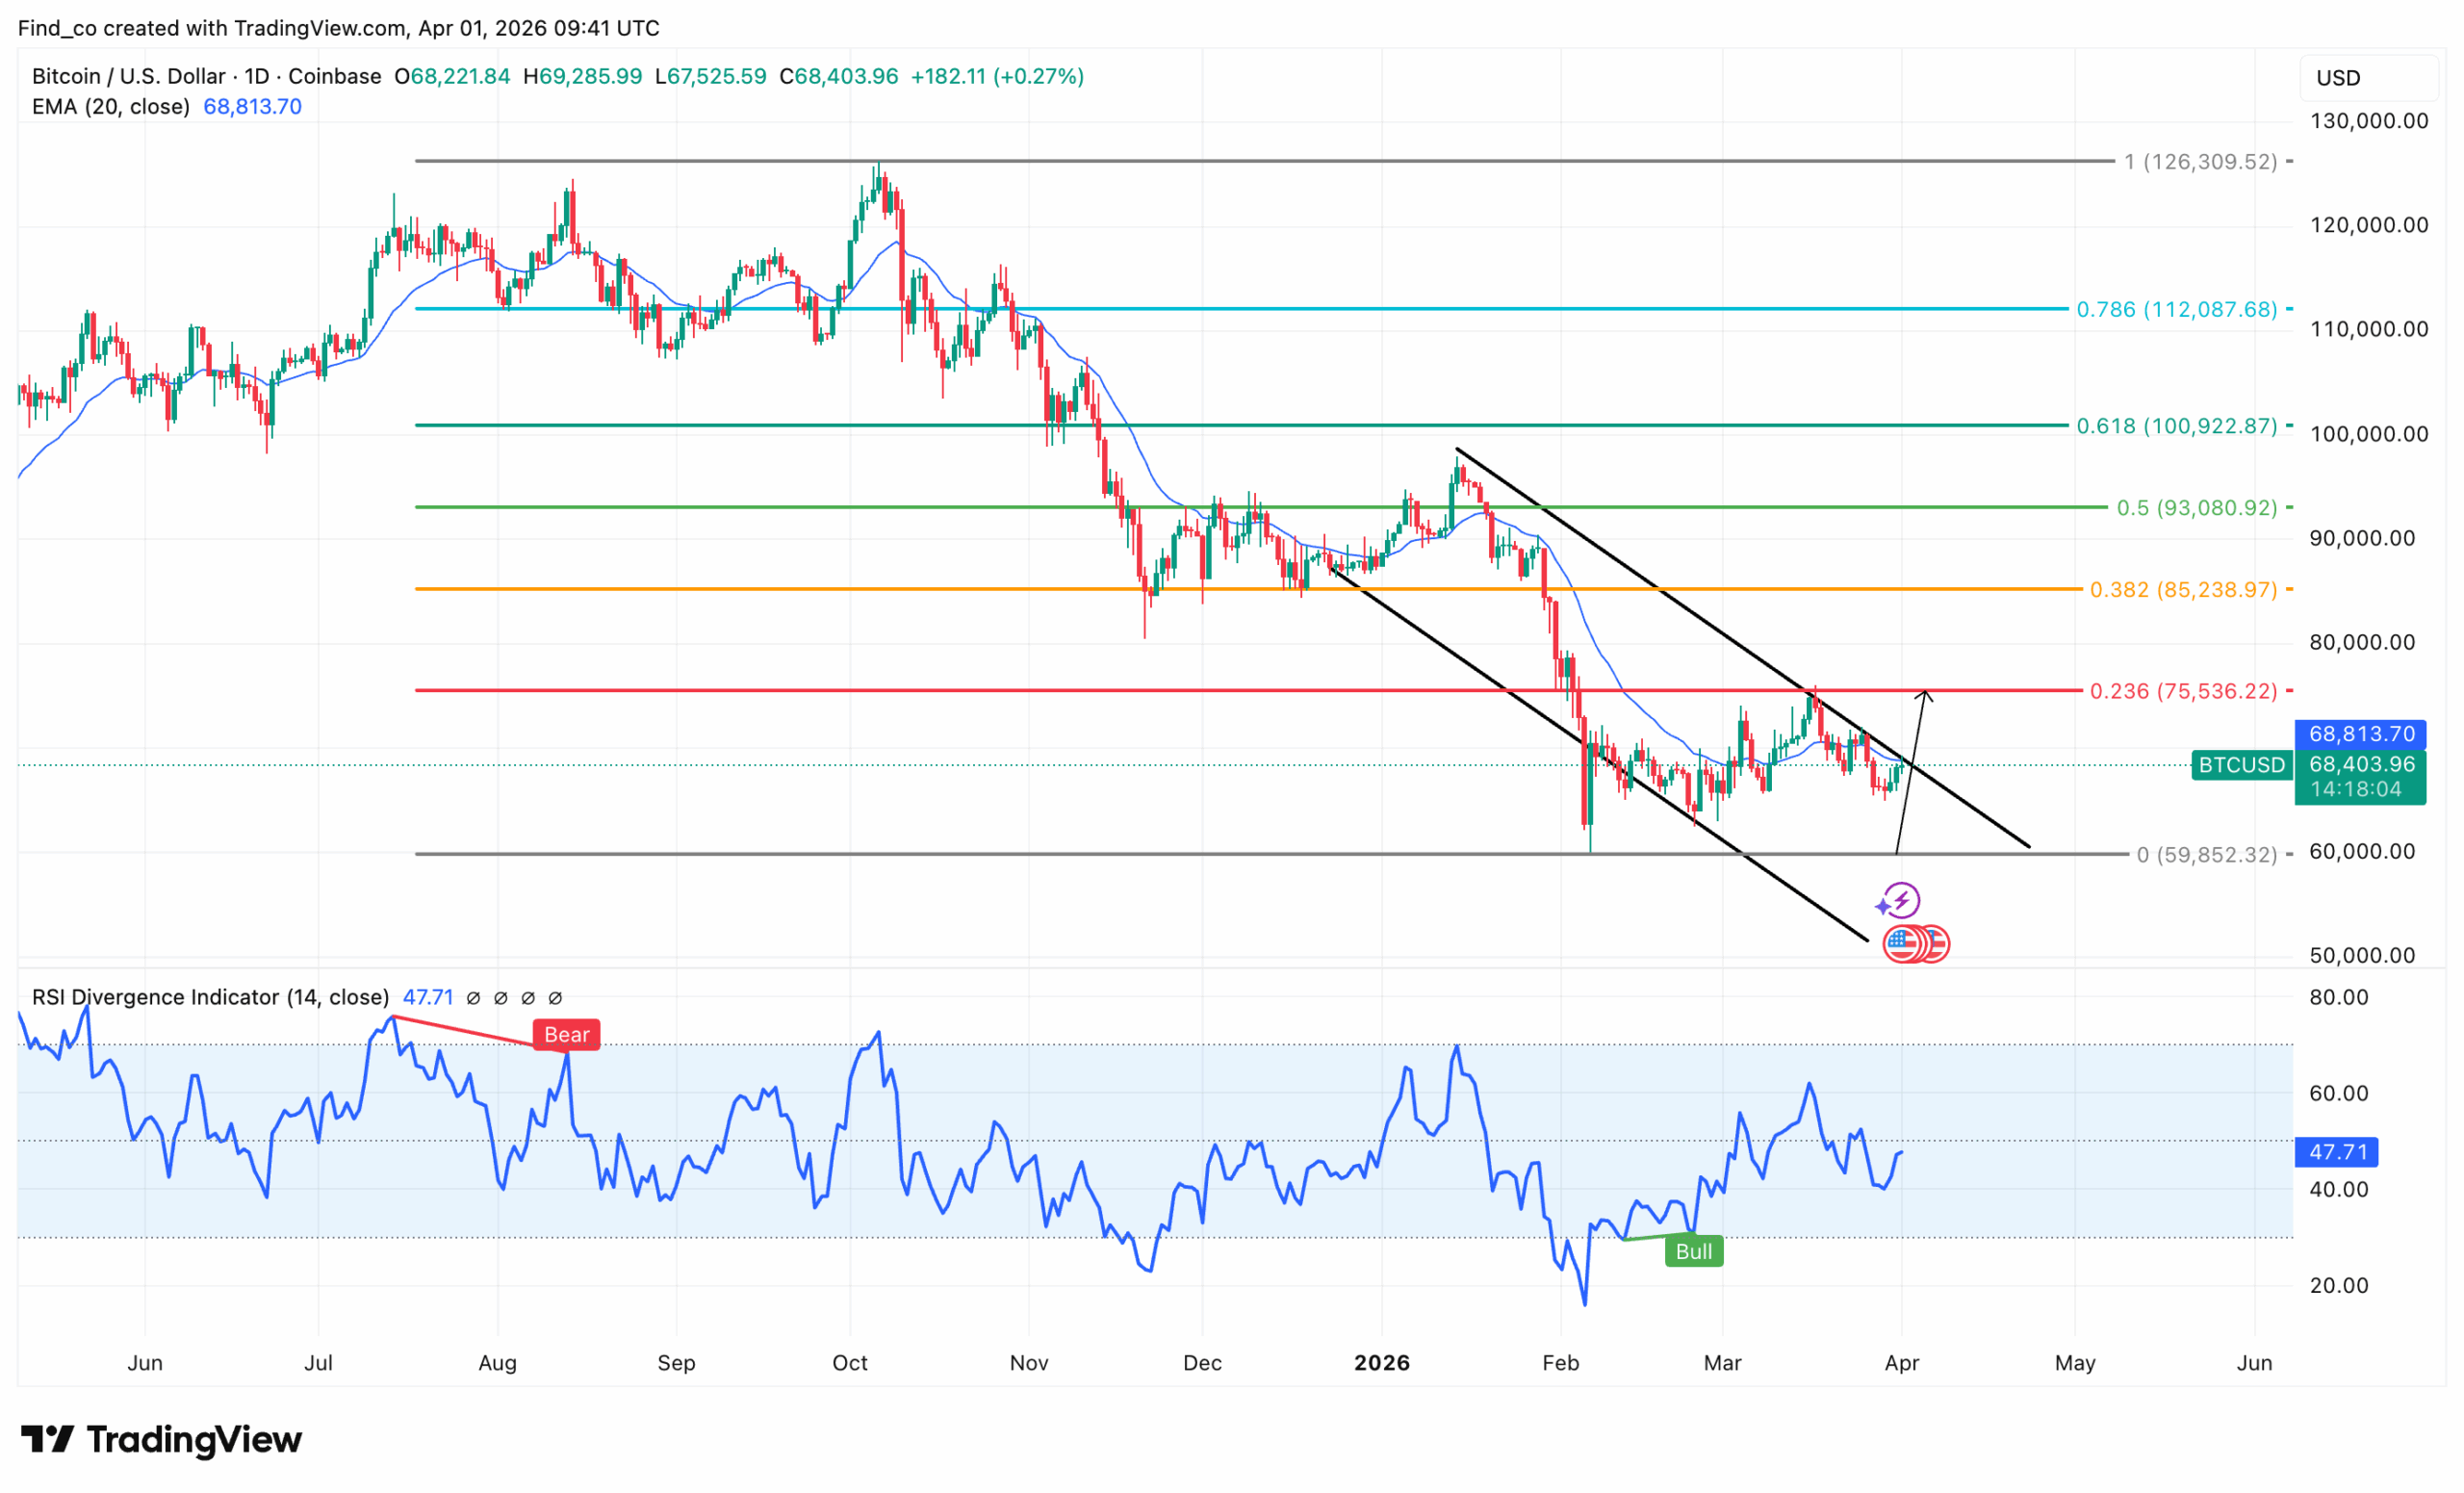
On the daily chart, BTC trades at $68,403. However, the chart structure is building toward a resolution that could determine the next major directional move.
A descending channel has contained Bitcoin’price since the October peak near $126,309.
Every recovery attempt has been sold into the upper trendline, and every breakdown has found support at the lower boundary near $59,852.
Now, price is once again pressing against the upper trendline, with the chart annotating an arrow pointing to the 0.236 Fibonacci level at $75,536 as the breakout target.
The 20 EMA at $68,813 sits just above the current price as immediate resistance. This is essentially the same level as the channel’s upper boundary, which has been in place since the Iran war began.
That confluence makes the $69,000 zone the single most important level on this chart. A daily close above it, backed by volume, would represent the first genuine channel breakout since the downtrend began.
The RSI adds critical context. A bullish divergence signal fired in February as price bottomed near $60,000, and the RSI has since climbed from an extreme low of 22 to 47.71.
That recovery is constructive, but the RSI remains below 50, meaning momentum hasn’t fully flipped bullish yet.
Breaking the channel targets $75,536 first, then $85,238. However, a rejection here risks another leg toward the $59,852 floor, especially if there is no resolution to the Iran war with Israel, and the U.S.
Disclaimer:
The information provided in this article is for informational purposes only. It is not intended to be, nor should it be construed as, financial advice. We do not make any warranties regarding the completeness, reliability, or accuracy of this information. All investments involve risk, and past performance does not guarantee future results. We recommend consulting a financial advisor before making any investment decisions.
Victor Olanrewaju is a crypto analyst and reporter at CCN with deep roots in on-chain research and technical analysis. His crypto journey began in 2017, but it was the 2020 Uniswap airdrop that sparked a full-time pivot into the space.
With a foundation in copywriting, Victor honed his craft creating high-converting content for leading crypto brokers — most notably an XRP price prediction that ranked #1 on Google during the 2021 bull run.
He later joined AMBCrypto in 2022, where he combined storytelling with technical and on-chain analysis to cover key market narratives.
In 2024, he expanded his expertise at BeInCrypto, collaborating with analysts and using tools like Glassnode, Santiment, and IntoTheBlock to break down Bitcoin and altcoin trends.
At CCN, Victor covers the top cryptocurrencies, memecoins, macro shifts, blending real-time insights with deep-dive metrics.
He holds a Bachelor’s degree in Physics from the University of Ibadan, equipping him to simplify complex data for a wide audience. Follow his work or connect on LinkedIn or X.