AAVE price is likely to erase recent losses | Credit: Hameem Sarwar
Share
Key Takeaways
AAVE is showing early signs of recovery after a 10% drop, supported by the V4 launch on Ethereum.
Momentum indicators are turning bullish, but the price is still trapped below key resistance at $100.
The $92 support zone remains critical, as a breakdown could extend losses below another critical zone.
AAVE’s price has declined by 10% over the past seven days. However, the recent launch of the protocol’s V4 on Ethereum could change that position.
At the time of writing, the altcoin trades below $100. But in this analysis, CCN breaks down why this could change.
Aave V4 Fuels Optimism
On March 30, Aave launched V4 on the Ethereum mainnet, marking a significant upgrade to its lending infrastructure.
According to the project, the release introduces improved capital efficiency and greater protocol flexibility, allowing the platform to support a wider range of assets, market structures, and risk profiles.
Stani Kulechov, founder and CEO of Aave, described the launch as one the market needs to watch.
The beginning of a new chapter for Aave as we launch Aave V4 on the Ethereum mainnet. Aave V4 is a next-generation lending protocol designed to expand Aave’s lending capabilities and establish the foundation for a lending market structure for all finance,” he said.
Get These Top Crypto Casino Offers Now!
Sponsored
Disclosure
We sometimes use affiliate links in our content, when clicking on those we might receive a commission at no extra cost to you. By using this website you agree to our terms and conditions and privacy policy.
Meanwhile, AAVE’s price is showing signs of recovery, suggesting that the market is beginning to respond to the upgrade.
Still, the real test lies ahead. Sustained upside will depend on whether V4 drives fresh liquidity, higher user participation, and a measurable increase in Total Value Locked (TVL).
However, early signs of a rebound are emerging. Still, the broader structure suggests caution as bearish control has not fully faded.
On the 4-hour chart, AAVE recently broke down from a mid-range consolidation near $115. The move was decisive.
The price dropped aggressively, tapping a strong horizontal support around $93. This level has since held, preventing further downside.
Since then, price action has shifted into a tight consolidation range just below $100. This indicates a pause in selling. However, it also reflects weak bullish conviction so far.
Momentum indicators are starting to turn. The MACD has printed a bullish crossover, with histogram bars flipping positive. This suggests short-term buying pressure is building.
At the same time, the Relative Strength Index (RSI) has rebounded from oversold territory and is now climbing toward the midline near 50. This reinforces the idea of a potential recovery phase.
However, the structure remains fragile. AAVE is still trading below its recent lower highs. As a result, the market has not yet confirmed a trend reversal.
Immediate resistance sits at $100. This zone aligns with the breakdown region and is likely to attract sellers. A clean break above it could open the door toward $107 and potentially $110.
Bullish Sentiment, Higher Price?
From an on-chain perspective, something unusual is happening with AAVE, which demands careful interpretation.
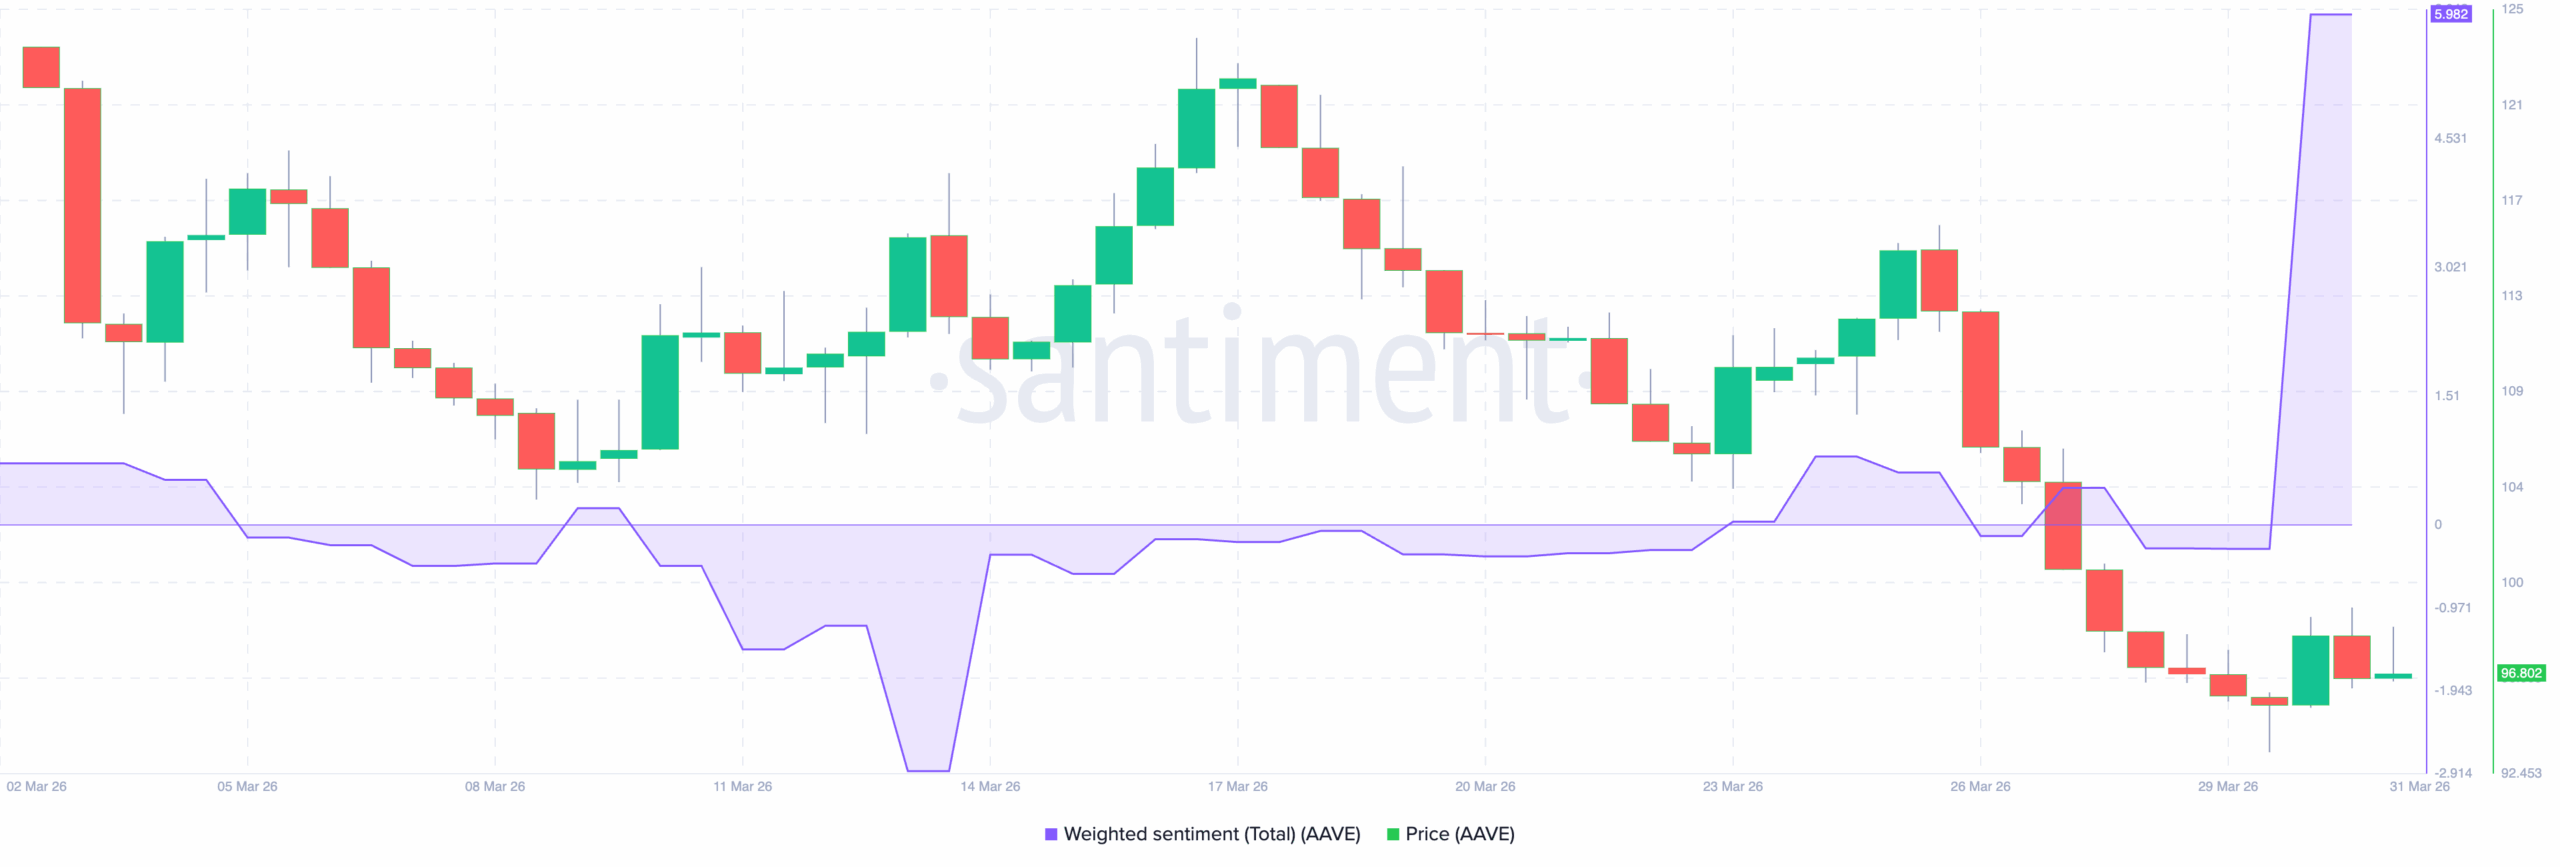
Based on the Santiment chart below, AAVE’s price against weighted sentiment from March 2 to March 31 reveals a striking divergence.
First, the price context. AAVE has been in a consistent downtrend throughout March, sliding from highs near $122 in early March to the current level of $96.80.
For context, this represents a roughly 20% decline.
Now, the sentiment picture. For most of March, weighted sentiment was negative, tracking the price decline.
The deepest negative reading hit around March 13, coinciding with a brief price bounce. That’s the classic contrarian signal — maximum pessimism preceding a recovery.
What’s striking, however, is what’s happening right now. On March 31, sentiment exploded to 5.98, while price sat near its monthly lows at $96.80.
This disconnect cuts both ways. On one hand, surging sentiment without price confirmation could mean the crowd is getting ahead of itself, anticipating a recovery that hasn’t materialised yet.
But for the foreseeable future, extreme sentiment spikes occasionally precede sharp price reversions.
So, if that is the case this time, AAVE’s price could break out toward $200.
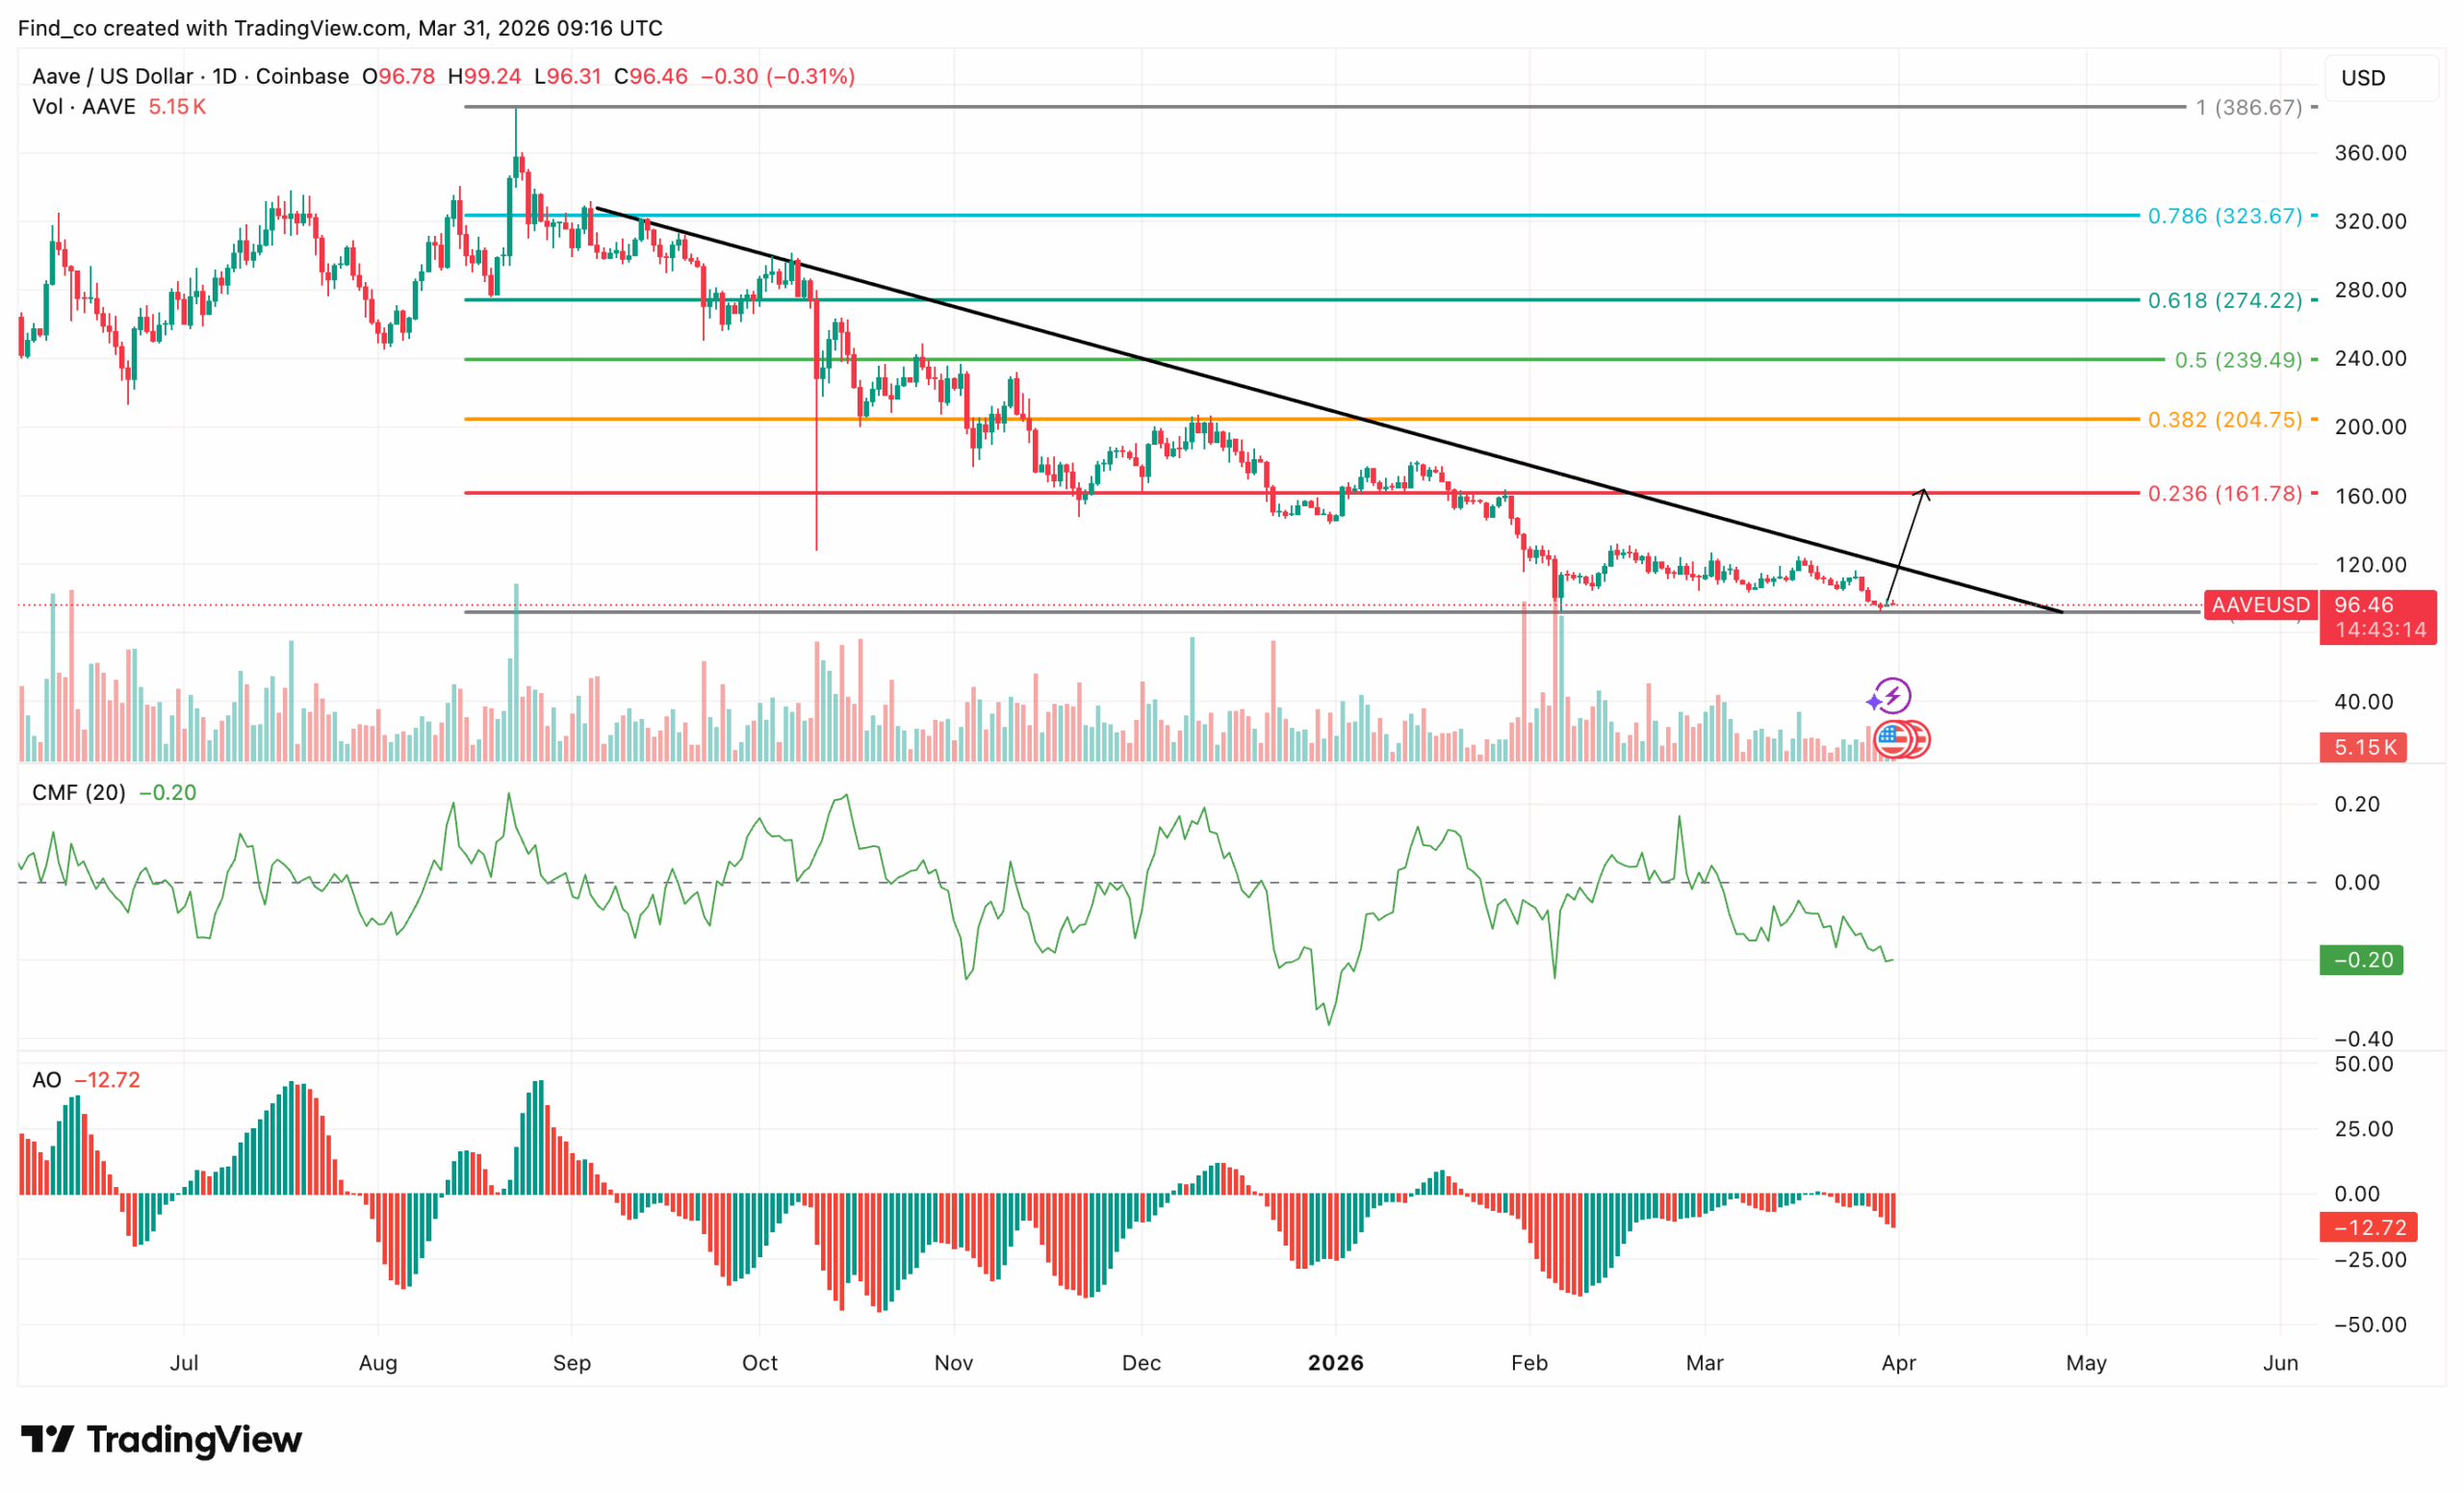
AAVE Price Prediction: Fragile Support
On the daily chart, AAVE’s price continues to respect a well-defined descending structure.
Recently, the asset retested the critical support zone near $92.21, where buyers showed a modest reaction.
However, momentum remains weak. The consistent formation of lower highs reinforces the dominant downtrend and signals limited bullish conviction.
Moreover, price trades below key Fibonacci levels, with the 0.382 and 0.5 zones acting as firm resistance. This suggests that any short-term recovery could face immediate selling pressure.
Meanwhile, the Chaikin Money Flow (CMF) stays negative, indicating persistent capital outflows. At the same time, the Awesome Oscillator (AO) prints deepening red bars, reflecting increasing bearish momentum.
Disclaimer:
The information provided in this article is for informational purposes only. It is not intended to be, nor should it be construed as, financial advice. We do not make any warranties regarding the completeness, reliability, or accuracy of this information. All investments involve risk, and past performance does not guarantee future results. We recommend consulting a financial advisor before making any investment decisions.
Victor Olanrewaju is a crypto analyst and reporter at CCN with deep roots in on-chain research and technical analysis. His crypto journey began in 2017, but it was the 2020 Uniswap airdrop that sparked a full-time pivot into the space.
With a foundation in copywriting, Victor honed his craft creating high-converting content for leading crypto brokers — most notably an XRP price prediction that ranked #1 on Google during the 2021 bull run.
He later joined AMBCrypto in 2022, where he combined storytelling with technical and on-chain analysis to cover key market narratives.
In 2024, he expanded his expertise at BeInCrypto, collaborating with analysts and using tools like Glassnode, Santiment, and IntoTheBlock to break down Bitcoin and altcoin trends.
At CCN, Victor covers the top cryptocurrencies, memecoins, macro shifts, blending real-time insights with deep-dive metrics.
He holds a Bachelor’s degree in Physics from the University of Ibadan, equipping him to simplify complex data for a wide audience. Follow his work or connect on LinkedIn or X.