Home / Analysis / Crypto / Technical Analysis / US Oil Reserve (USOR) Joins Gold With 295% Surge to ATH While Crypto Crashes Amid Trump–EU Tariff Tensions
Data analysis shows USOR does not track U.S. oil reserves or crude prices. Learn how it compares with regulated oil ETFs and discover major tracking failures. | Credit: CCN.com
Share
Key Takeaways
The crypto market dumped with $1 billion in liquidations, while USOR pumped alongside gold.
CCN reveals how the ongoing tension between the Trump-led US and the EU affected the token.
After the spike-and-reject, USOR is in a volatile post-pump zone that could drive it either way.
Markets are being torn apart by a rare geopolitical volatility cycle. Most risk assets are bleeding, especially in the crypto market.
Yet one token is doing the opposite. Solana-based U.S. Oil Reserve (USOR) has surged 295%, driven by a trade war reshaping Arctic politics.
At press time, the USOR price hovers around $0.026. But initially, the cryptocurrency rallied to a new high of $0.068, following gold’s surge above $4,850.
While it has pulled back a bit, this CCN analysis reveals what has caused the surge and what could be next for the token’s price.
Crypto Market Crashes
While the USOR token price surged, the broader crypto market experienced a notable sell-off. For instance, Bitcoin’s (BTC) price dropped below the $90,000 support.
Ethereum (ETH), on the other hand, declined below the $3,000 psychological mark. This development led to a cascade of liquidations totaling more than $1 billion in the last 24 hours.
Specifically, long positions accounted for roughly $928 million, while shorts made up only about $102 million. That imbalance clearly shows the market moved against bullish positioning, not against bears.
What this means for price is twofold. First, a large portion of leveraged long risk has already been flushed, which reduces immediate downside pressure from forced selling.
Second, after such a long, heavy liquidation event, the market often enters a stabilization or bounce phase, because sellers no longer have as much leverage to push prices lower quickly.
However, this does not automatically signal a trend reversal. It mainly tells us that the crowded long side has been cleared.
So, if spot demand steps in and price holds key supports, a relief bounce becomes more likely.
However, if prices continue to drift lower despite this flush, it would indicate genuine spot selling rather than liquidation-driven moves, which would be a more bearish signal.
Asset
Current Price (Jan 21)
24-Hour Change
Significance
USOR (Solana)
$0.026
+295%
Peaked at $0.068; trading as a political meme.
Bitcoin (BTC)
$90,522
-4.8%
$1 billion in liquidations; testing $90,000.
Ethereum (ETH)
$2,985
-5.2%
Slipped below psychological $3k support.
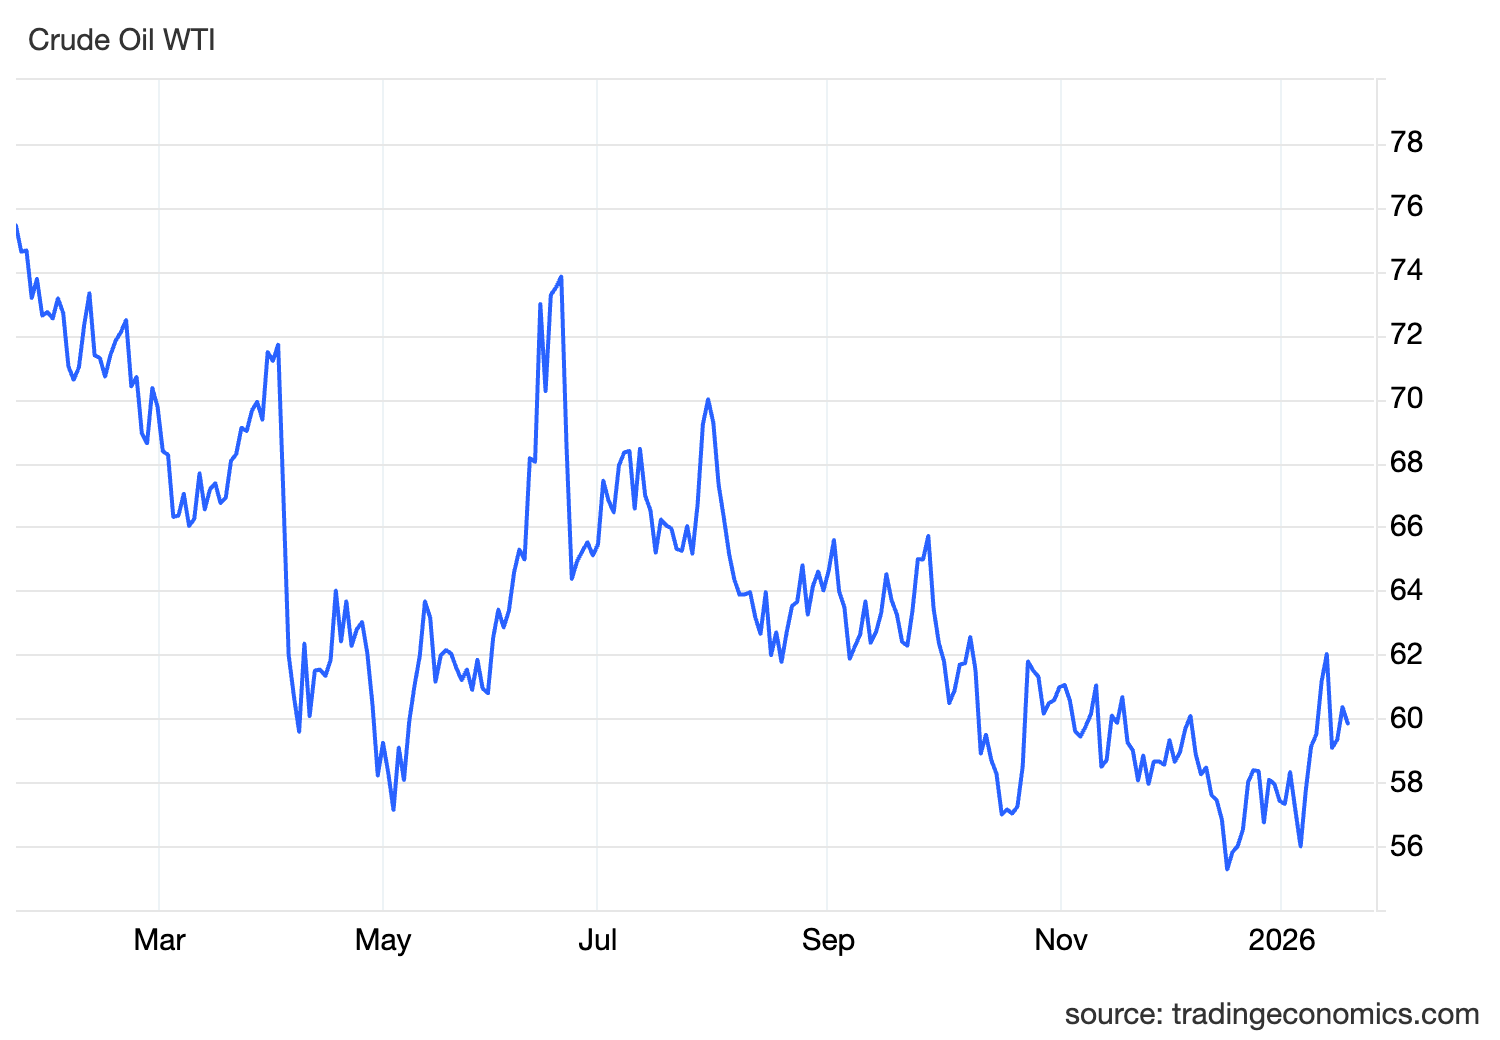
WTI Crude Oil
$59.40
-1.1%
20.6% decline over 12 months due to tariff fears.
What Else Caused the Wipe Out?
Apart from the technical setup, the rise in the USOR’s price could be linked to the events in global politics.
European leaders, meeting at the World Economic Forum in Davos, have shifted from quiet concern to open resistance.
Denmark has drawn a hard line. Prime Minister Mette Frederiksen called the situation an “existential crisis” and warned Parliament that “the worst may still be ahead.”
At the same time, she made Denmark’s stance clear. Sovereignty is not for sale. Copenhagen has already increased its military presence on Greenland to counter claims that the territory is undefended.
The European Union is escalating, too. Commission President Ursula von der Leyen labeled the proposed 10% tariff a mistake between allies.
Behind the scenes, Brussels is now weighing its most aggressive response yet.
The EU is considering activating its Anti-Coercion Instrument, a so-called “trade bazooka” that would allow retaliatory tariffs on roughly €93 billion ($101 billion) worth of U.S. goods.
Meanwhile, Greenland has joined the pushback. Prime Minister Jens-Frederik Nielsen said international law “is not a game” and stressed that Greenland’s territorial integrity is non-negotiable.
So, Why Is USOR Exploding While Physical Oil Barely Moved?
First, the USOR token is trading like a political meme, not a commodity. Traders are not pricing barrels.
They are pricing headlines. Second, liquidity matters. USOR trades on the Solana blockchain, where thin order books turn modest inflows into vertical moves.
Even small rotations out of Bitcoin can send the price flying.
Finally, timing is everything. USOR’s upcoming Feb. 1 rollout aligns perfectly with the proposed tariffs’ start date.
In early 2026, oil prices are responding to the Trump administration’s “tariff-heavy” trade strategy with notable volatility.
However, the net effect has largely been downward pressure on prices due to demand concerns and a supply-focused energy policy.
As of late January 2026, Brent Crude is trading around $64/bbl, down 18.62% since Trump’s inauguration.WTI, on the other hand, is near $59-$60/bbl, representing a 20.67% decline over the past year.
This is significantly lower than the $70+ averages seen in 2024.
USOR Price Prediction: Not Here or There
From a technical perspective, the 1-hour chart shows USOR/SOL is trading around $0.026. This happened after a notable rally and an equally sharp pullback.
As seen below, the USOR price previously broke above a long descending trendline and accelerated into the Fibonacci resistance cluster, but that breakout failed quickly.
The long upper wick and the heavy red candle show aggressive profit-taking and a fast rejection of higher prices.
The Fibonacci structure explains the reaction well. Price pushed into the 0.236 to 0.382 Fib level and briefly spiked higher, but it could not hold above that area.
Since then, it has slipped back toward the base of the move, hovering just above the breakout point/
Momentum indicators show cooling conditions. Notably, the Money Flow Index (MFI) remains elevated near the mid-60s, indicating that buying pressure is still present but has rolled over from recent highs.
At the same time, the Awesome Oscillator surged strongly during the pump and has now started to contract, which confirms that upside momentum is fading fast.
Overall, this looks like a classic post-breakout test. If USOR’s price can hold above the breakout base and stabilize, the structure can still resolve into consolidation before another attempt higher.
Should that be the case, the token’s market value could rise to $0.050. In a highly bullish market, it could reach $0.01, a new record high.
However, if the price loses this level with volume, the failed breakout increases the risk of a deeper retracement back into the prior range. If that were to happen, the US Oil Reserve token might break down to $0.0042.
Disclaimer:
The information provided in this article is for informational purposes only. It is not intended to be, nor should it be construed as, financial advice. We do not make any warranties regarding the completeness, reliability, or accuracy of this information. All investments involve risk, and past performance does not guarantee future results. We recommend consulting a financial advisor before making any investment decisions.
Victor Olanrewaju is a crypto analyst and reporter at CCN with deep roots in on-chain research and technical analysis. His crypto journey began in 2017, but it was the 2020 Uniswap airdrop that sparked a full-time pivot into the space.
With a foundation in copywriting, Victor honed his craft creating high-converting content for leading crypto brokers — most notably an XRP price prediction that ranked #1 on Google during the 2021 bull run.
He later joined AMBCrypto in 2022, where he combined storytelling with technical and on-chain analysis to cover key market narratives.
In 2024, he expanded his expertise at BeInCrypto, collaborating with analysts and using tools like Glassnode, Santiment, and IntoTheBlock to break down Bitcoin and altcoin trends.
At CCN, Victor covers the top cryptocurrencies, memecoins, macro shifts, blending real-time insights with deep-dive metrics.
He holds a Bachelor’s degree in Physics from the University of Ibadan, equipping him to simplify complex data for a wide audience. Follow his work or connect on LinkedIn or X.