Home / Analysis / Crypto / Technical Analysis / Bitcoin’s (BTC) Brutal Weekend Rollercoaster Wipes $185M in Long Positions, but Bears Need to Watch Out
Bitcoin price continues to consolidate | Credit: Hameem Sarwar
Share
Key Takeaways
Bitcoin experienced a “weekend wash,” shedding $1,700 to hit $65,000 before snapping back to $66,400.
On-chain data reveals a significant shift in Bitcoin buyer composition amid the absence of retail investors.
Analysis shows that a break above the 0.236 Fibonacci level and the 9-day EMA would signal a breakout
Bitcoin’s (BTC) price experienced high volatility over the weekend.
At some point, the flagship cryptocurrency showed readiness to retest $70,000. Later on, it wiped out the gains.
In this analysis, CCN reveals how it all went down and what could be next for BTC.
BTC Dumps, Pumps: What Happened in 60 Minutes
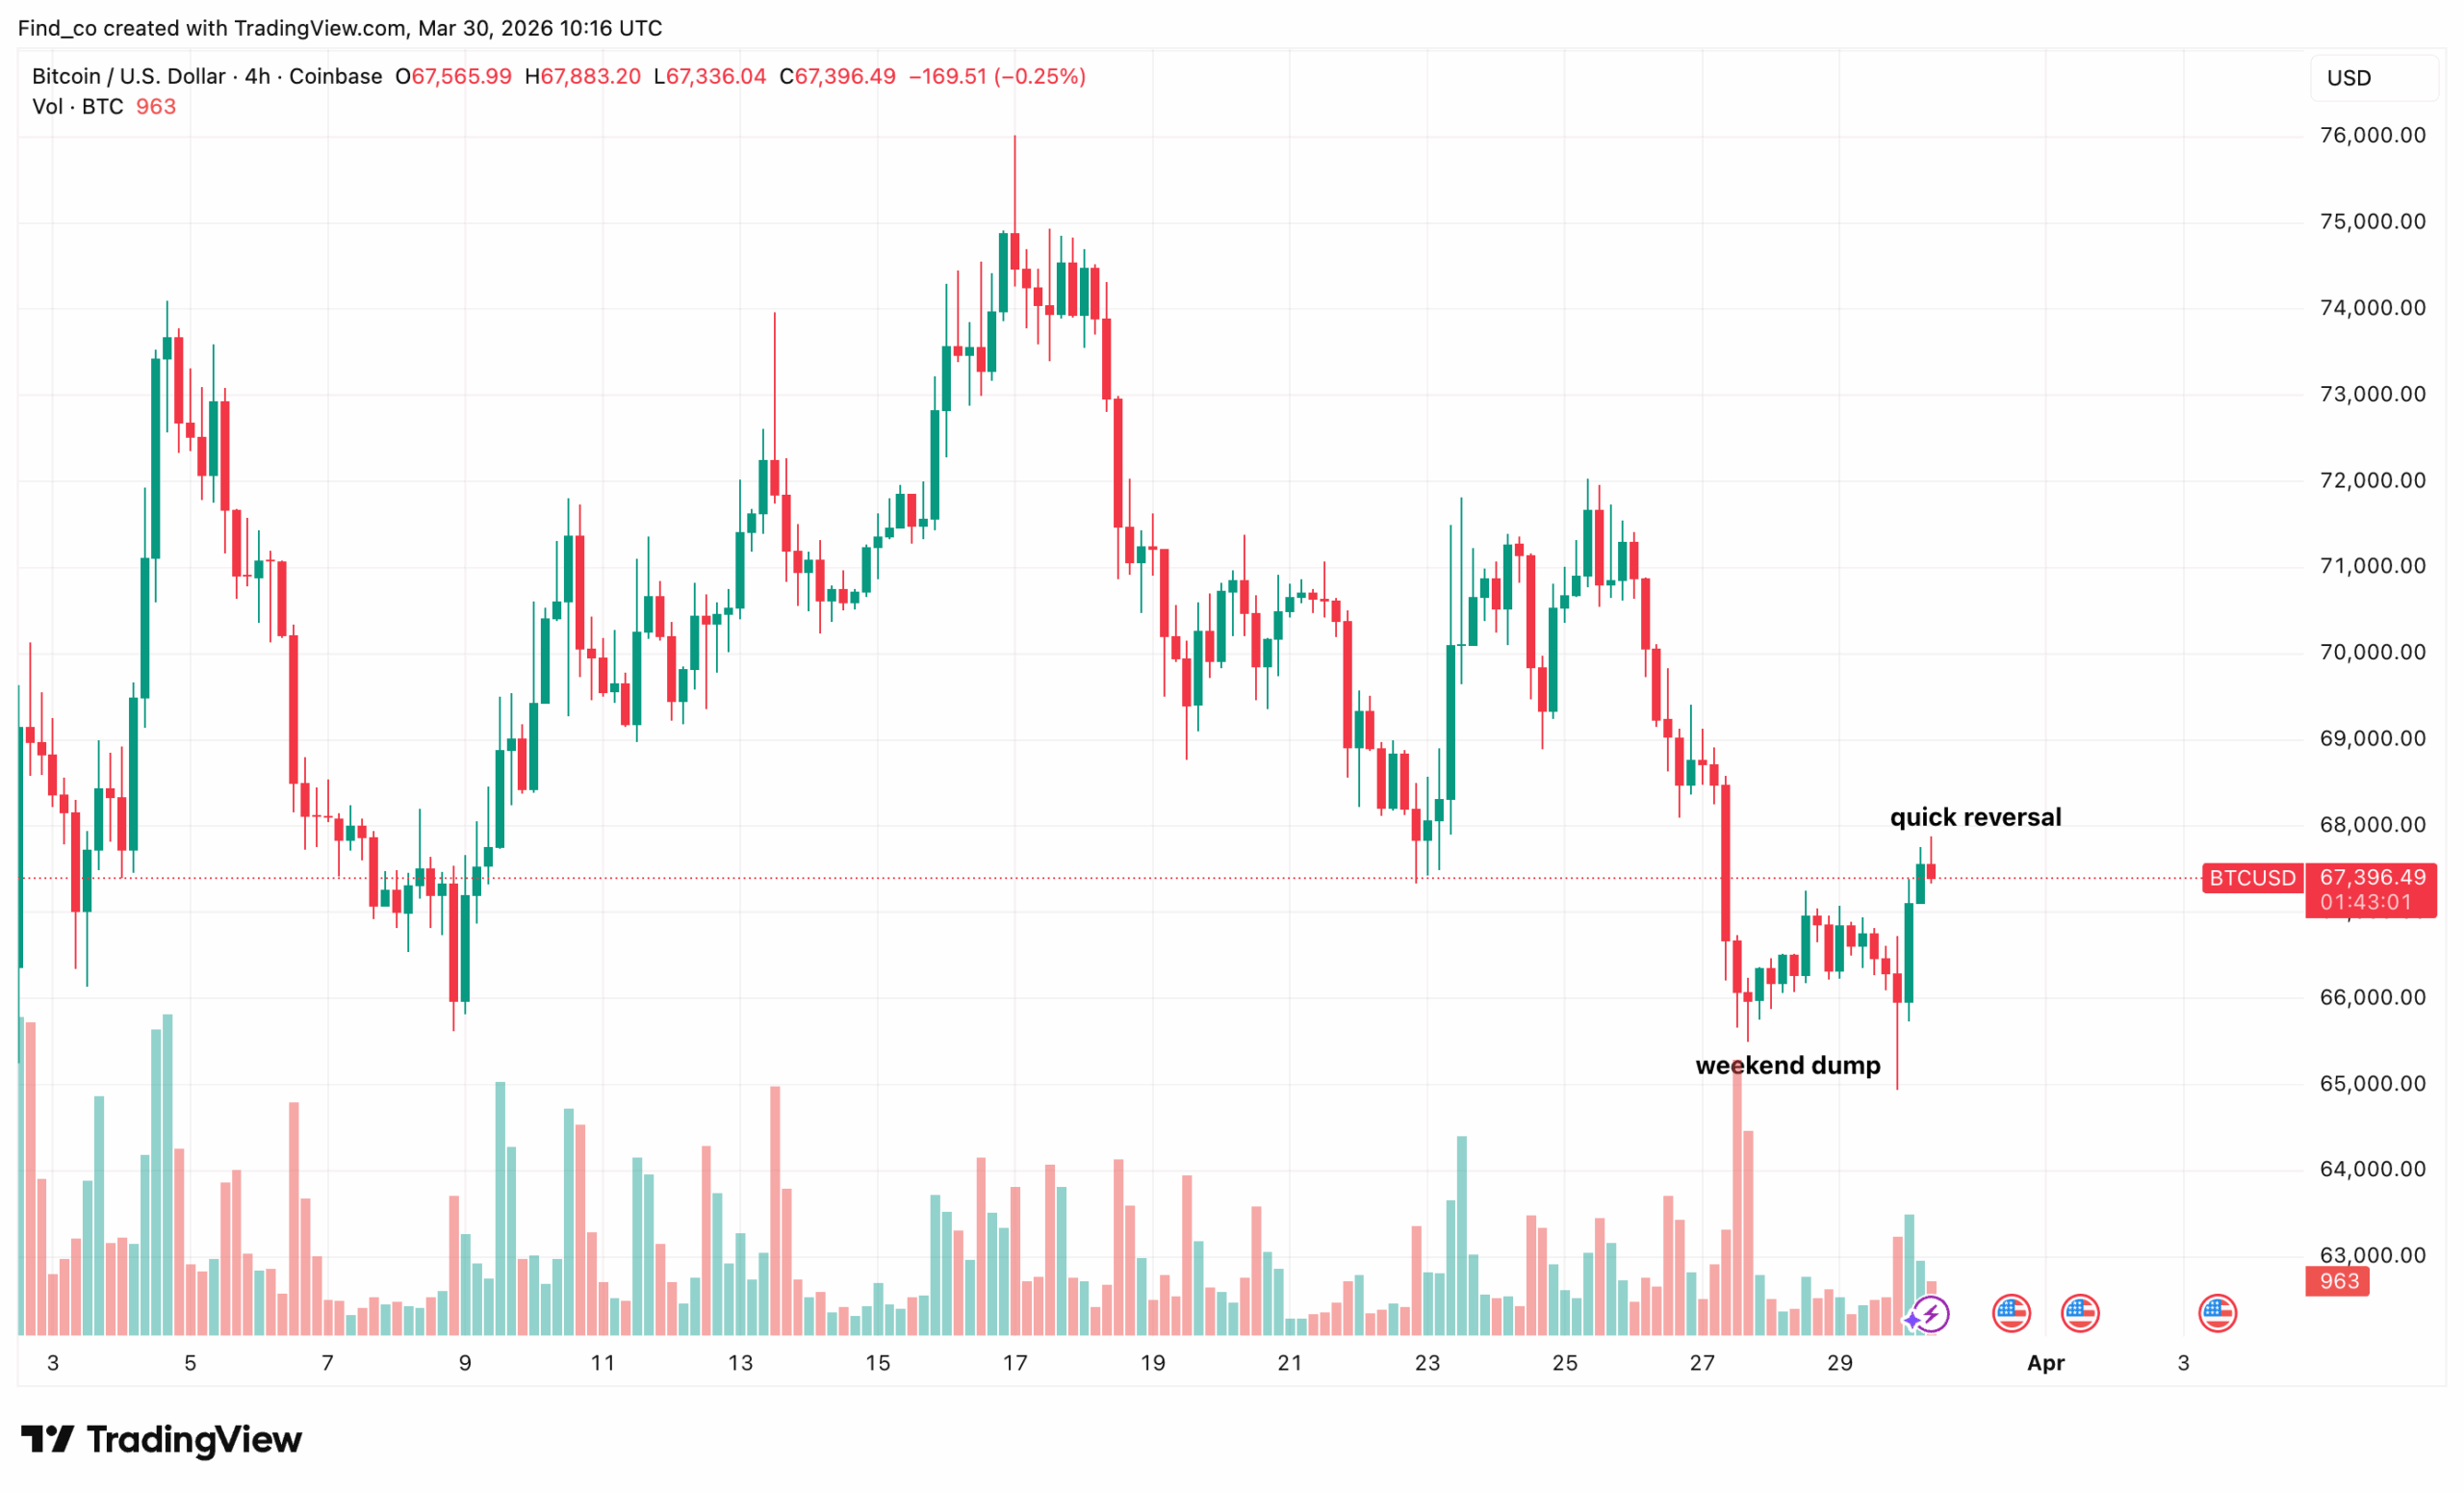
In just 75 minutes on a low-liquidity weekend, Bitcoin’s price shed $1,700, then bounced $1,400, and liquidated nearly $190 million in leveraged positions on both sides of the trade.
It started fast. Bitcoin dropped from $66,710 to $65,000 in just 60 minutes. That single move was enough to trigger over $185 million in long liquidations.
Traders who had bet on Bitcoin continuing upward were instantly wiped out. Then, almost immediately, the opposite happened. Bitcoin’s price reversed course. It surged $1,400 from $65,000 back to $66,400 in just 15 minutes.
This time, nearly $14 million in short positions were liquidated. So, within 75 minutes, Bitcoin had punished longs on the way down and punished shorts on the way back up.
Both sides of the market lost. Only those with no leveraged exposure, or those executing the moves, came out ahead.
This pattern is not new. It is well-documented that crypto markets exhibit a weekend effect. The reason is simple: liquidity drops significantly on Saturdays and Sundays.
However, when the new week begins, Bitcoin’s price tends to stabilize, as it has today.
Buyer Profile Shifts
From an on-chain perspective, the composition of Bitcoin buyers has transformed dramatically since late 2025 — and that shift explains everything about the current price action.
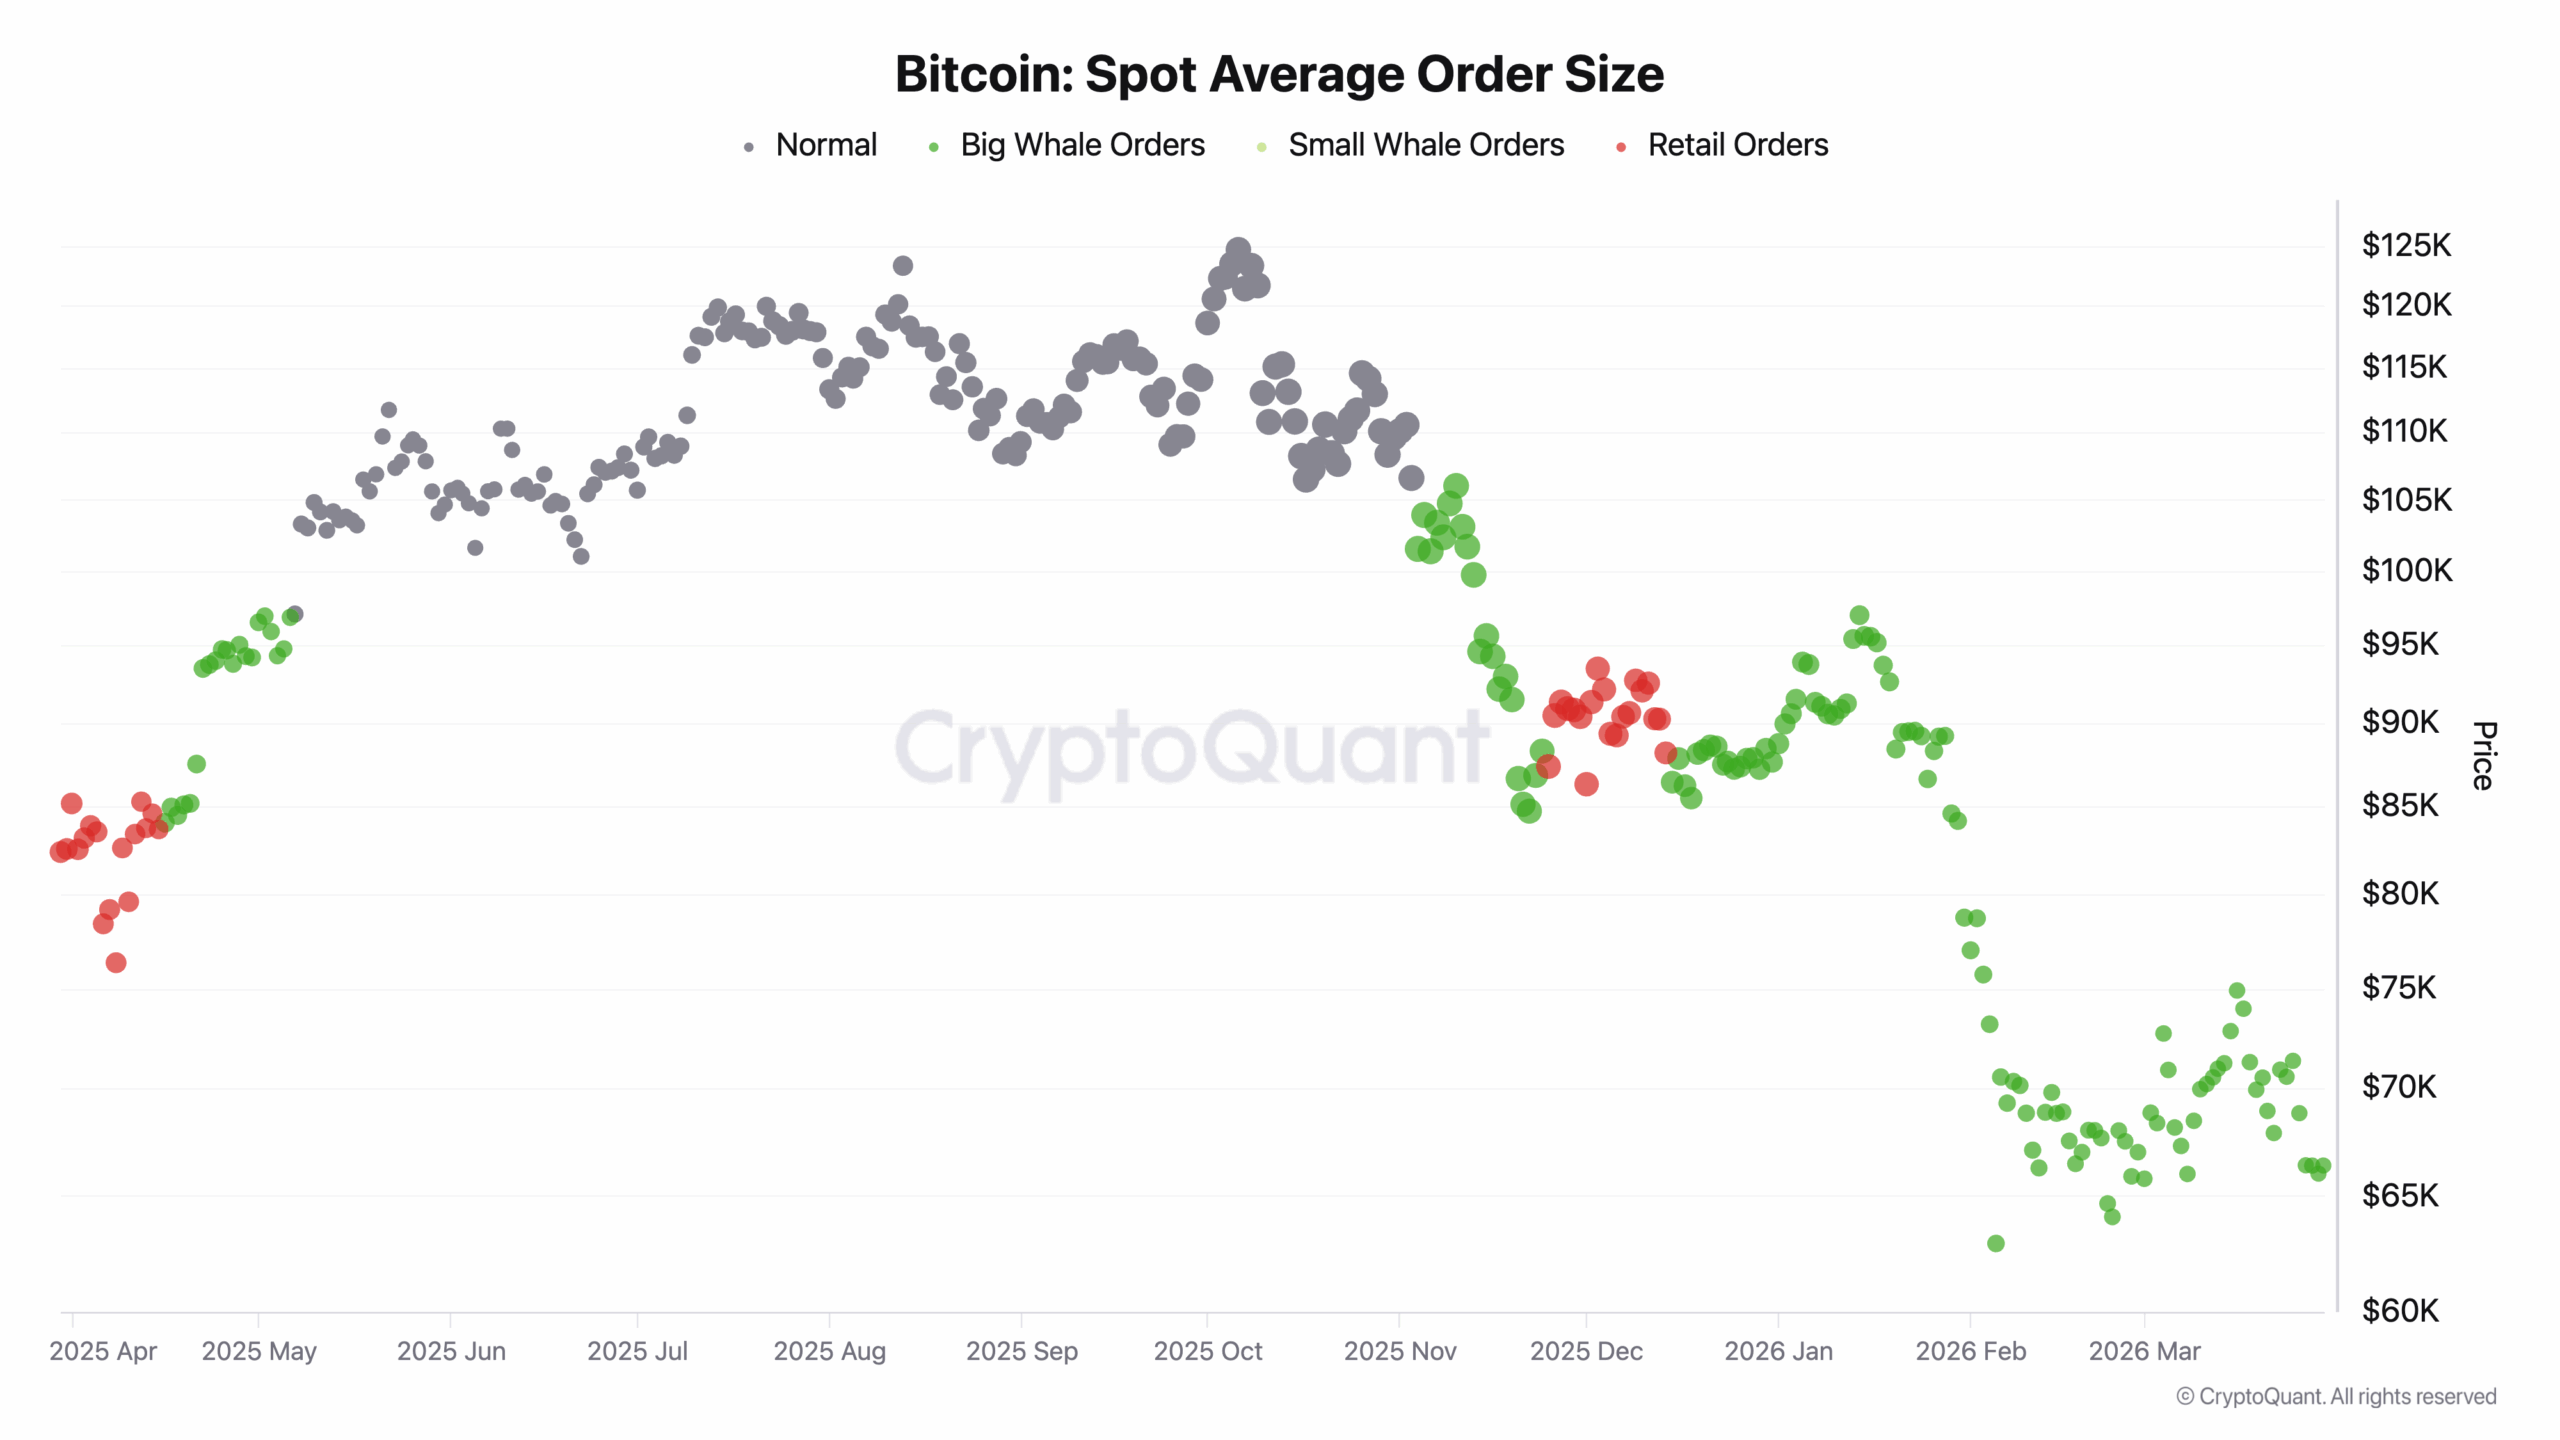
CryptoQuant’s Spot Average Order Size chart, spanning April 2025 through March 2026, reveals a market that has moved through three distinct buyer regimes.
From April through November 2025, normal-sized orders dominated the scatter plot entirely, clustering tightly as Bitcoin’s price climbed steadily from $85,000 to a peak near $125,000.
This represented broad, distributed buying institutions, funds, and sophisticated traders all participating in an orderly bull market. The grey dots tell a story of confident, sustained accumulation.
Then December marked a turning point. Normal orders disappeared almost entirely. In their place, big whale orders emerged in the $100,000 range, followed quickly by a cluster of retail orders appearing between $88,000 and $95,000.
Since February 2026, the picture has changed again, and this is the most important development.
Only small whale orders are visible, scattered between $63,000 and $93,000, with no retail participation and no normal institutional flow.
Bitcoin Spot Average Order Size | Credit: CryptoQuant
Therefore, the absence of retail and the presence of only small whales suggest the market is in a quiet accumulation phase.
Notably, this was not a panicked selloff. Big institutions haven’t returned yet. Retail hasn’t noticed yet. That combination historically precedes the next leg higher.
When normal orders reappear on this chart, the signal will be impossible to ignore.
What Comes Next for Bitcoin Price?
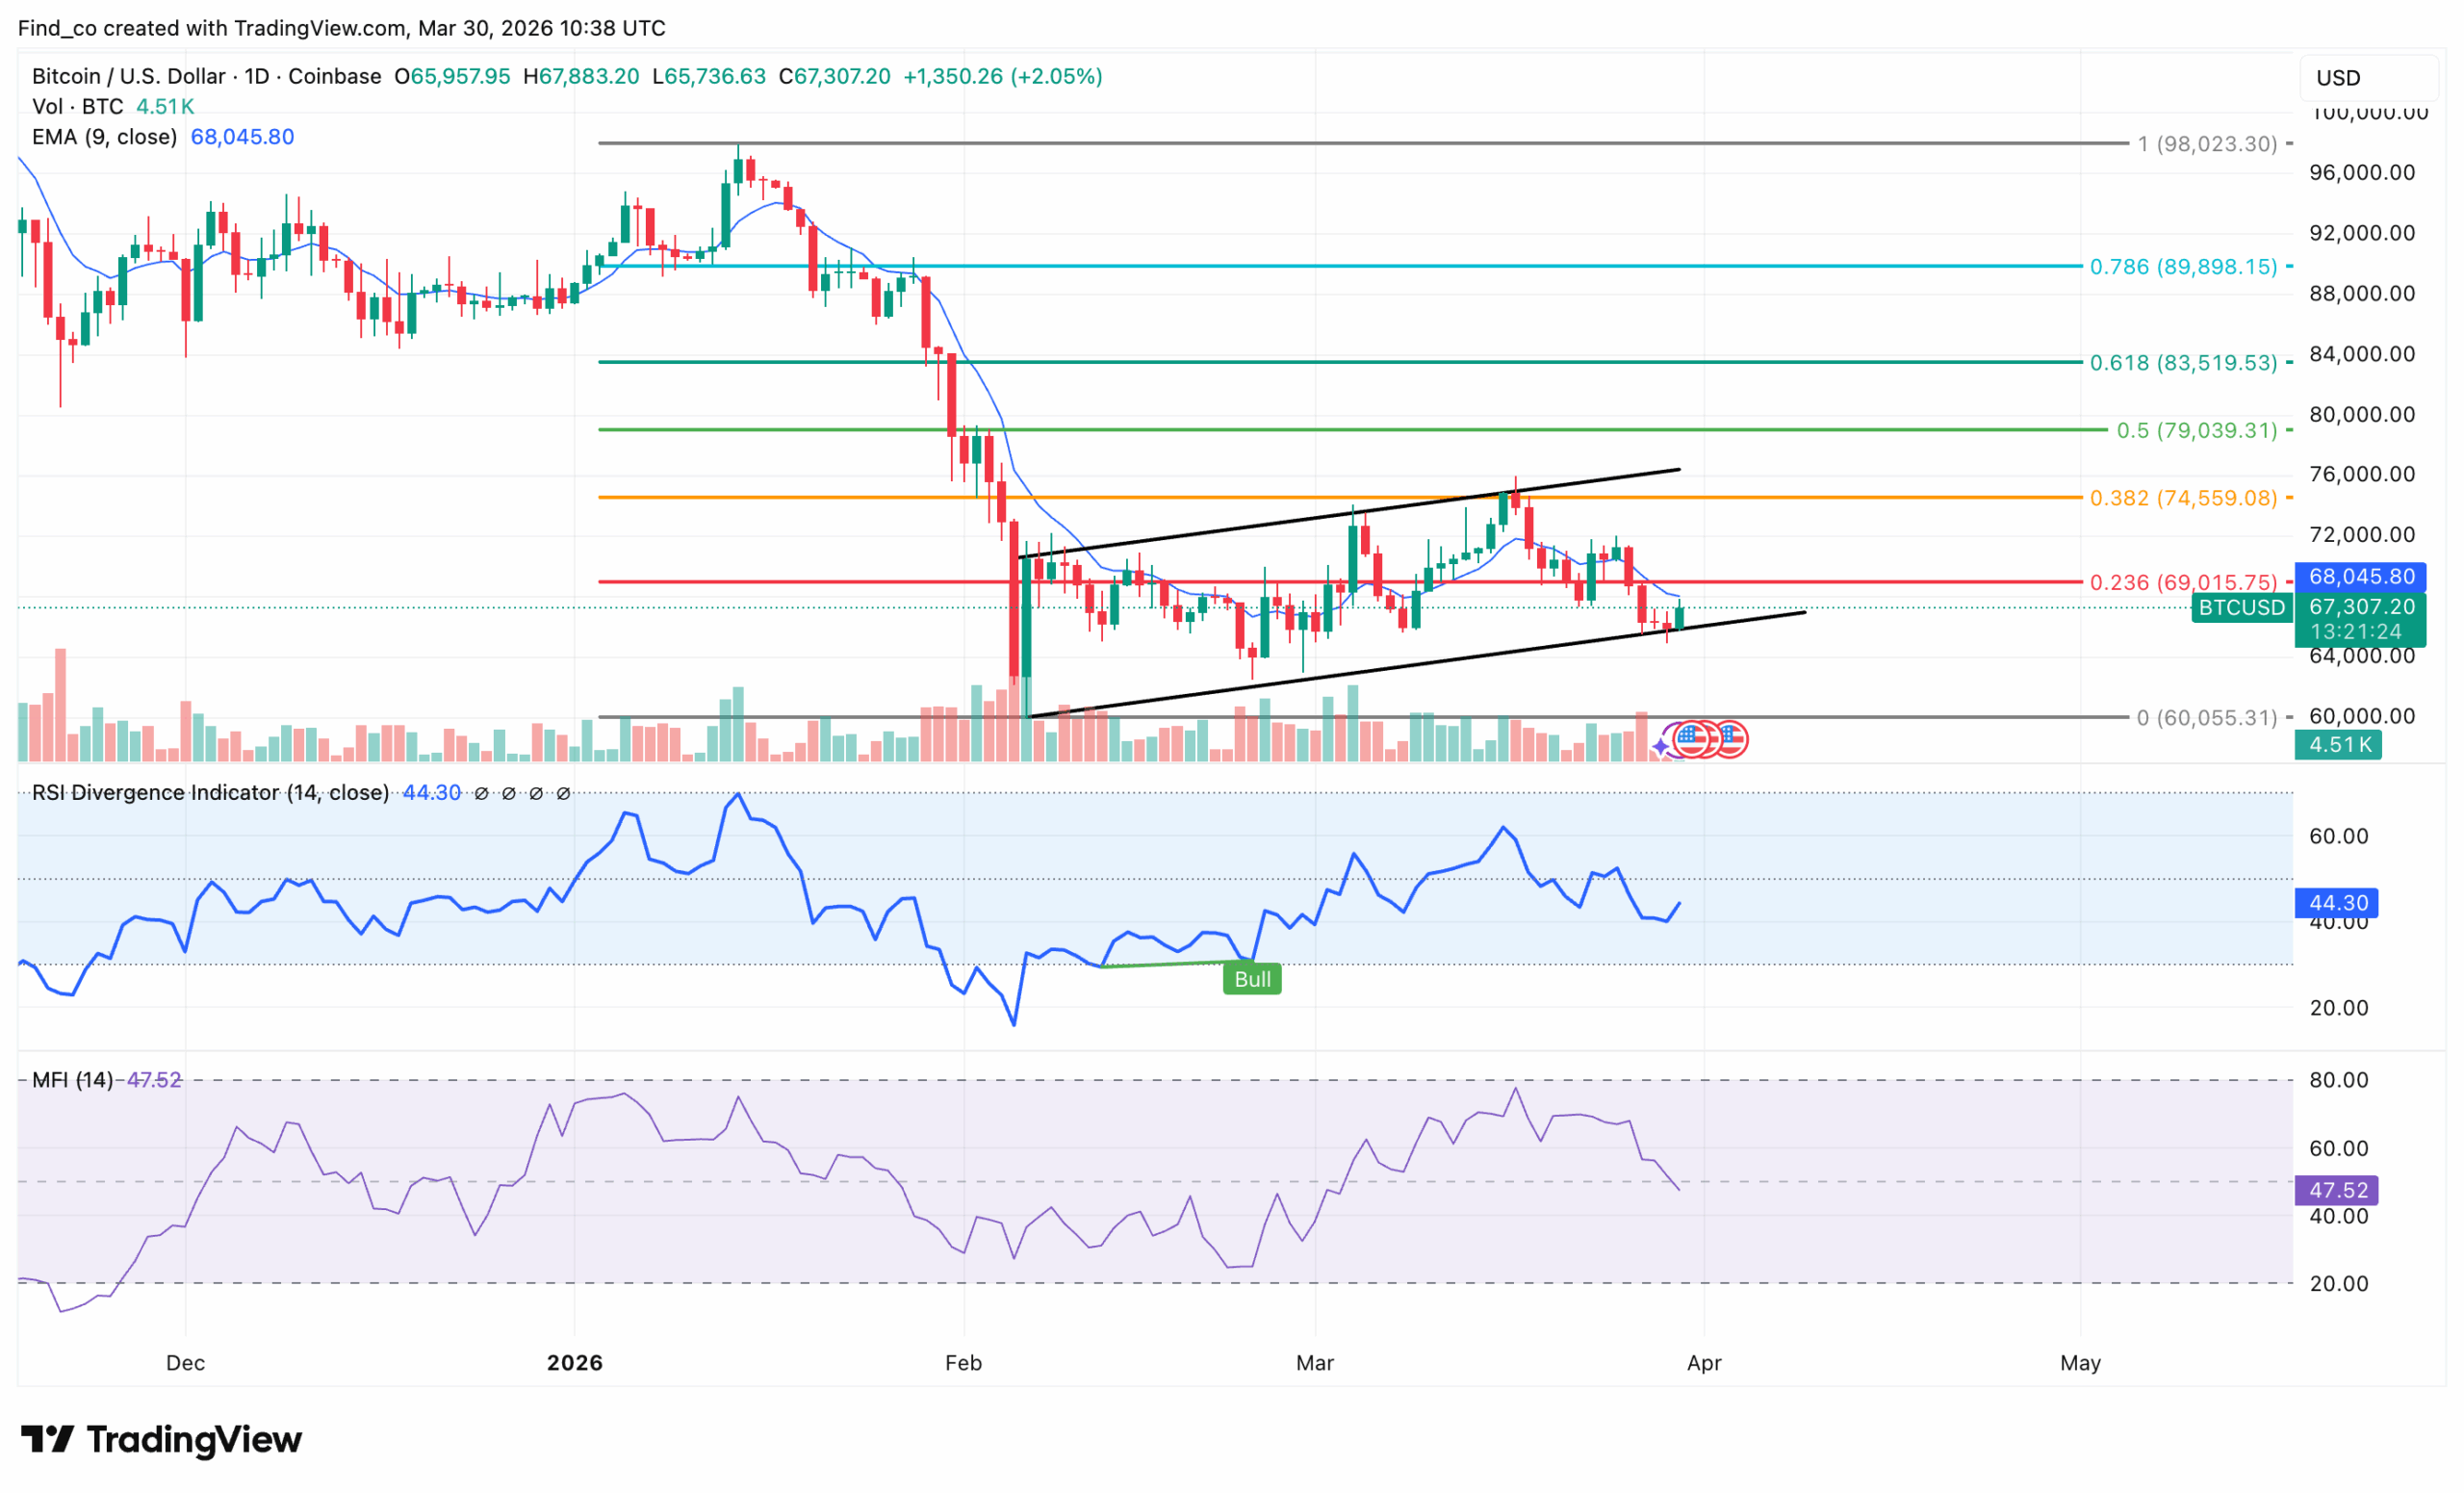
On the daily chart, BTC trades at $67,307. But the broader structure demands close attention as a symmetrical triangle reaches its apex.
The pattern has been forming since the February low near $60,055. A rising lower trendline has consistently absorbed dips, while a falling upper trendline has capped every recovery attempt.
Both lines are now converging, and Bitcoin’s price sits directly at the 0.236 Fibonacci level at $69,015, which aligns with the upper trendline. That confluence makes this zone the most important level on the chart.
The 9 EMA at $68,045 sits just above the current price as immediate overhead resistance.
Clearing both the EMA and the $69,015 Fibonacci level in a single daily close would represent a significant technical development, opening the path toward the 0.382 level at $74,559 and ultimately $79,039.
However, the indicators urge patience. The RSI reads 44.30 (neutral) and is not yet showing the momentum acceleration needed to sustain a breakout.
Disclaimer:
The information provided in this article is for informational purposes only. It is not intended to be, nor should it be construed as, financial advice. We do not make any warranties regarding the completeness, reliability, or accuracy of this information. All investments involve risk, and past performance does not guarantee future results. We recommend consulting a financial advisor before making any investment decisions.
Victor Olanrewaju is a crypto analyst and reporter at CCN with deep roots in on-chain research and technical analysis. His crypto journey began in 2017, but it was the 2020 Uniswap airdrop that sparked a full-time pivot into the space.
With a foundation in copywriting, Victor honed his craft creating high-converting content for leading crypto brokers — most notably an XRP price prediction that ranked #1 on Google during the 2021 bull run.
He later joined AMBCrypto in 2022, where he combined storytelling with technical and on-chain analysis to cover key market narratives.
In 2024, he expanded his expertise at BeInCrypto, collaborating with analysts and using tools like Glassnode, Santiment, and IntoTheBlock to break down Bitcoin and altcoin trends.
At CCN, Victor covers the top cryptocurrencies, memecoins, macro shifts, blending real-time insights with deep-dive metrics.
He holds a Bachelor’s degree in Physics from the University of Ibadan, equipping him to simplify complex data for a wide audience. Follow his work or connect on LinkedIn or X.