KAS price jumped 30%, supported by rising volume and a clear bullish structure.
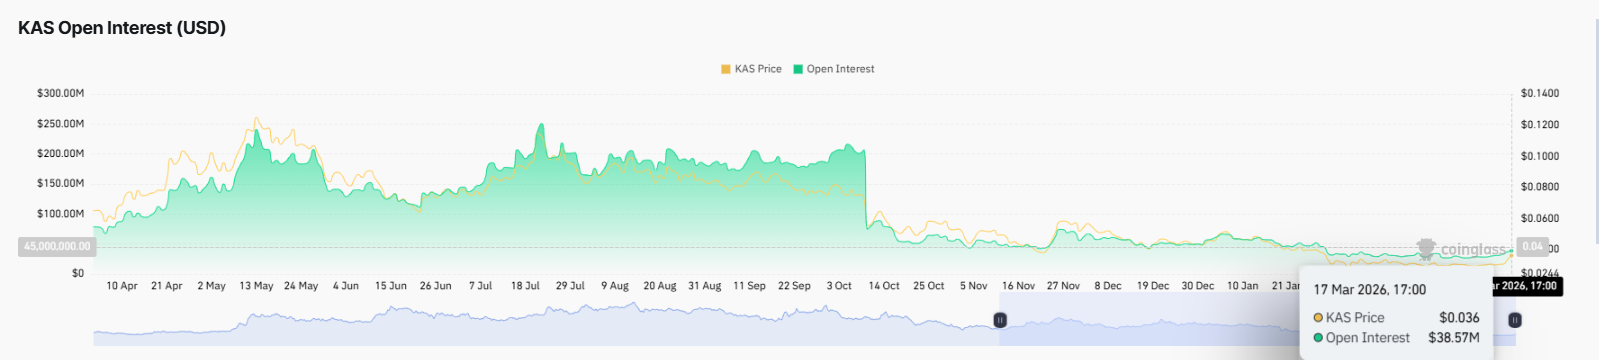
A 21% increase in open interest suggests fresh positions are entering the market.
If KAS breaks above $0.045, it could trigger further upside toward $0.068.
While the market’s attention has been fixed on Bitcoin’s (BTC) $74,000 reclaim and Ethereum’s (ETH) $2,000 recovery, Kaspa (KAS) has been quietly doing something remarkable.
Over the last seven days, the Kaspa coin has surged 30%. As a result, it has the highest level in 51 days.
While some might expect KAS to erase the gains, several indicators show otherwise.
Bullish Structure Expands Slowly
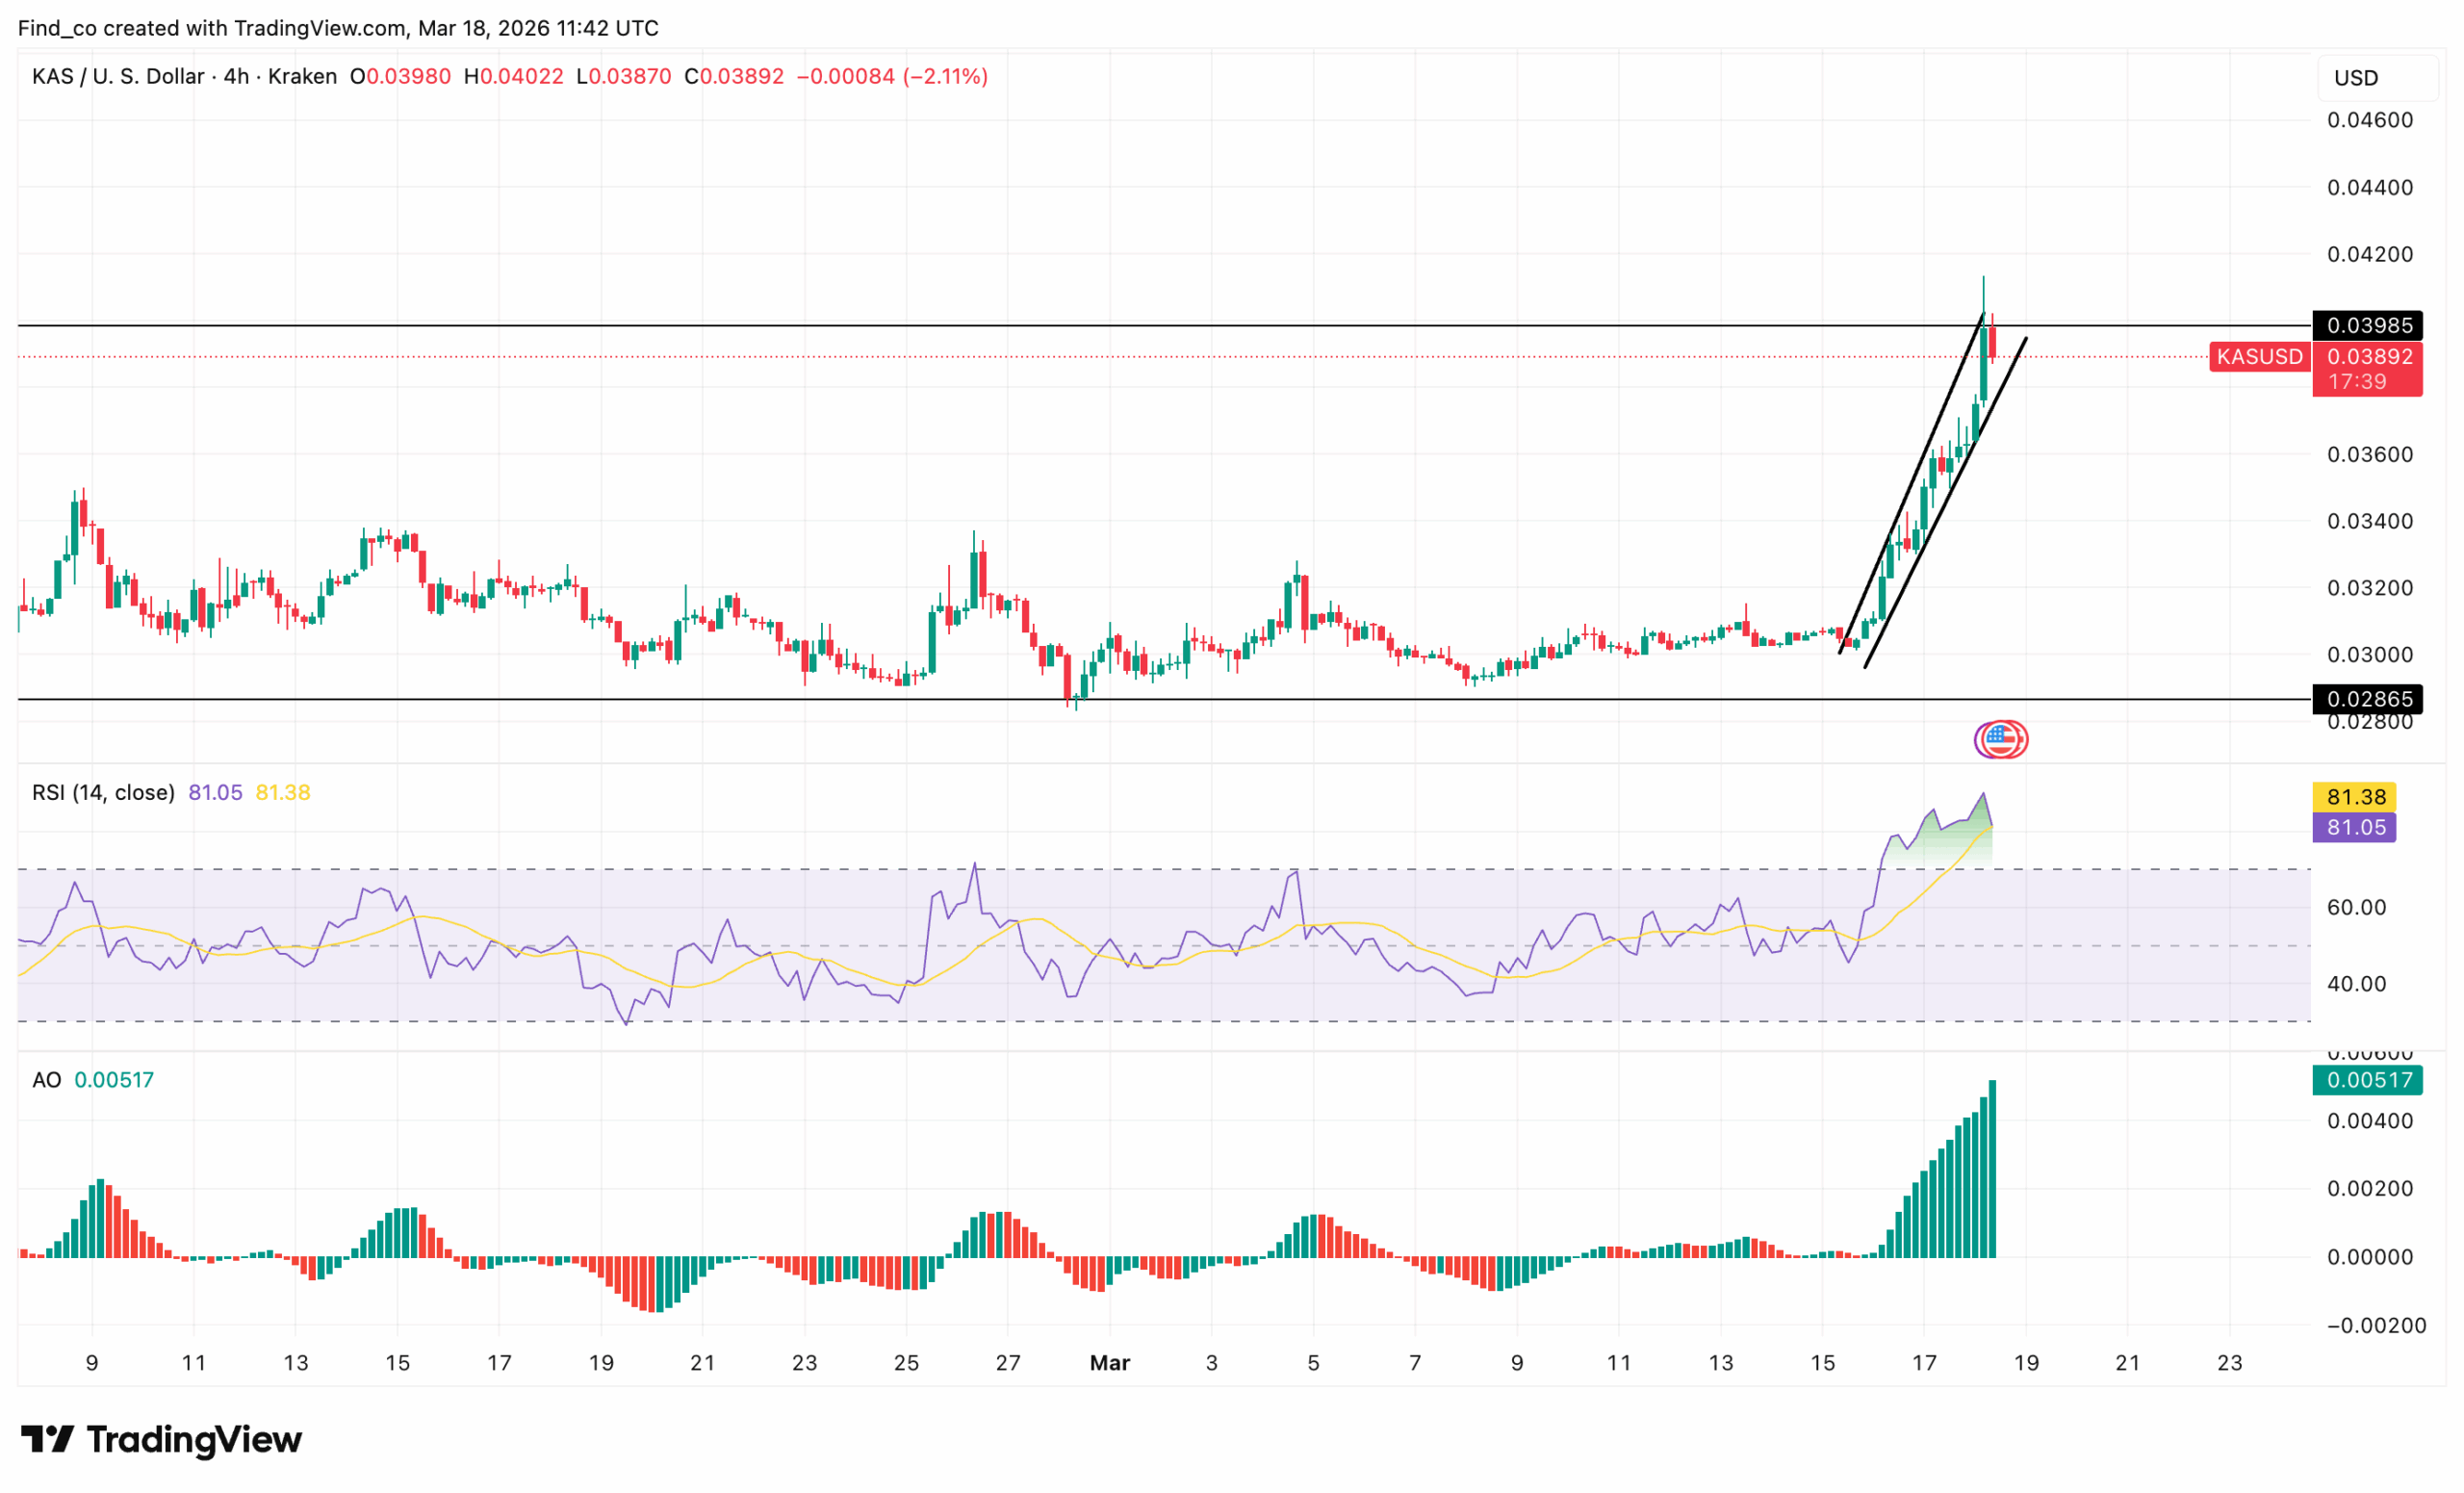
On the 4-hour chart, KAS price has surged by rising from the $0.030 region to nearly $0.040.
This move follows a prolonged consolidation phase, suggesting a shift in market structure.
However, while momentum is strong, signs of exhaustion are beginning to emerge. KAS is currently trading inside a steep ascending channel.
Price action shows consistently higher highs and higher lows. This confirms bullish control in the short term.
Meanwhile, the Awesome Oscillator (AO) is printing strong green histogram bars. Bullish structure is expanding, not weakening. This supports the ongoing rally.
However, the Relative Strength Index (RSI) tells a different story. It has pushed above 85, deep into overbought territory. Historically, this level often precedes short-term corrections or consolidation phases.
Therefore, while buyers remain in control, the rally may be overstretched.
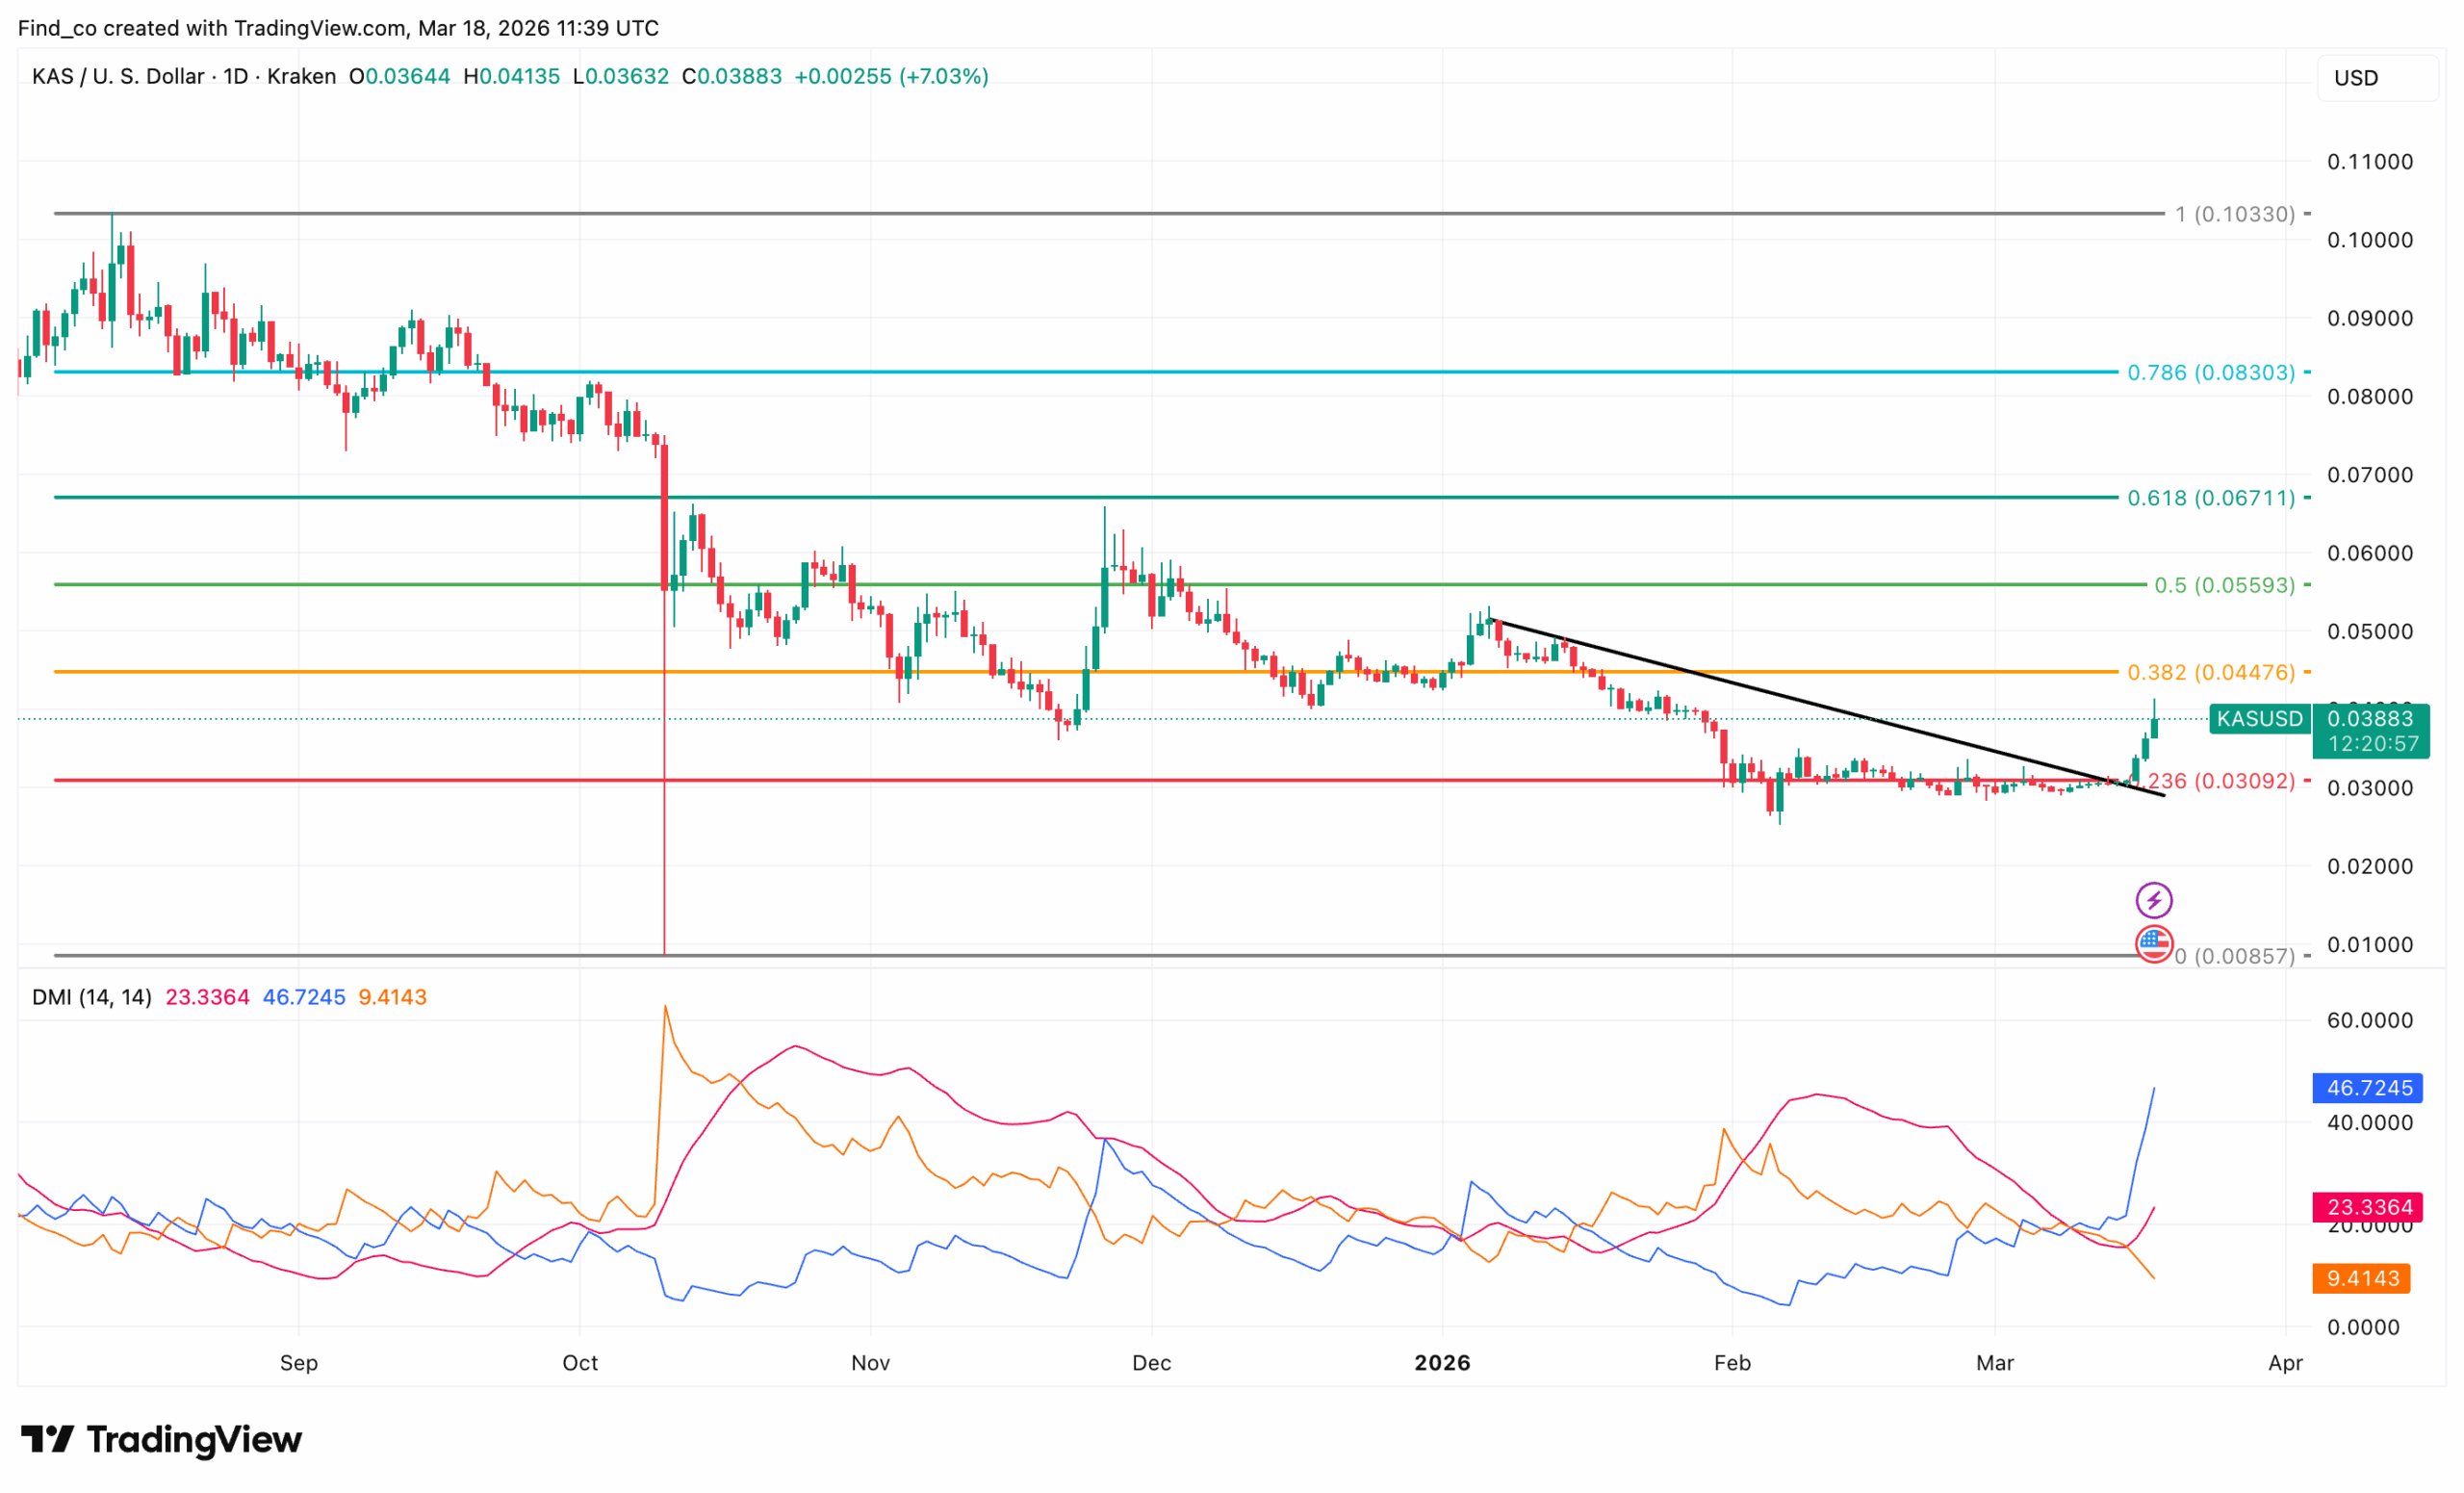
Kaspa (KAS) is showing strong upward movement, gaining over 8% as buyers step in after recent lows. The price now trades near $0.039, signaling a potential short-term recovery.
After reclaiming the $0.032 support, KAS is approaching the $0.045 resistance (0.382 Fibonacci). This level is key.
A break above it could open the path toward $0.057, while failure may trigger a pullback.
The 20-day Exponential Moving Average (EMA) sits below the current price, indicating early bullish control. Meanwhile, the Directional Movement Index (DMI) shows strengthening momentum.
The positive +DMI (blue) has surged to 46, while the negative -DMI remains near 23, highlighting buyer dominance.
However, the Average Directional Index (ADX) remains at 9, suggesting the trend is still forming, and conviction is not fully established.
If buyers maintain pressure, the KAS price could test the next resistance around $0.068.
Otherwise, rejection may push the price back toward $0.032, keeping the broader downtrend intact. Overall, momentum is improving, but caution is warranted.
Disclaimer:
The information provided in this article is for informational purposes only. It is not intended to be, nor should it be construed as, financial advice. We do not make any warranties regarding the completeness, reliability, or accuracy of this information. All investments involve risk, and past performance does not guarantee future results. We recommend consulting a financial advisor before making any investment decisions.
Victor Olanrewaju is a crypto analyst and reporter at CCN with deep roots in on-chain research and technical analysis. His crypto journey began in 2017, but it was the 2020 Uniswap airdrop that sparked a full-time pivot into the space.
With a foundation in copywriting, Victor honed his craft creating high-converting content for leading crypto brokers — most notably an XRP price prediction that ranked #1 on Google during the 2021 bull run.
He later joined AMBCrypto in 2022, where he combined storytelling with technical and on-chain analysis to cover key market narratives.
In 2024, he expanded his expertise at BeInCrypto, collaborating with analysts and using tools like Glassnode, Santiment, and IntoTheBlock to break down Bitcoin and altcoin trends.
At CCN, Victor covers the top cryptocurrencies, memecoins, macro shifts, blending real-time insights with deep-dive metrics.
He holds a Bachelor’s degree in Physics from the University of Ibadan, equipping him to simplify complex data for a wide audience. Follow his work or connect on LinkedIn or X.