Gold plunged from $5,100 and silver collapsed, then snapped back | Credit: Hameem Sarwar
Share
Key Takeaways
Gold volatility hit a 16-year high, signaling price discovery rather than a top.
Silver surged past $120 as scarcity and industrial demand reinforced the rally.
High volatility suggests sharp swings, but trends favor further upside if support holds.
After the Fed’s decision to pause rather than continue cutting interest rates, precious metals didn’t just rally.
They started behaving like instruments in active price discovery, with volatility. Gold is up hard into late January after breaking through $5,550, and silver’s price has hit $120 for the first time ever.
However, there’s a quieter signal most people aren’t watching. Historically, it’s the one that tends to matter most in moves like this.
In this analysis, CCN reveals what it is, why it’s showing up now, and how it could shape gold and silver’s next leg from here.
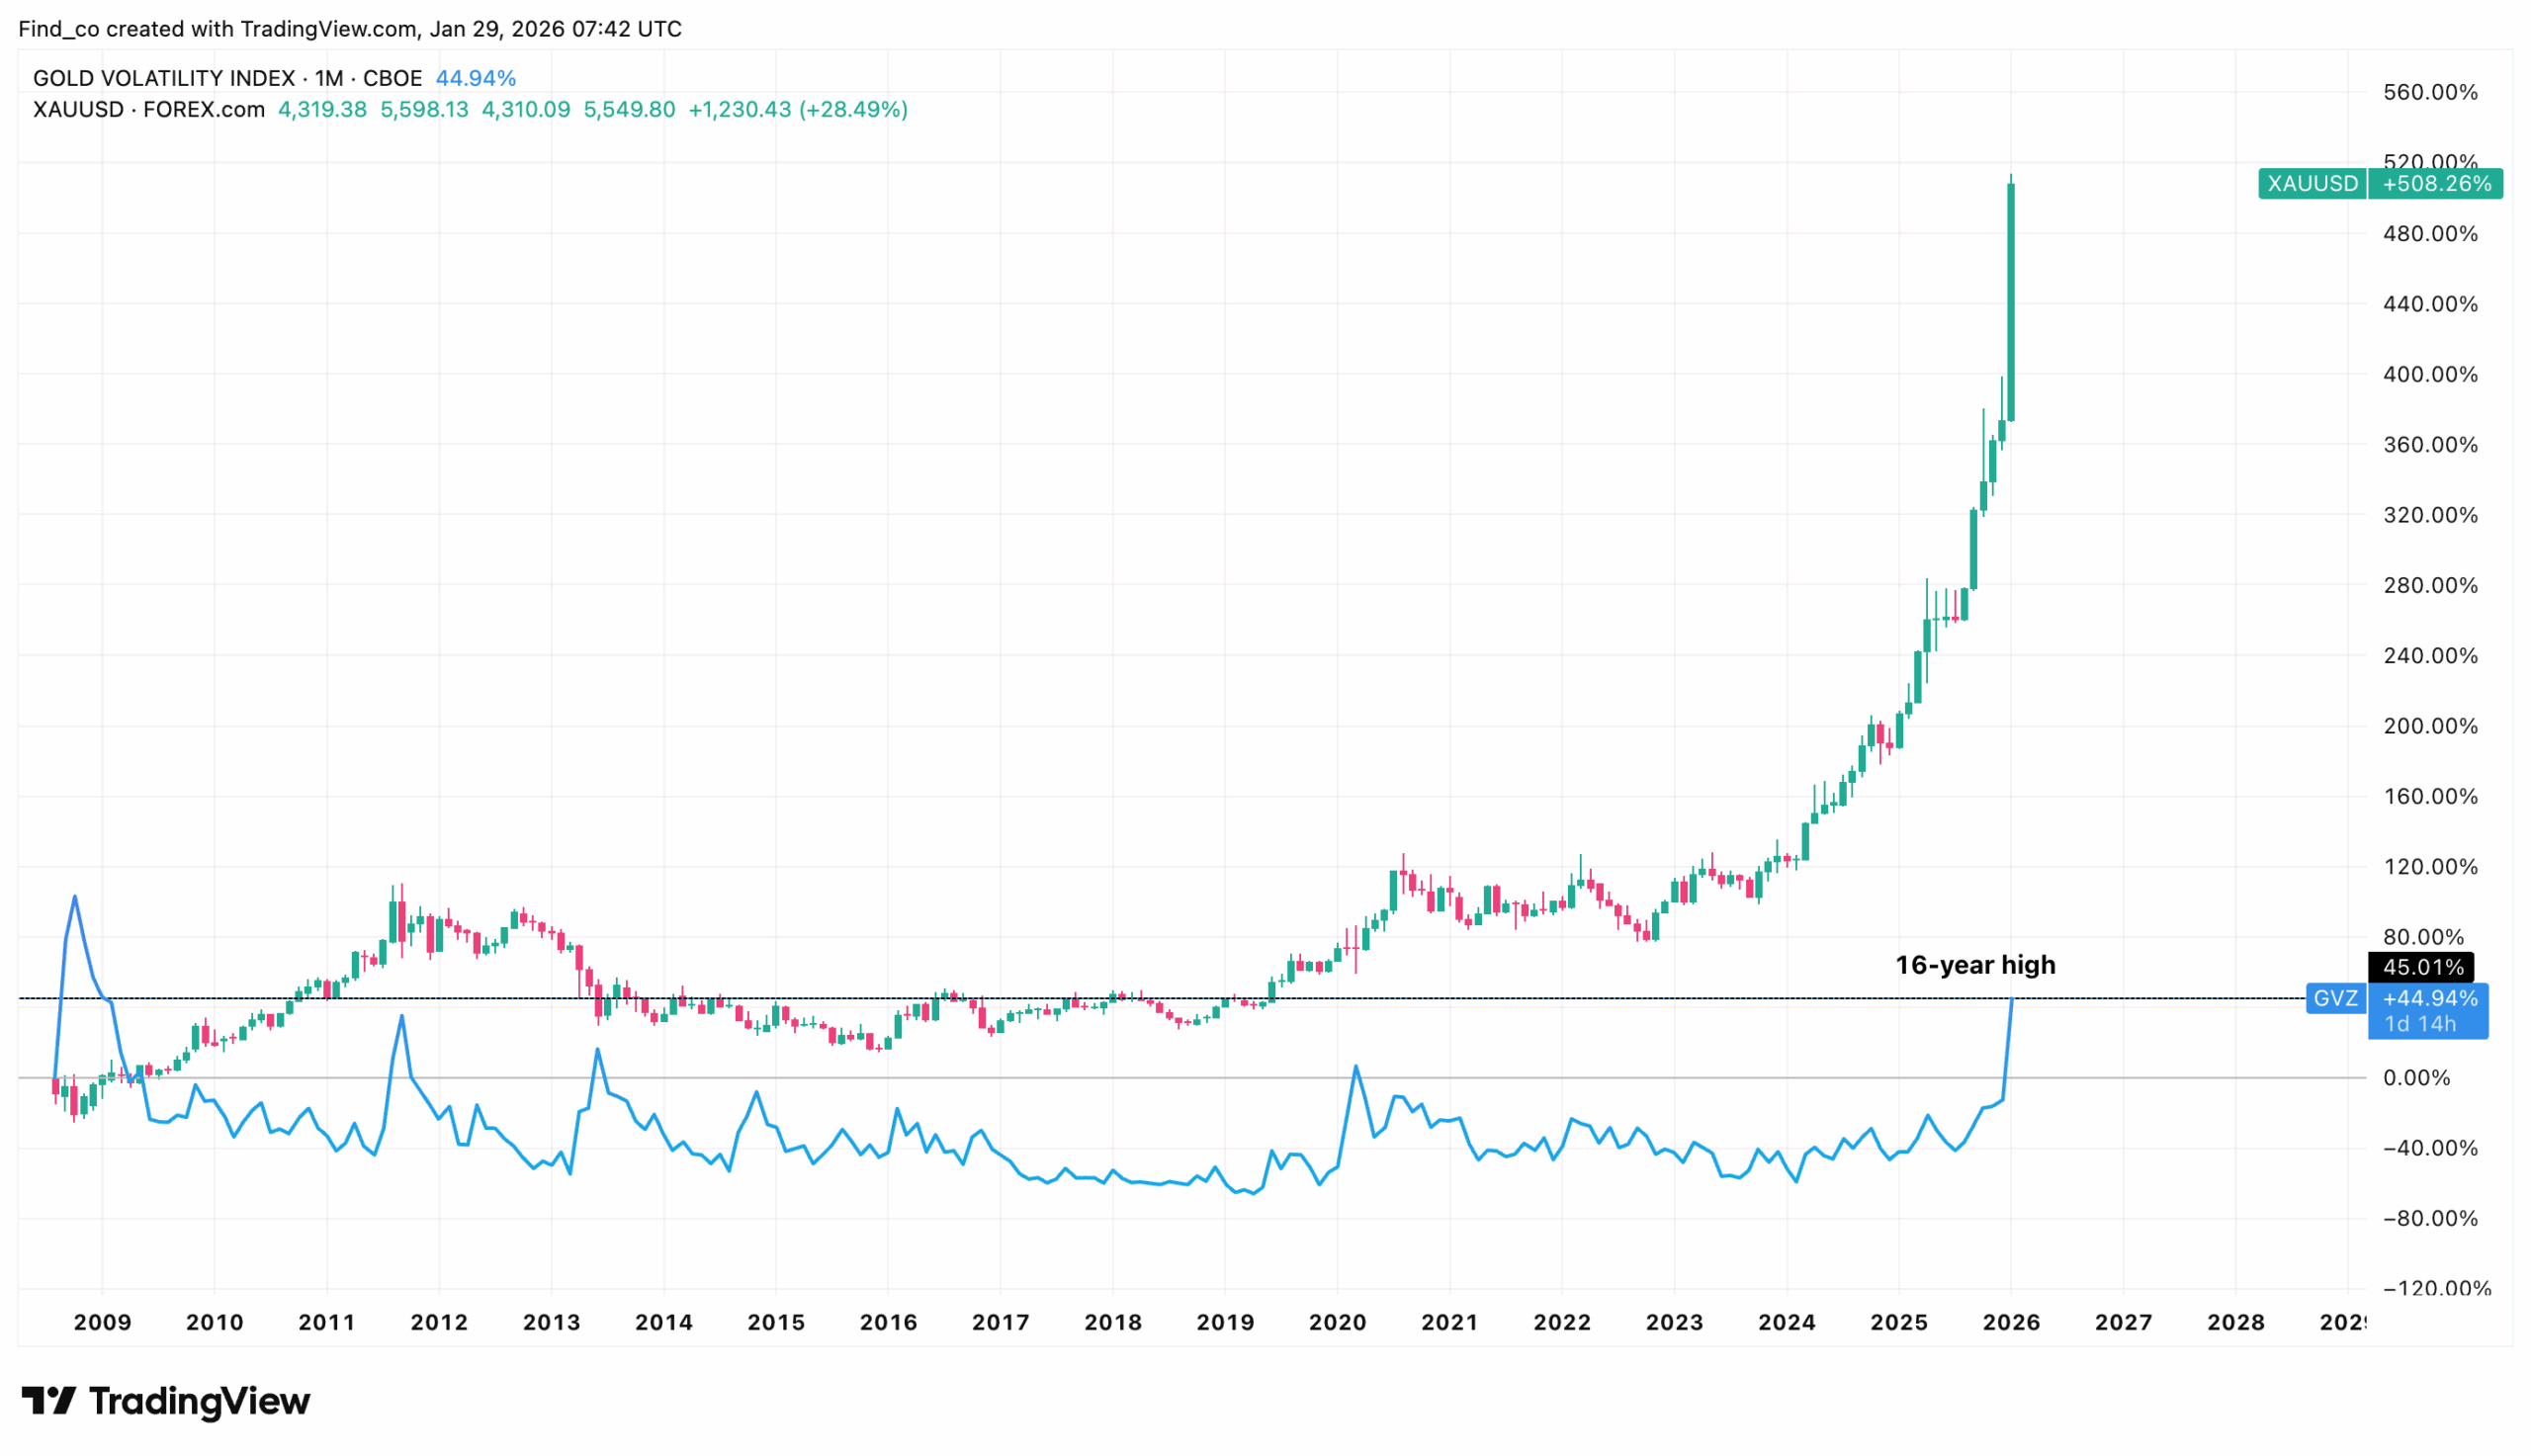
Gold Volatility Hits 16-Year High
Gold, in particular, is entering a phase where the headline is not the new high; it’s the path it’s taking to get there.
We’ve already seen spot gold hit record highs above $ 5,500 this week, and the broader conversation has shifted from “why is it up?” to “why is it moving like this?”
The volatility data backs that up. At the time of writing, the Gold Volatility Index (GVZ) has moved up around the 30-handle lately, a level that historically signals when gold stops being a slow signal and becomes a fast one.
The last time it reached this level was during the 2008 financial crisis.
Looking at the historical data, gold’s price has ripped higher while GVZ has punched to a 16-year high.
Normally, volatility spikes when markets panic at lows or when a trend shifts into a fast repricing phase.
Here, gold’s price is already trending up, so the spike looks less like a top signal and more like discovery mode.
In other words, traders are paying up for protection while gold keeps climbing.
As a result, the metal might experience bigger swings, not calm pullbacks.
Still, the historical pattern is clear. When volatility breaks out after long compression, gold often enters a high-momentum leg with sharp shakeouts along the way.
For instance, after the peak in 2028, the GVZ dropped in May 2009, and gold’s price climbed nearly 100% less than two years later.
Therefore, if history rhymes, and gold holds above prior breakout zones, the setup leans toward continuation, with corrections acting as resets before the next push higher
Why Is Silver Up?
Silver is doing what it always does in late-cycle commodity stress.
It is turning a macro hedge into a supply-and-delivery narrative. The price action has been explosive, with silver clearing $100 and futures printing triple-digit handles that would have sounded like satire a month ago.
The reason silver can outrun gold in moments like this is that it wears two hats at once.
It’s an inflation hedge when fear is the driver, and it’s an industrial input when scarcity is the driver, and right now, both stories are pulling in the same direction.
That scarcity story is being tightened by policy. China has moved to restrict silver exports via new controls, which is exactly the kind of headline that makes industrial buyers and financial hedgers look at the same supply chain.
Layer on top of that the visible stress people are watching in the futures market — elevated open interest into forward months and a rising fixation on what’s truly deliverable versus what’s merely paper exposure — and silver starts to trade less like “a metal” and more like a constraint.
Gold and Silver Flash-Crashed Earlier
Before the recent rally, both gold and silver flash-crashed. The chaos appeared to begin around 10:14 a.m. EST on Jan. 26, after gold and silver had reached new all-time highs.
However, shortly after that, a large sell order had hit the books, triggering a chain reaction.
First, spot gold, which had been trading at an all-time high of $5,110, briefly plummeted to $4,650 on some feeds. Next, Silver momentarily collapsed from $110 to $88.
According to CCN’s findings, the initial crash wiped out $1.7 trillion in value from the metals, equal to the total Bitcoin market cap.
Unconfirmed reports suggest a major institutional desk in Singapore accidentally executed a “market sell” instead of a “limit sell” on a massive basket of commodity-linked derivatives, overwhelming the order books during a period of thin liquidity.
However, it did not take long for the gold and silver prices to recover. As of today, the combined gains in gold and silver on Jan. 28 is more than the market cap of Bitcoin.
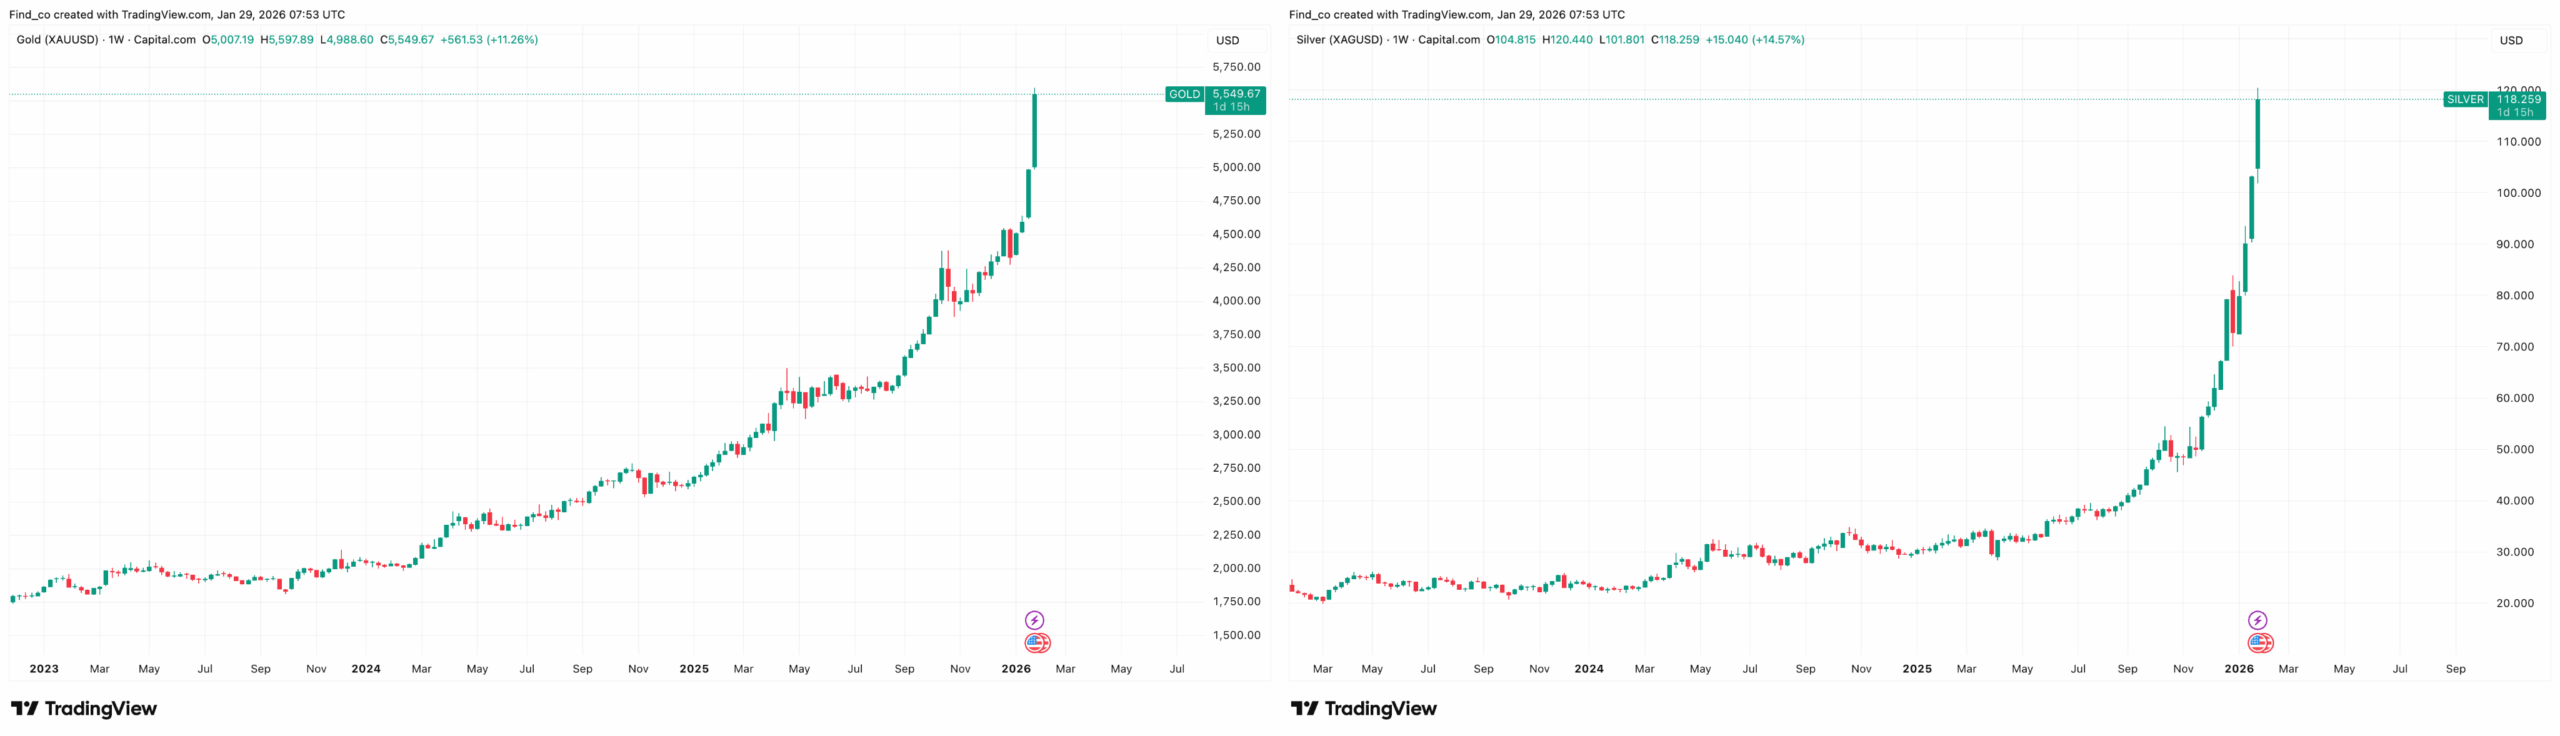
Gold vs. Silver Weekly Chart | Credit: TradingView
Based on CCN’s findings, the looming threat of a U.S. government shutdown on Jan. 31, 2026, triggered a historic rush into precious metals.
At the same time, a growing crisis of confidence in the U.S. dollar has stoked the rally.
Notably, prediction markets now put the odds of a shutdown at 80%.
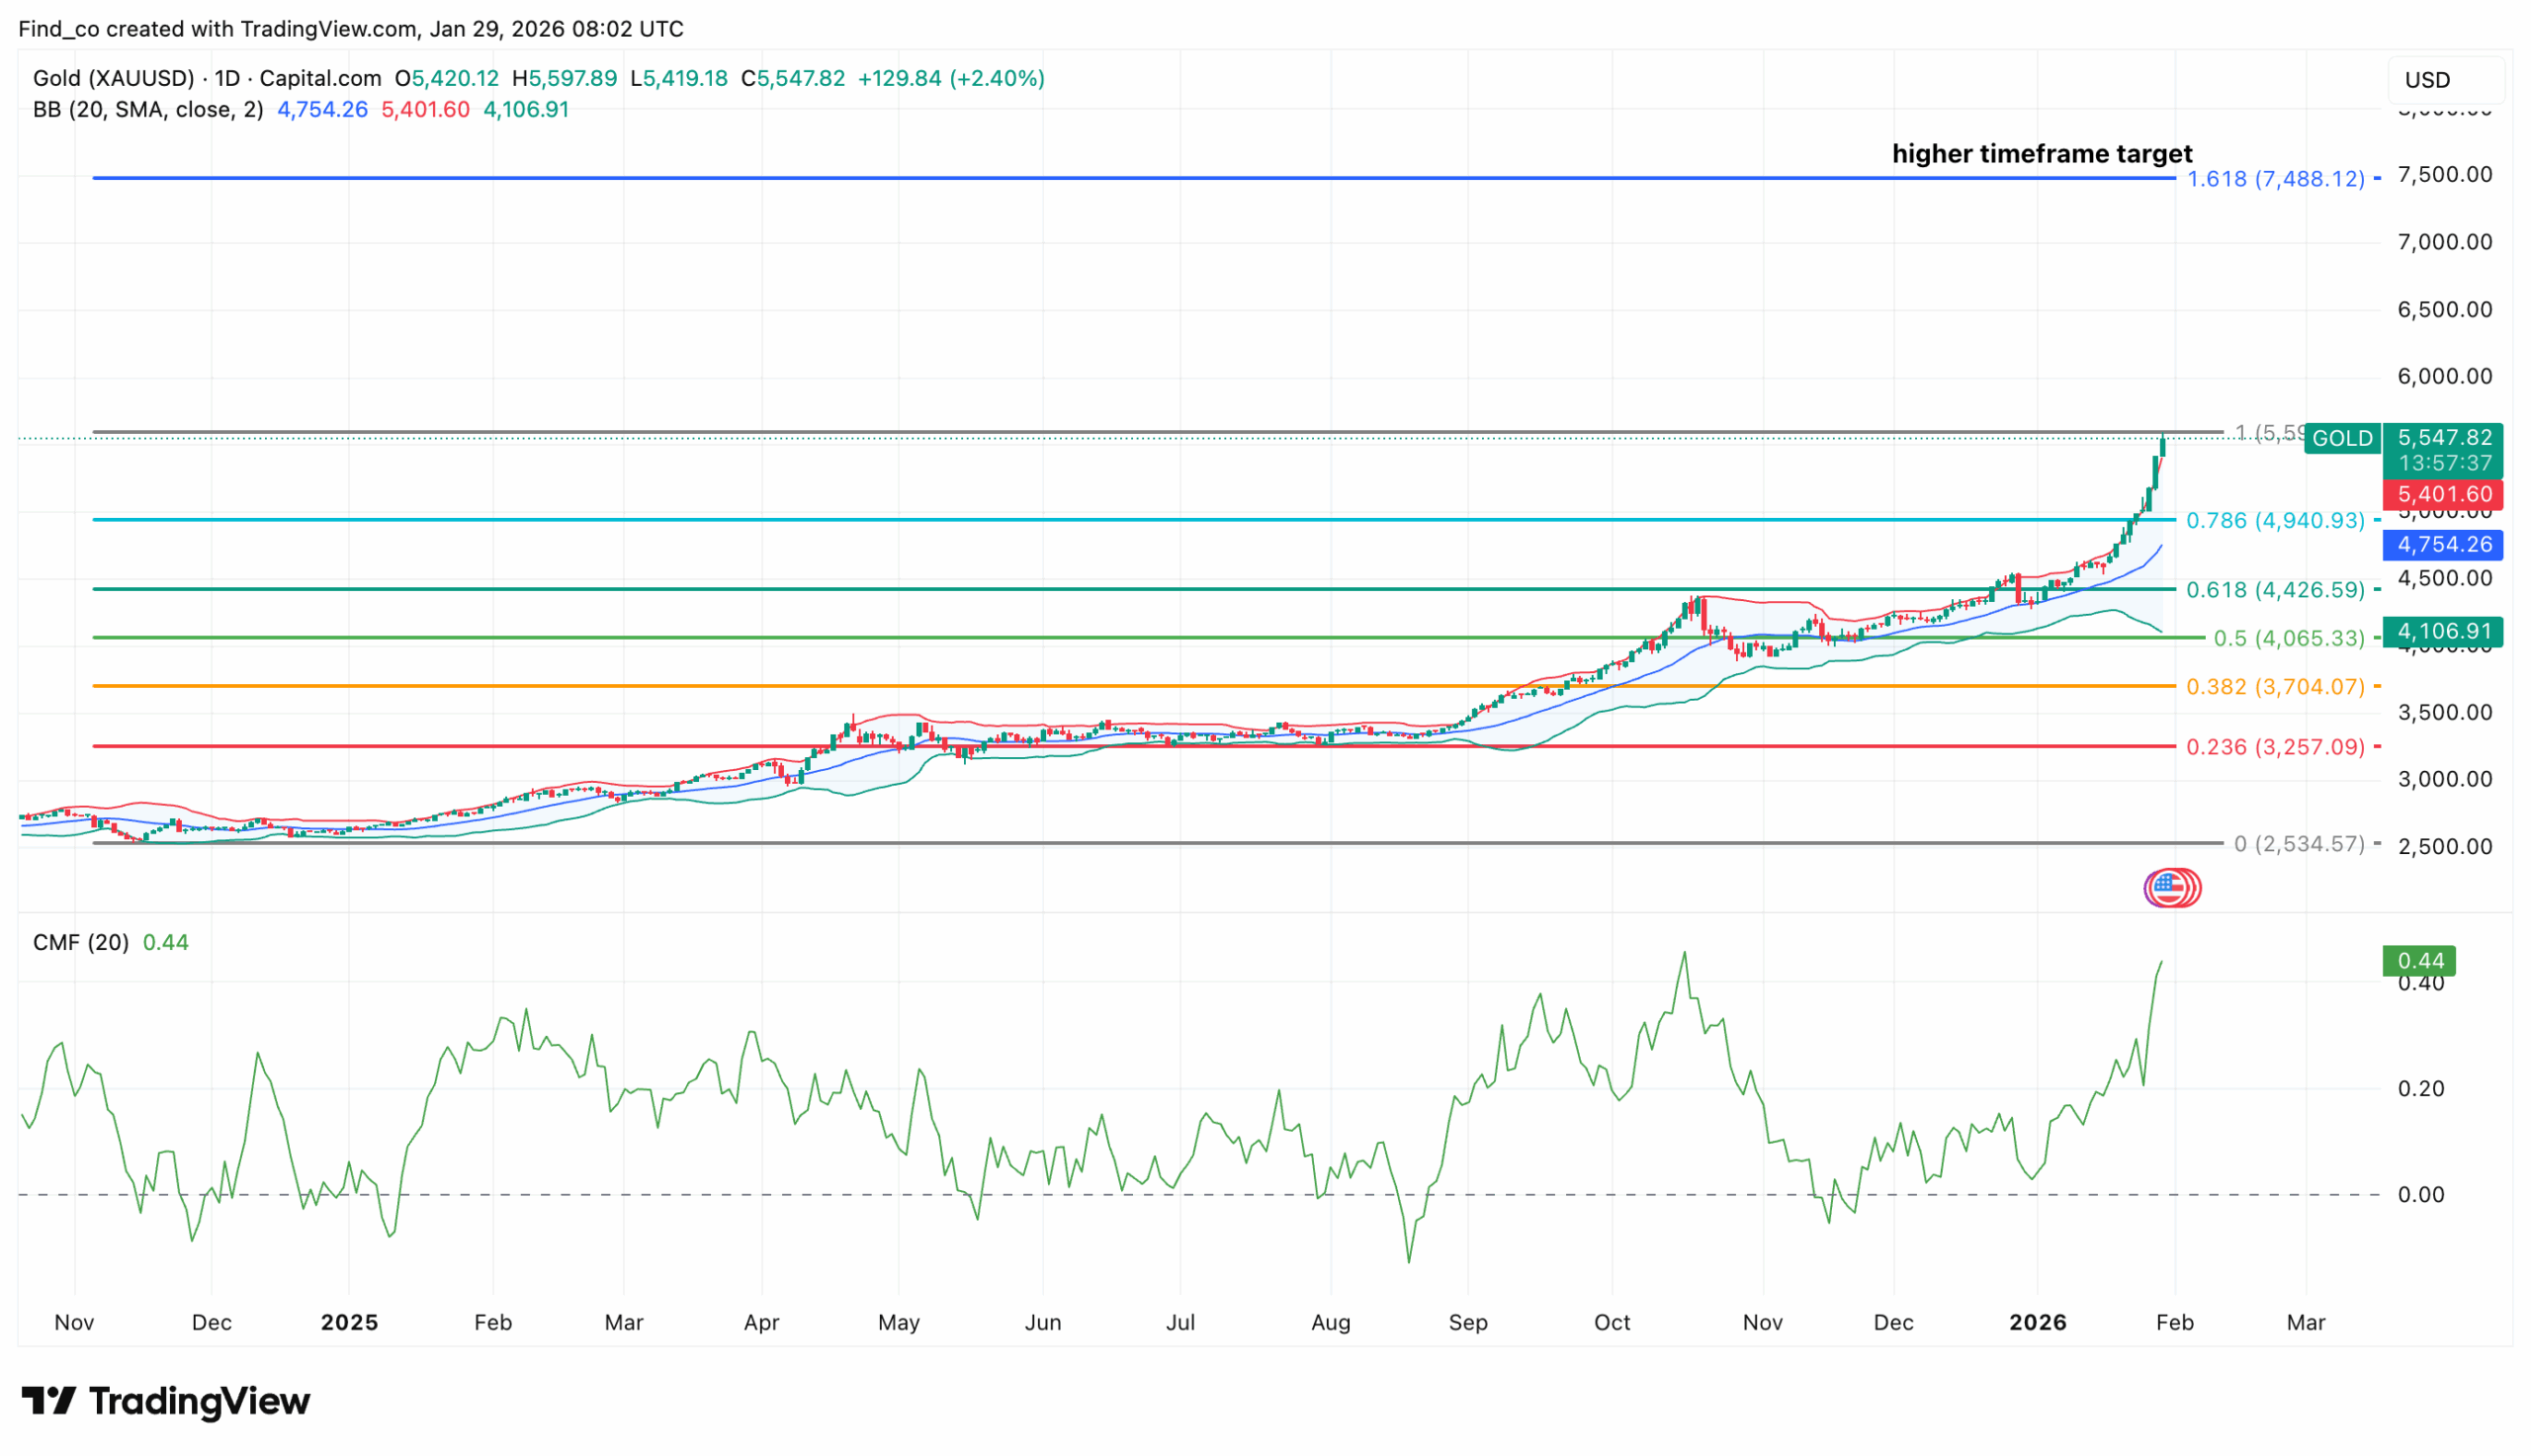
On the daily chart, price has risen toward $5,550 and, more importantly, cleared the 0.786 Fibonacci retracement at $4,940 without hesitation. That’s typically the kind of level that caps late-stage moves. Instead, gold treated it like a speed bump.
The structure also matters. The trend is steep, but it isn’t chaotic. Price continues to trade above the upper Bollinger Band (BBP), suggesting controlled expansion rather than a blow-off spike. W
Furthermore, the Chaikin Money Flow (CMF) has risen to 0.44, the strongest reading in months, consistent with sustained capital inflows.
Historically, when gold breaks major Fibonacci resistance while money flow rises, it tends to reprice higher over a longer window even if the near-term path is choppy.
If sustained, the next target becomes the 1.618 extension around $7,450, which is a higher-timeframe target.
However, note that gold won’t travel there in a straight line. But the direction of travel stays higher as long as the former breakout band around $$5,000 holds.
The trade-off is that risk rises with speed. Vertical advances invite sharp consolidations and volatility-driven air pockets.
But unless gold loses the $4,750 to $4,900 region with real force and volume, pullbacks are more likely to function as resets.
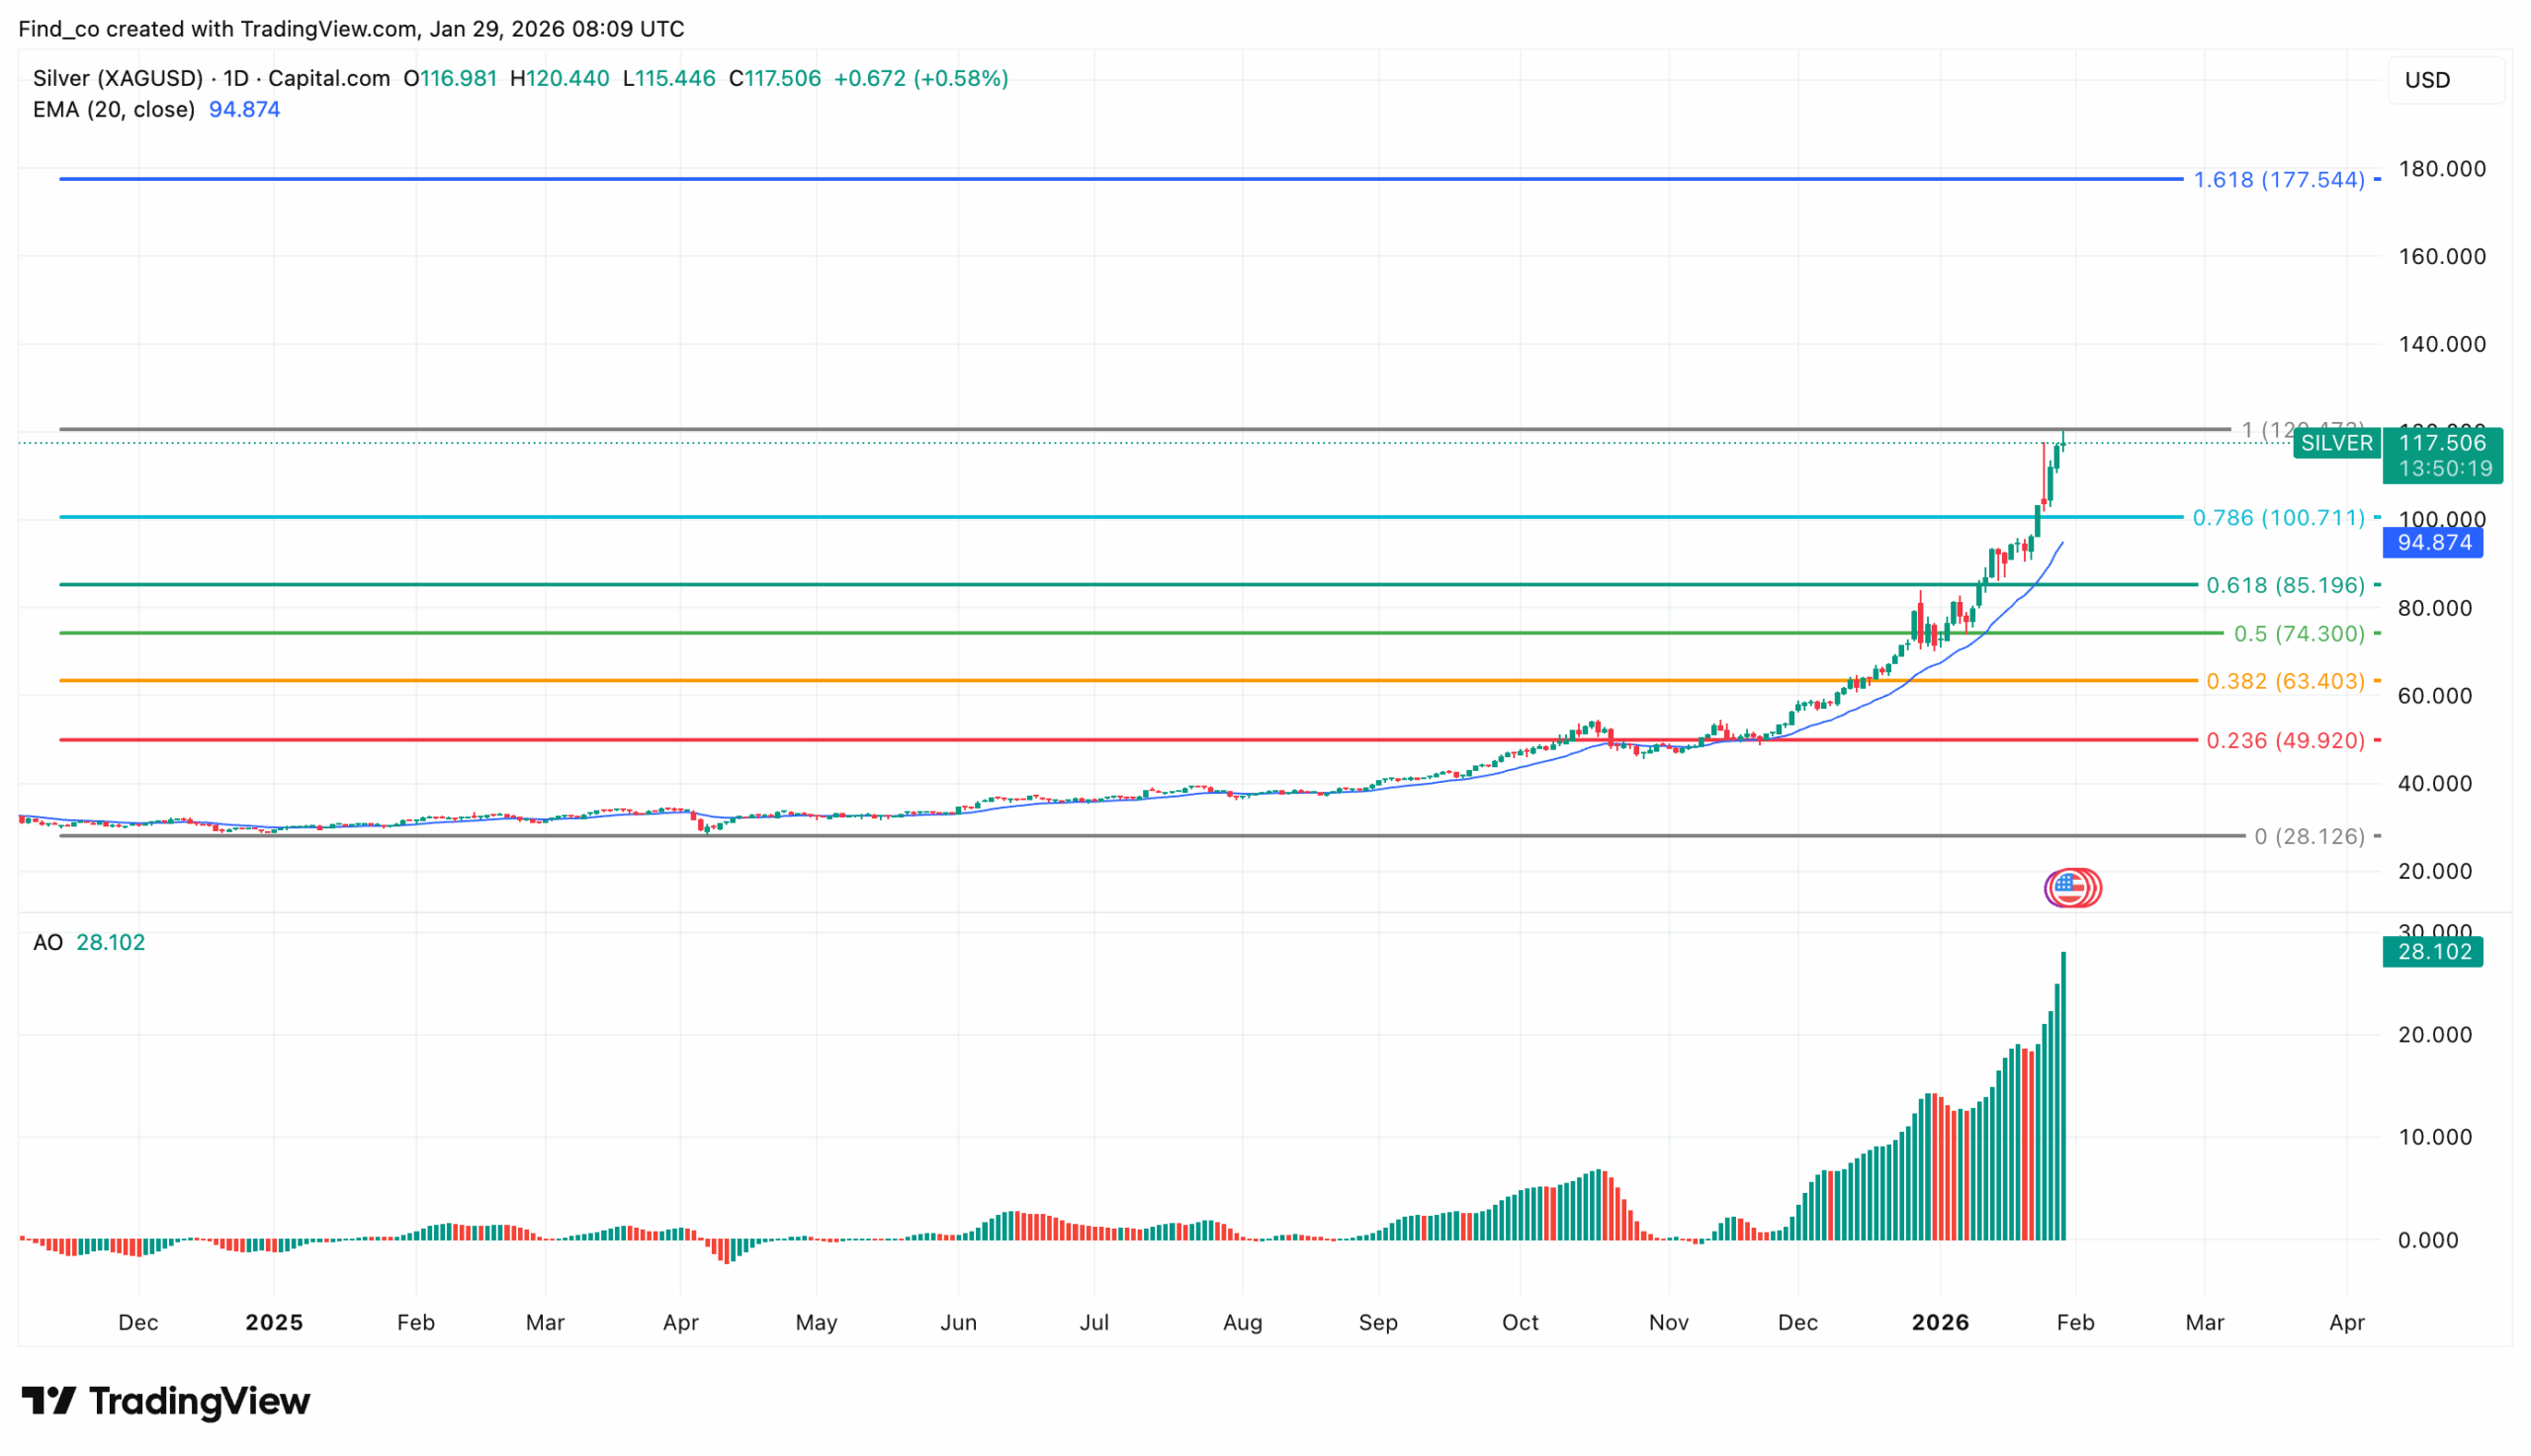
Silver Price Analysis
For silver, it is extending its parabolic rally, and the latest daily chart shows momentum tightening rather than stalling.
Price is trading near $117.64, afterclearing the 0.786 Fibonacci level around $100.71. Notably, the precious metal briefly hit $120 today.
Despite the slight pullback, the trend structure remains intact. Price continues to respect the rising 20-day EMA near $94.87, which has acted as support throughout the rally.
Each pullback since late 2025 has been shallow and quickly absorbed, reinforcing the idea that buyers remain in control.
Meanwhile, the Awesome Oscillator (AO) is printing expanding green bars, confirming that bullish momentum is still building.
Historically, when silver clears the 0.786 retracement level with rising momentum, it often enters a price-discovery phase, similar to past commodity supercycles.
While interim consolidations are likely given the steepness of the move, the chart suggests they would serve as pauses, not reversals.
Looking ahead, the key risk lies in volatility.
Silver’s quick upswing increases the odds of sharp pullbacks, especially if speculative positioning becomes crowded. However, as long as price holds above the $105 breakout zone, the broader trend remains bullish.
If this remains the same, silver’s price might rally to $77.54. However, traders need to watch out.
Should demand drop, silver’s price might decline to $85.20.
In the meantime, a veteran trader who once called the silver cycle top has mentioned that the rally might not be over just yet.
“Today nearly 2years of world production traded on world exchanges More than 1.5 billion ounces The last time such a proportion traded was Apr 25, the day of the 2011 top I called that top on Apr 24, 2011. Not this time though,” Brandt posted.
Disclaimer:
The information provided in this article is for informational purposes only. It is not intended to be, nor should it be construed as, financial advice. We do not make any warranties regarding the completeness, reliability, or accuracy of this information. All investments involve risk, and past performance does not guarantee future results. We recommend consulting a financial advisor before making any investment decisions.
Victor Olanrewaju is a crypto analyst and reporter at CCN with deep roots in on-chain research and technical analysis. His crypto journey began in 2017, but it was the 2020 Uniswap airdrop that sparked a full-time pivot into the space.
With a foundation in copywriting, Victor honed his craft creating high-converting content for leading crypto brokers — most notably an XRP price prediction that ranked #1 on Google during the 2021 bull run.
He later joined AMBCrypto in 2022, where he combined storytelling with technical and on-chain analysis to cover key market narratives.
In 2024, he expanded his expertise at BeInCrypto, collaborating with analysts and using tools like Glassnode, Santiment, and IntoTheBlock to break down Bitcoin and altcoin trends.
At CCN, Victor covers the top cryptocurrencies, memecoins, macro shifts, blending real-time insights with deep-dive metrics.
He holds a Bachelor’s degree in Physics from the University of Ibadan, equipping him to simplify complex data for a wide audience. Follow his work or connect on LinkedIn or X.