Discover how Ethena powers ether.fi USD, why Ether.fi is launching a branded stablecoin, and what remains unknown about reserves and rewards. | Credit: CCN.com
Share
Key Takeaways
Ethereum’s price regained momentum as buying pressure increased at the start of the new week.
Higher lows formed consistently; however, ETH’s price remained below major resistance levels.
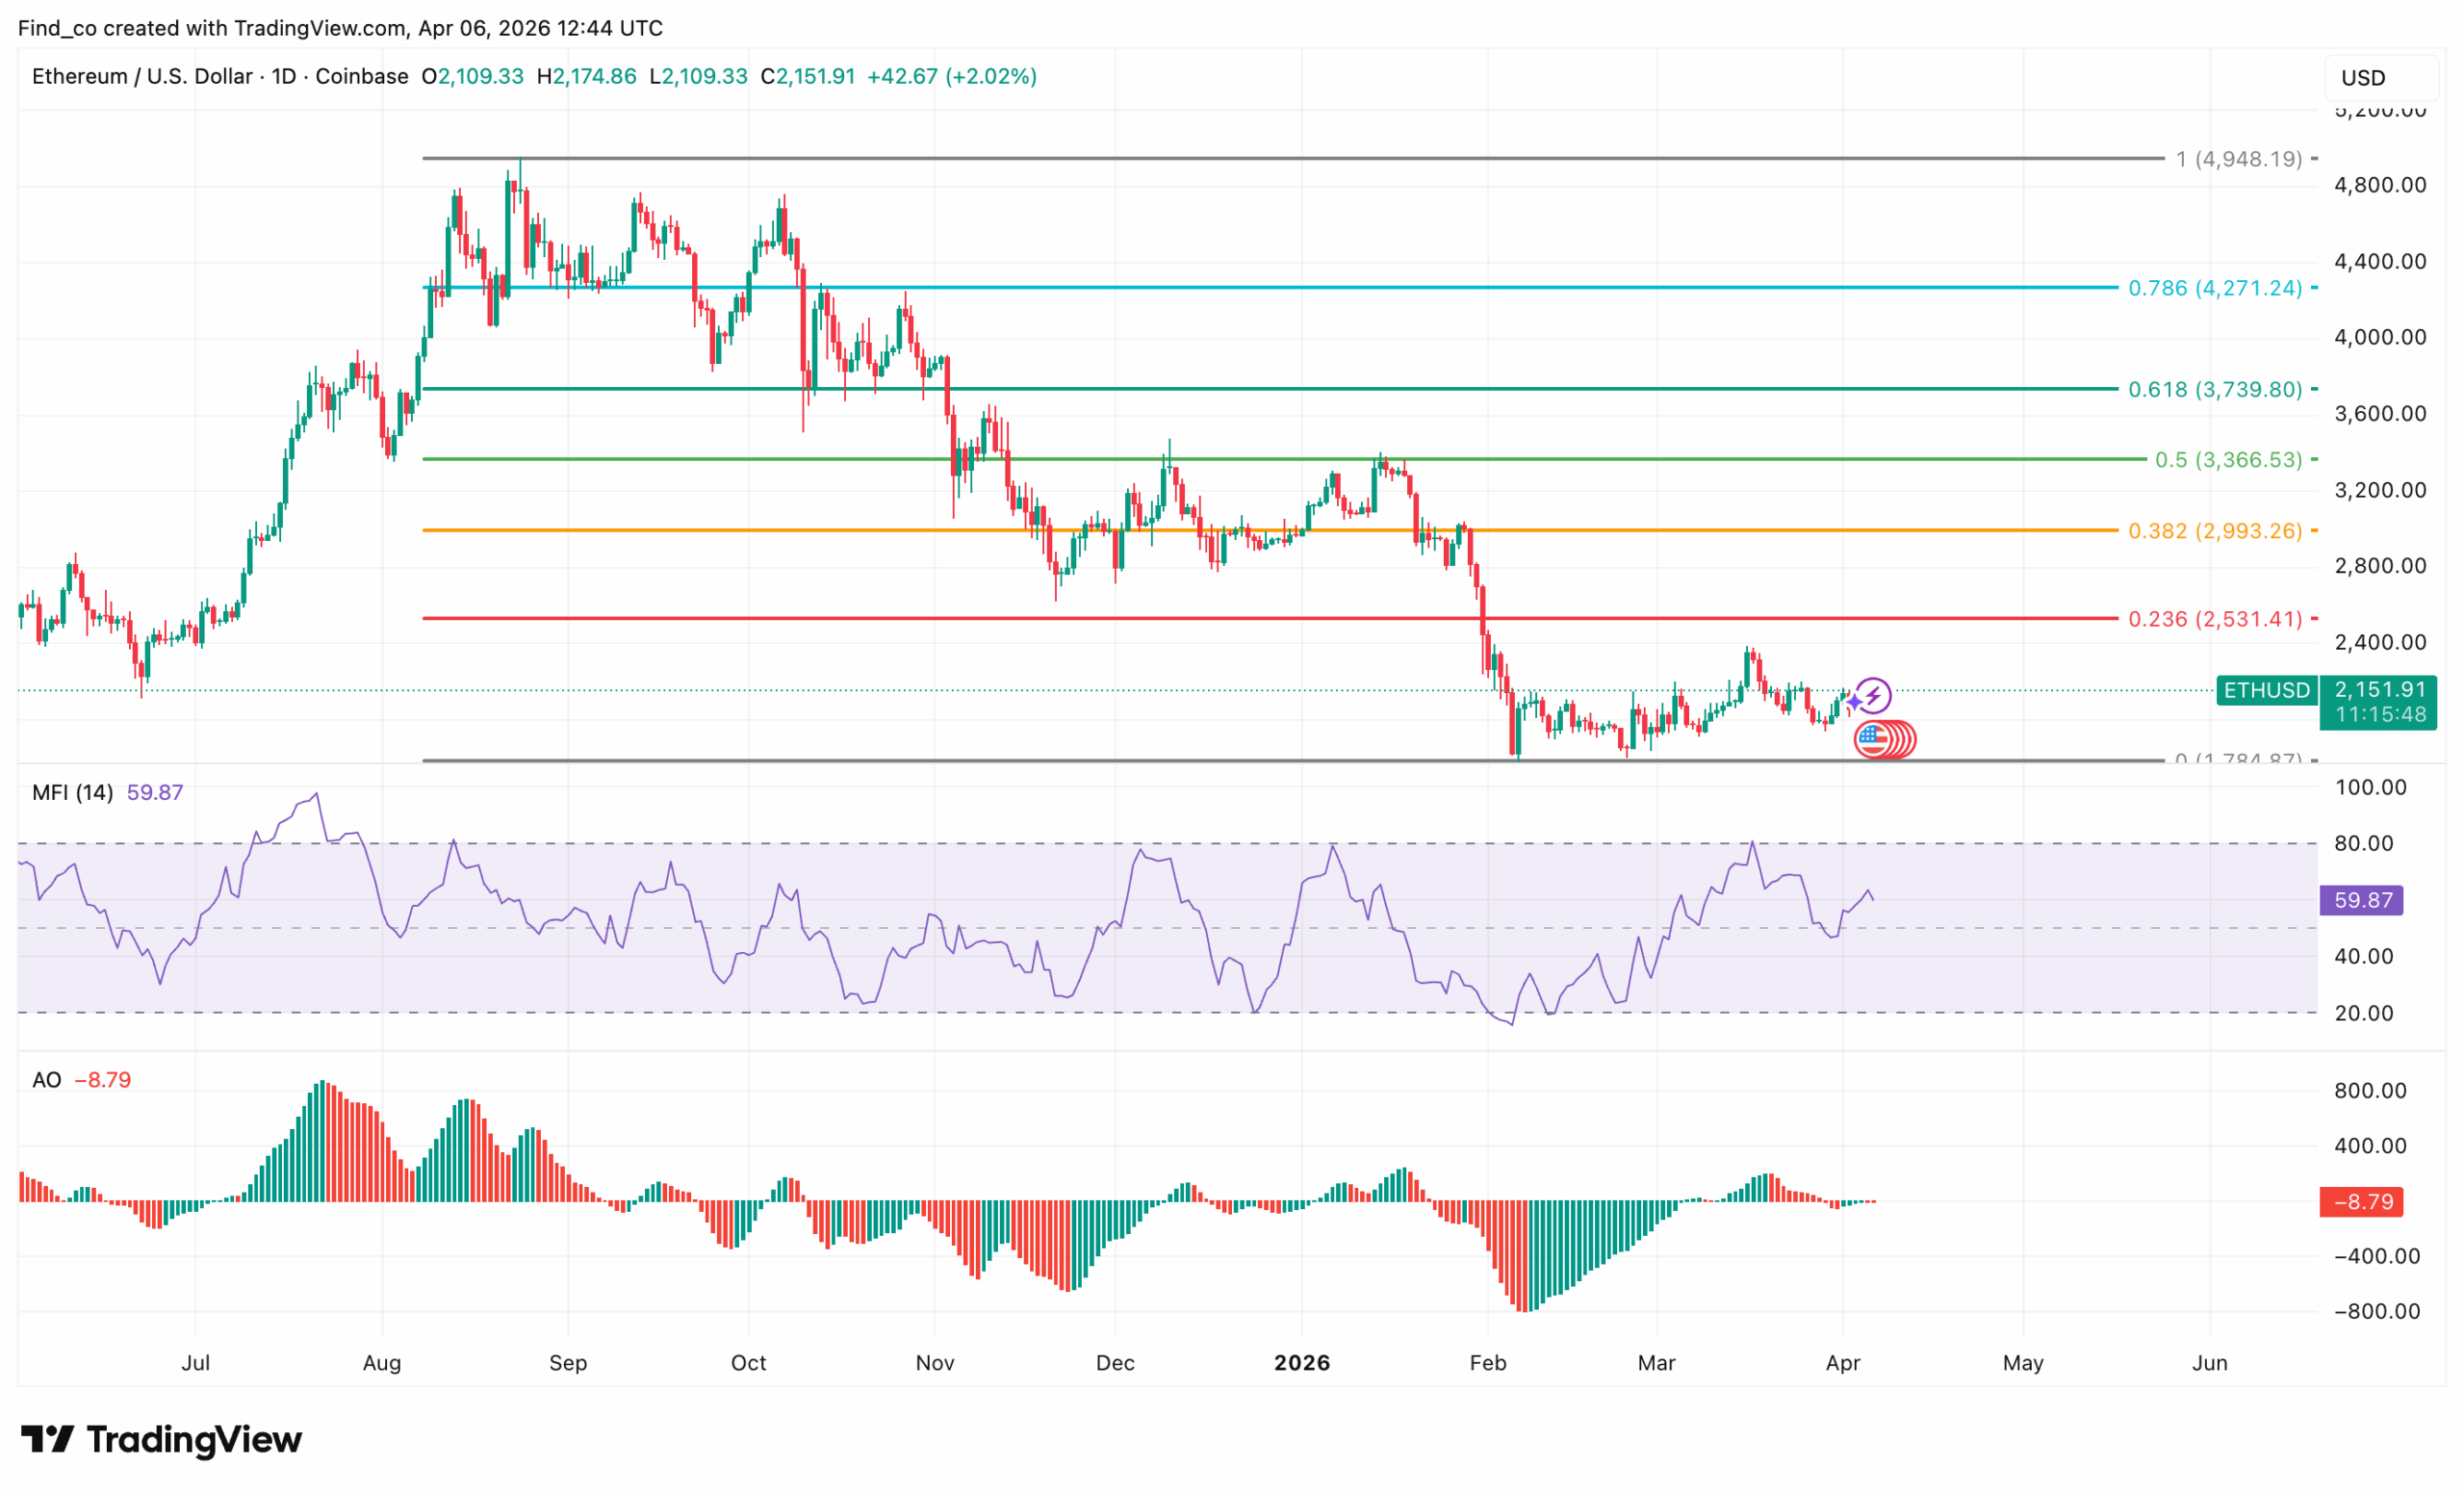
The ETH price is looking to reclaim $2,500, but confirmation is still required in the short term.
Ethereum (ETH) is showing bullish strength after failing to break below key support levels, indicating that selling pressure is weakening.
This type of price action often leads to upward momentum, as buyers regain control.
If Ethereum’s price continues to hold support and break resistance, the next target is around $2,500.
Ethereum Strength Slowly Builds
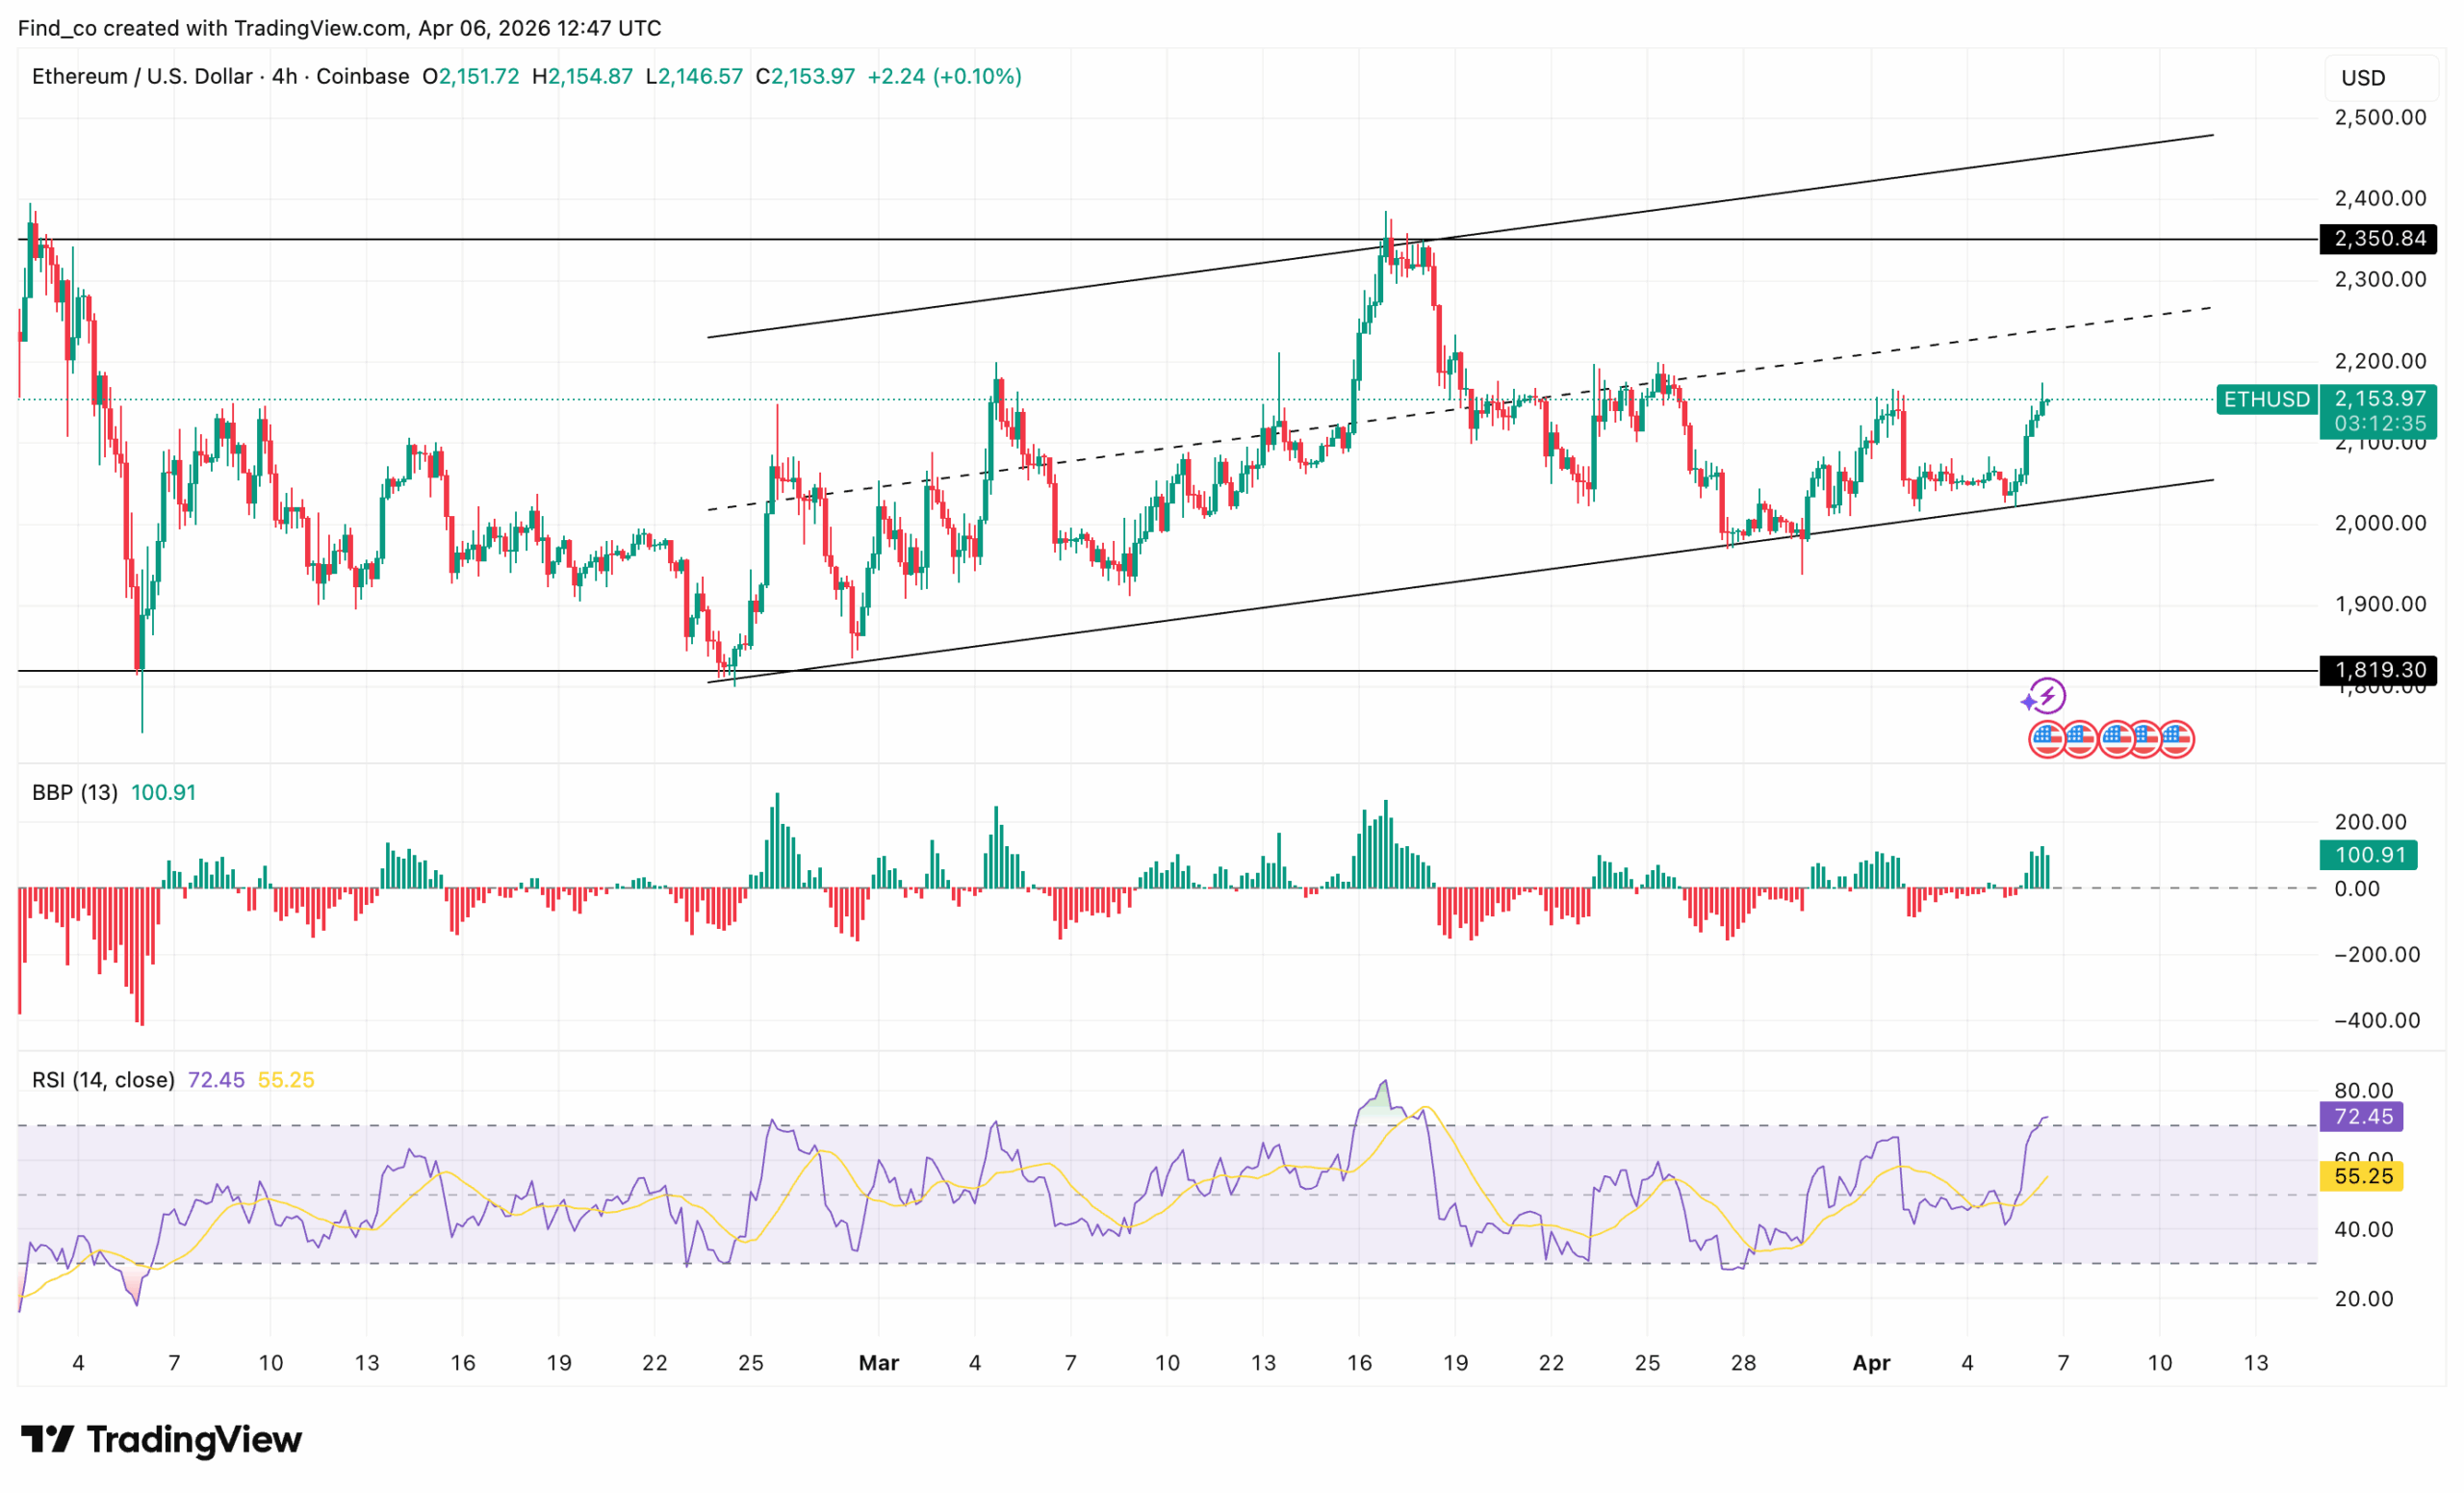
ETH regained traction after weeks of choppy price action. Price advanced steadily toward the $2,200 resistance zone, signaling renewed buyer interest. Even so, the broader structure remained range-bound.
At the time of analysis, ETH traded near $2,154 after recovering from recent lows around $2,000.
This rebound followed a series of higher lows, indicating that buyers had started to take control of short-term direction.
However, ETH’s price remained capped beneath a clearly defined resistance band.
On the 4-hour chart, momentum indicators aligned with this shift. The Bull Bear Power (BBP) histogram flipped firmly positive, reflecting growing buying pressure.
Meanwhile, the Relative Strength Index (RSI) climbed above 70, signaling strong momentum but also approaching overbought conditions.
This combination suggested continued near-term growth. However, it also indicated that a temporary pullback will likely occur if buyers become exhausted near resistance.
Derivatives Data Confirms Bullish Shift
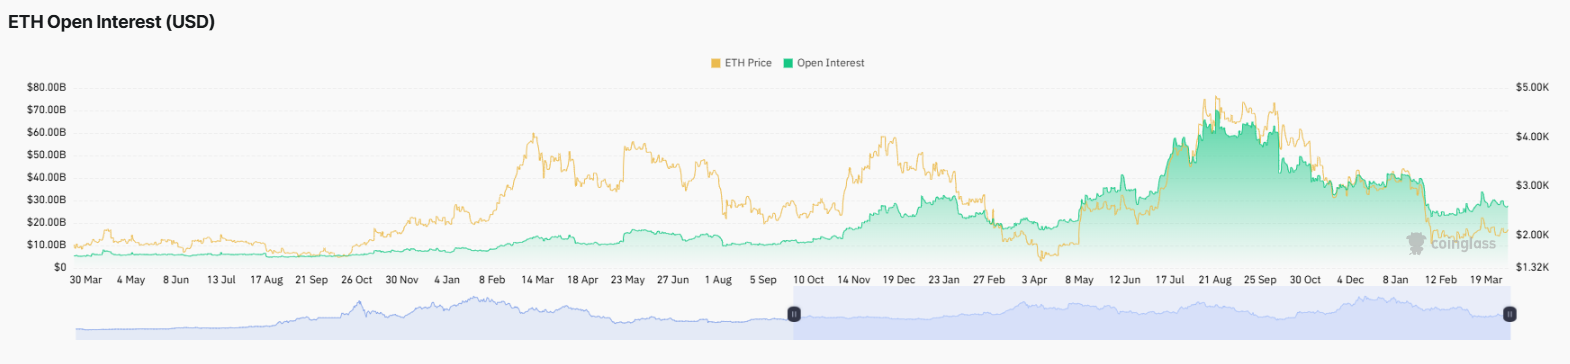
In the derivatives market, Ethereum showed clear signs of renewed activity. Open Interest (OI) increased by 11%, indicating that traders were actively entering new positions.
At the same time, funding rates turned positive to 0.0014%, confirming that long positions had begun to dominate. This shift reflected improving market confidence.
However, leverage remained relatively controlled. The modest funding rate suggested that positioning was not yet overcrowded, reducing the immediate risk of large-scale liquidations.
If this trend continues alongside price strength, it will likely support further upside. For now, the data reflected cautious but growing bullish sentiment.
However, if resistance holds, the rally will likely stall. In that case, price will pull back toward the $2,000 support zone, with deeper downside possible if momentum weakens further.
For now, Ethereum showed constructive recovery signals.
However, confirmation remained essential. The next move (either a breakout or a rejection) will determine whether ETH transitions into a sustained uptrend or continues trading within its broader range.
Disclaimer:
The information provided in this article is for informational purposes only. It is not intended to be, nor should it be construed as, financial advice. We do not make any warranties regarding the completeness, reliability, or accuracy of this information. All investments involve risk, and past performance does not guarantee future results. We recommend consulting a financial advisor before making any investment decisions.
Victor Olanrewaju is a crypto analyst and reporter at CCN with deep roots in on-chain research and technical analysis. His crypto journey began in 2017, but it was the 2020 Uniswap airdrop that sparked a full-time pivot into the space.
With a foundation in copywriting, Victor honed his craft creating high-converting content for leading crypto brokers — most notably an XRP price prediction that ranked #1 on Google during the 2021 bull run.
He later joined AMBCrypto in 2022, where he combined storytelling with technical and on-chain analysis to cover key market narratives.
In 2024, he expanded his expertise at BeInCrypto, collaborating with analysts and using tools like Glassnode, Santiment, and IntoTheBlock to break down Bitcoin and altcoin trends.
At CCN, Victor covers the top cryptocurrencies, memecoins, macro shifts, blending real-time insights with deep-dive metrics.
He holds a Bachelor’s degree in Physics from the University of Ibadan, equipping him to simplify complex data for a wide audience. Follow his work or connect on LinkedIn or X.