Bitcoin Could Reach $1 Million by 2027 and $5 Million by 2031, Peer-Reviewed Study Finds — But How Likely Is It?
Share
Key Takeaways
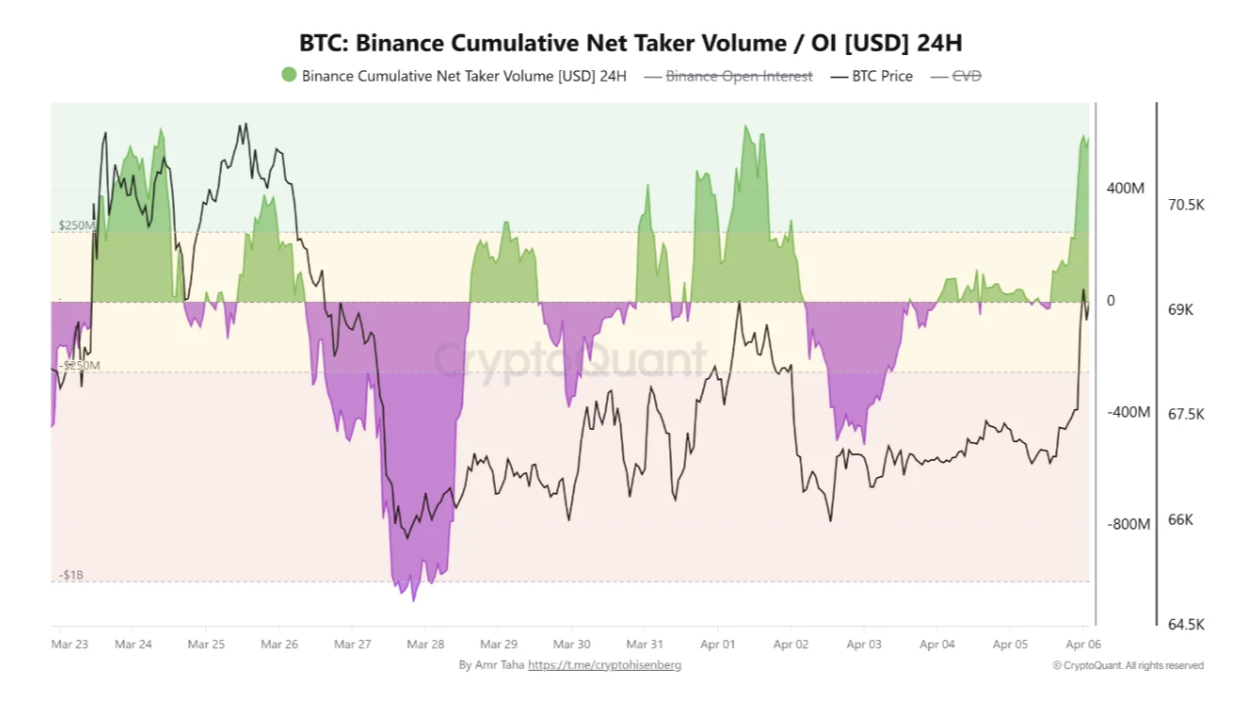
Binance’s cumulative net taker volume reached $595 million on April 6, signaling that derivatives traders are actively opening new positions in Bitcoin’s recovery.
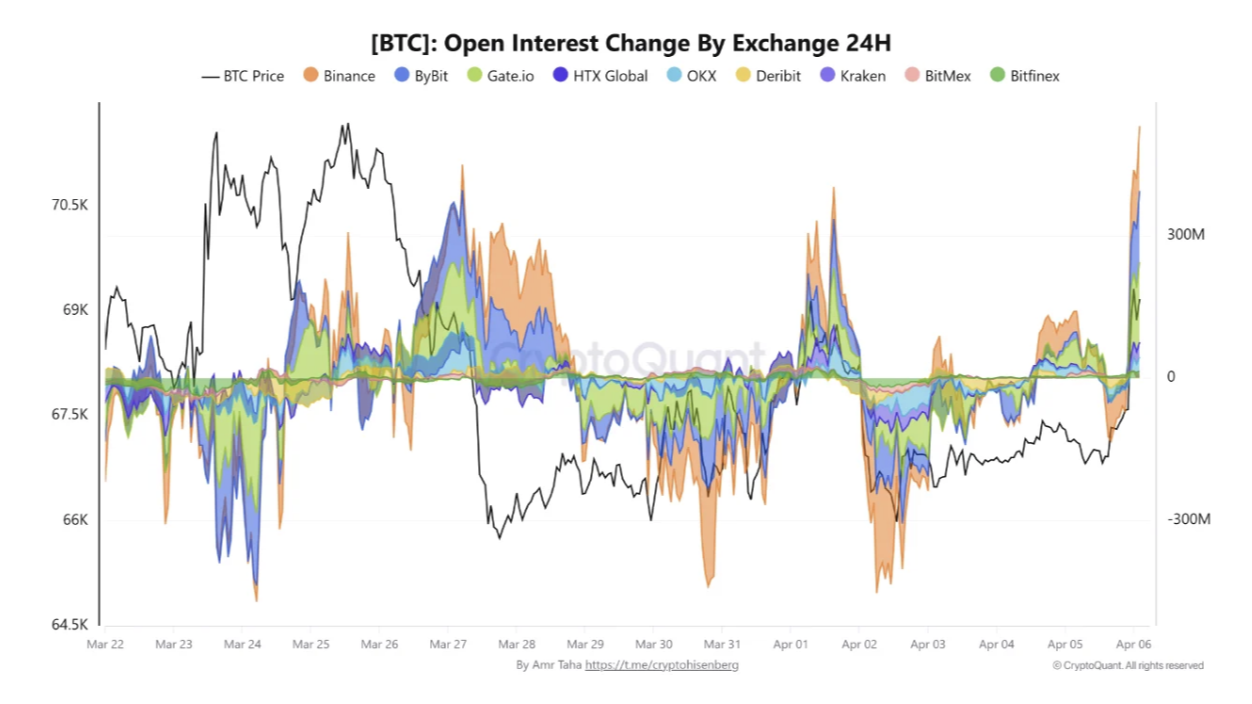
Daily open interest change nearly doubled from $67 million on April 1 to $136 million on April 6, even as BTC’s spot price rose only 2% over the same period.
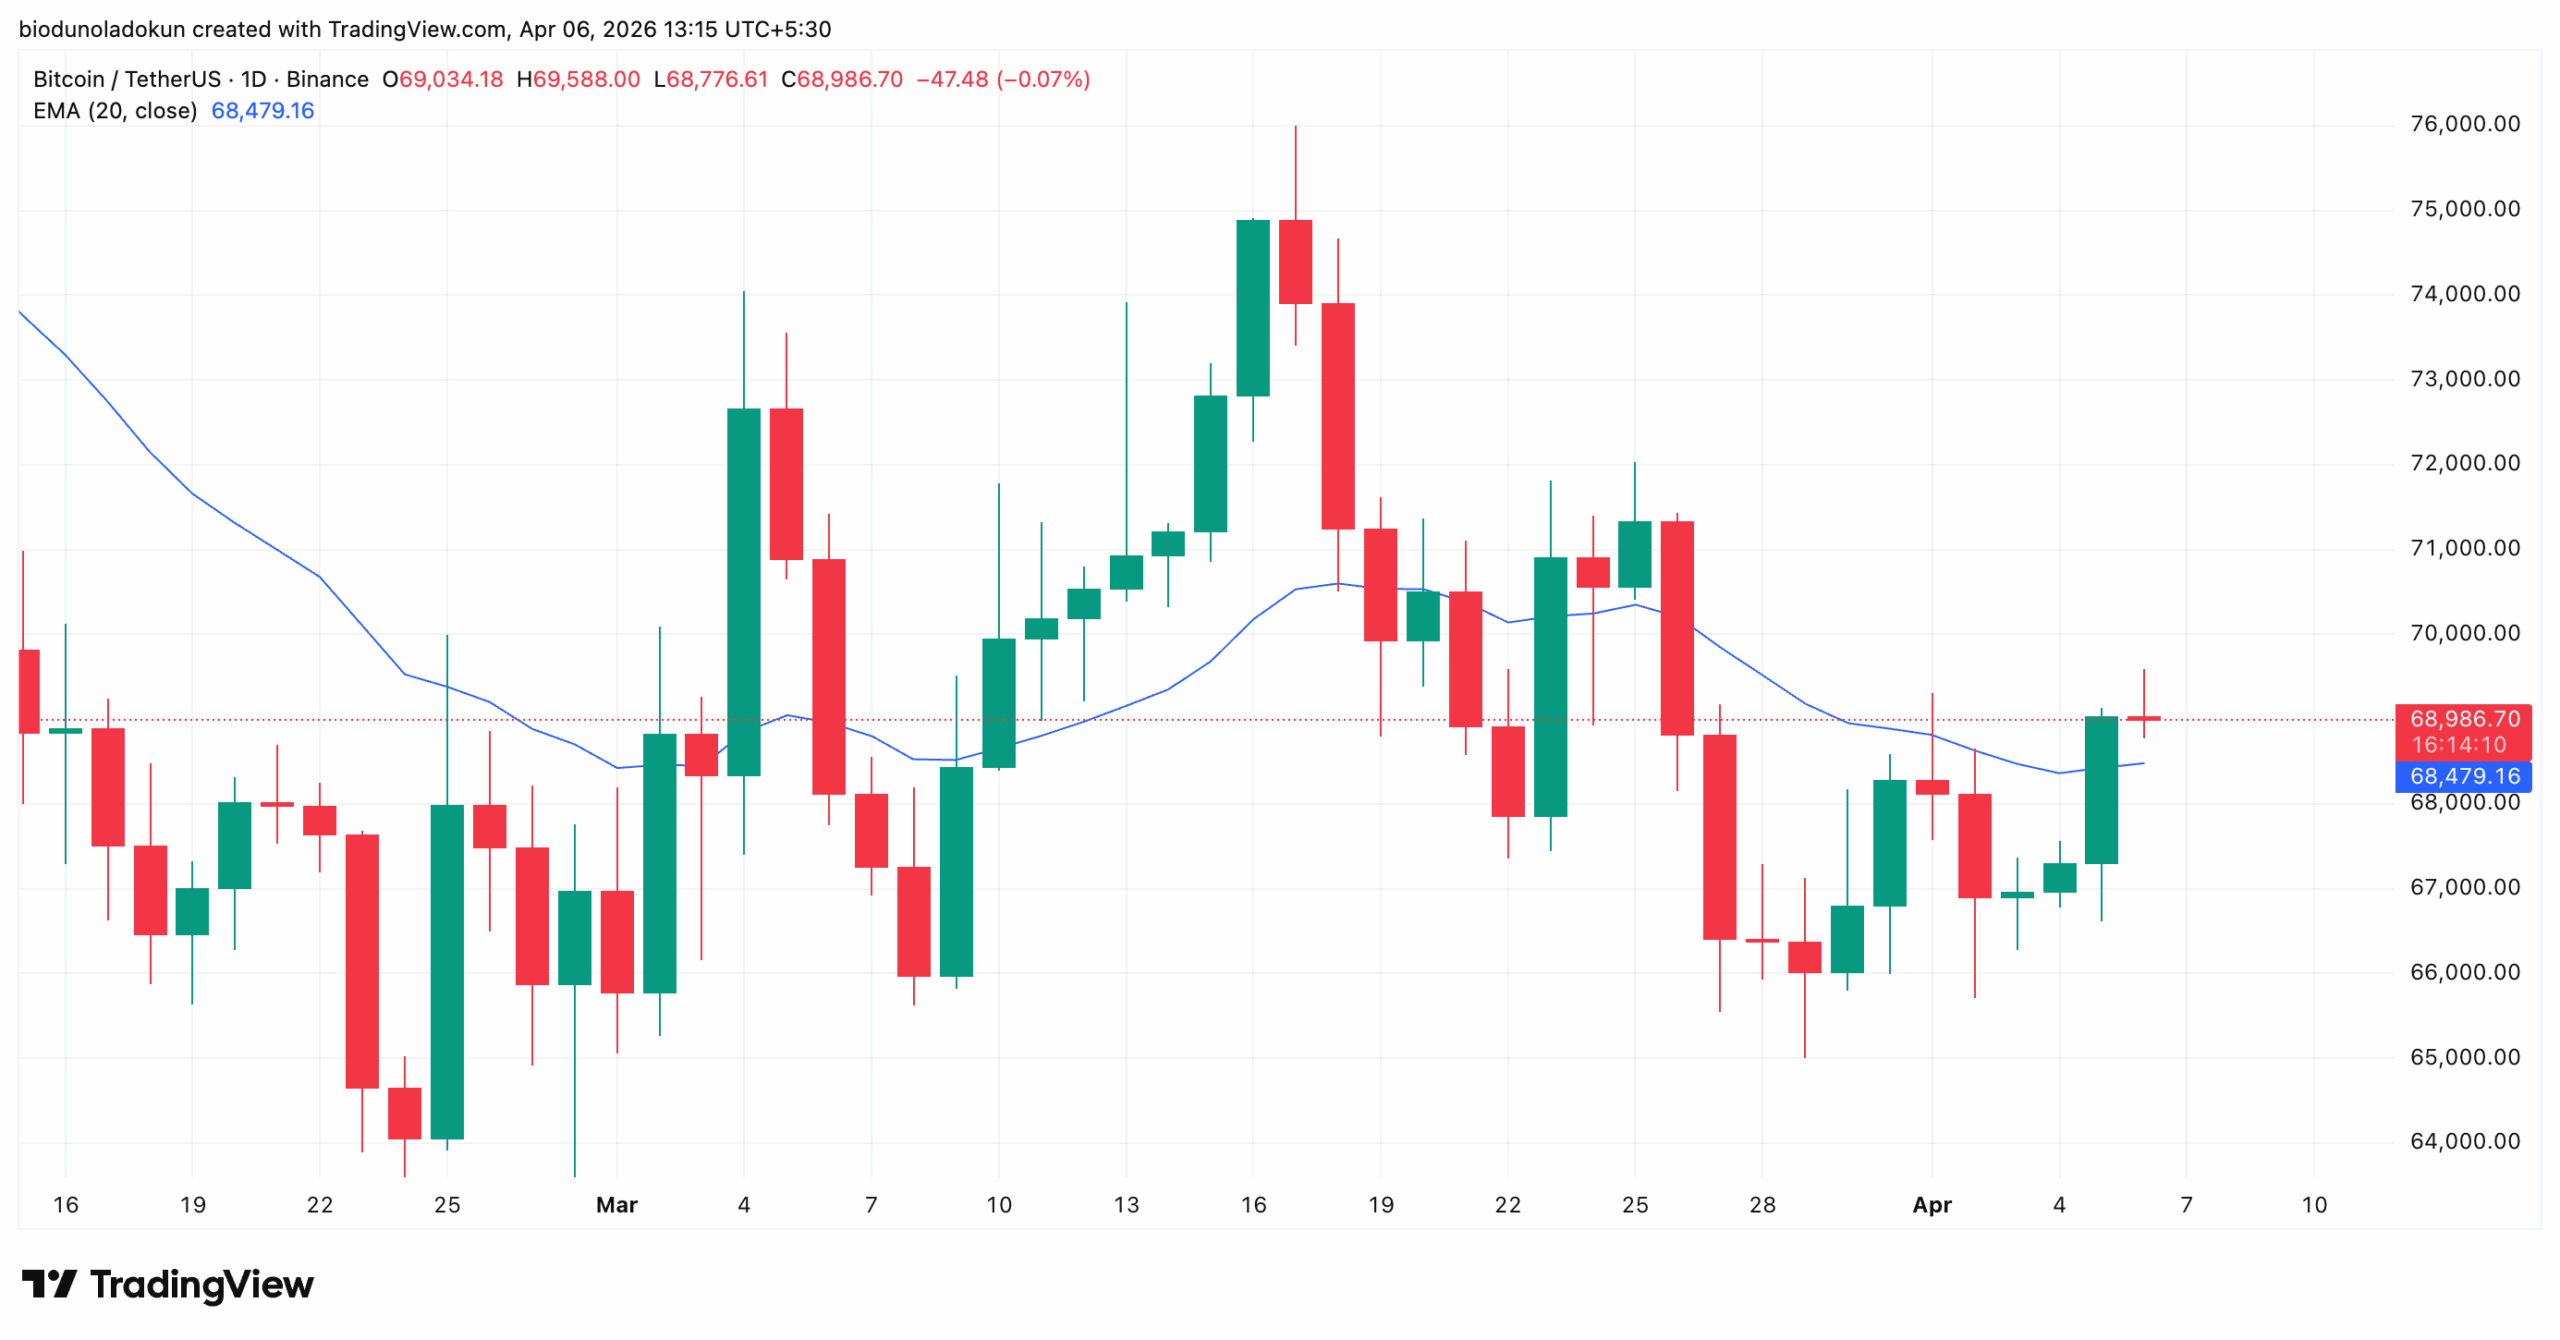
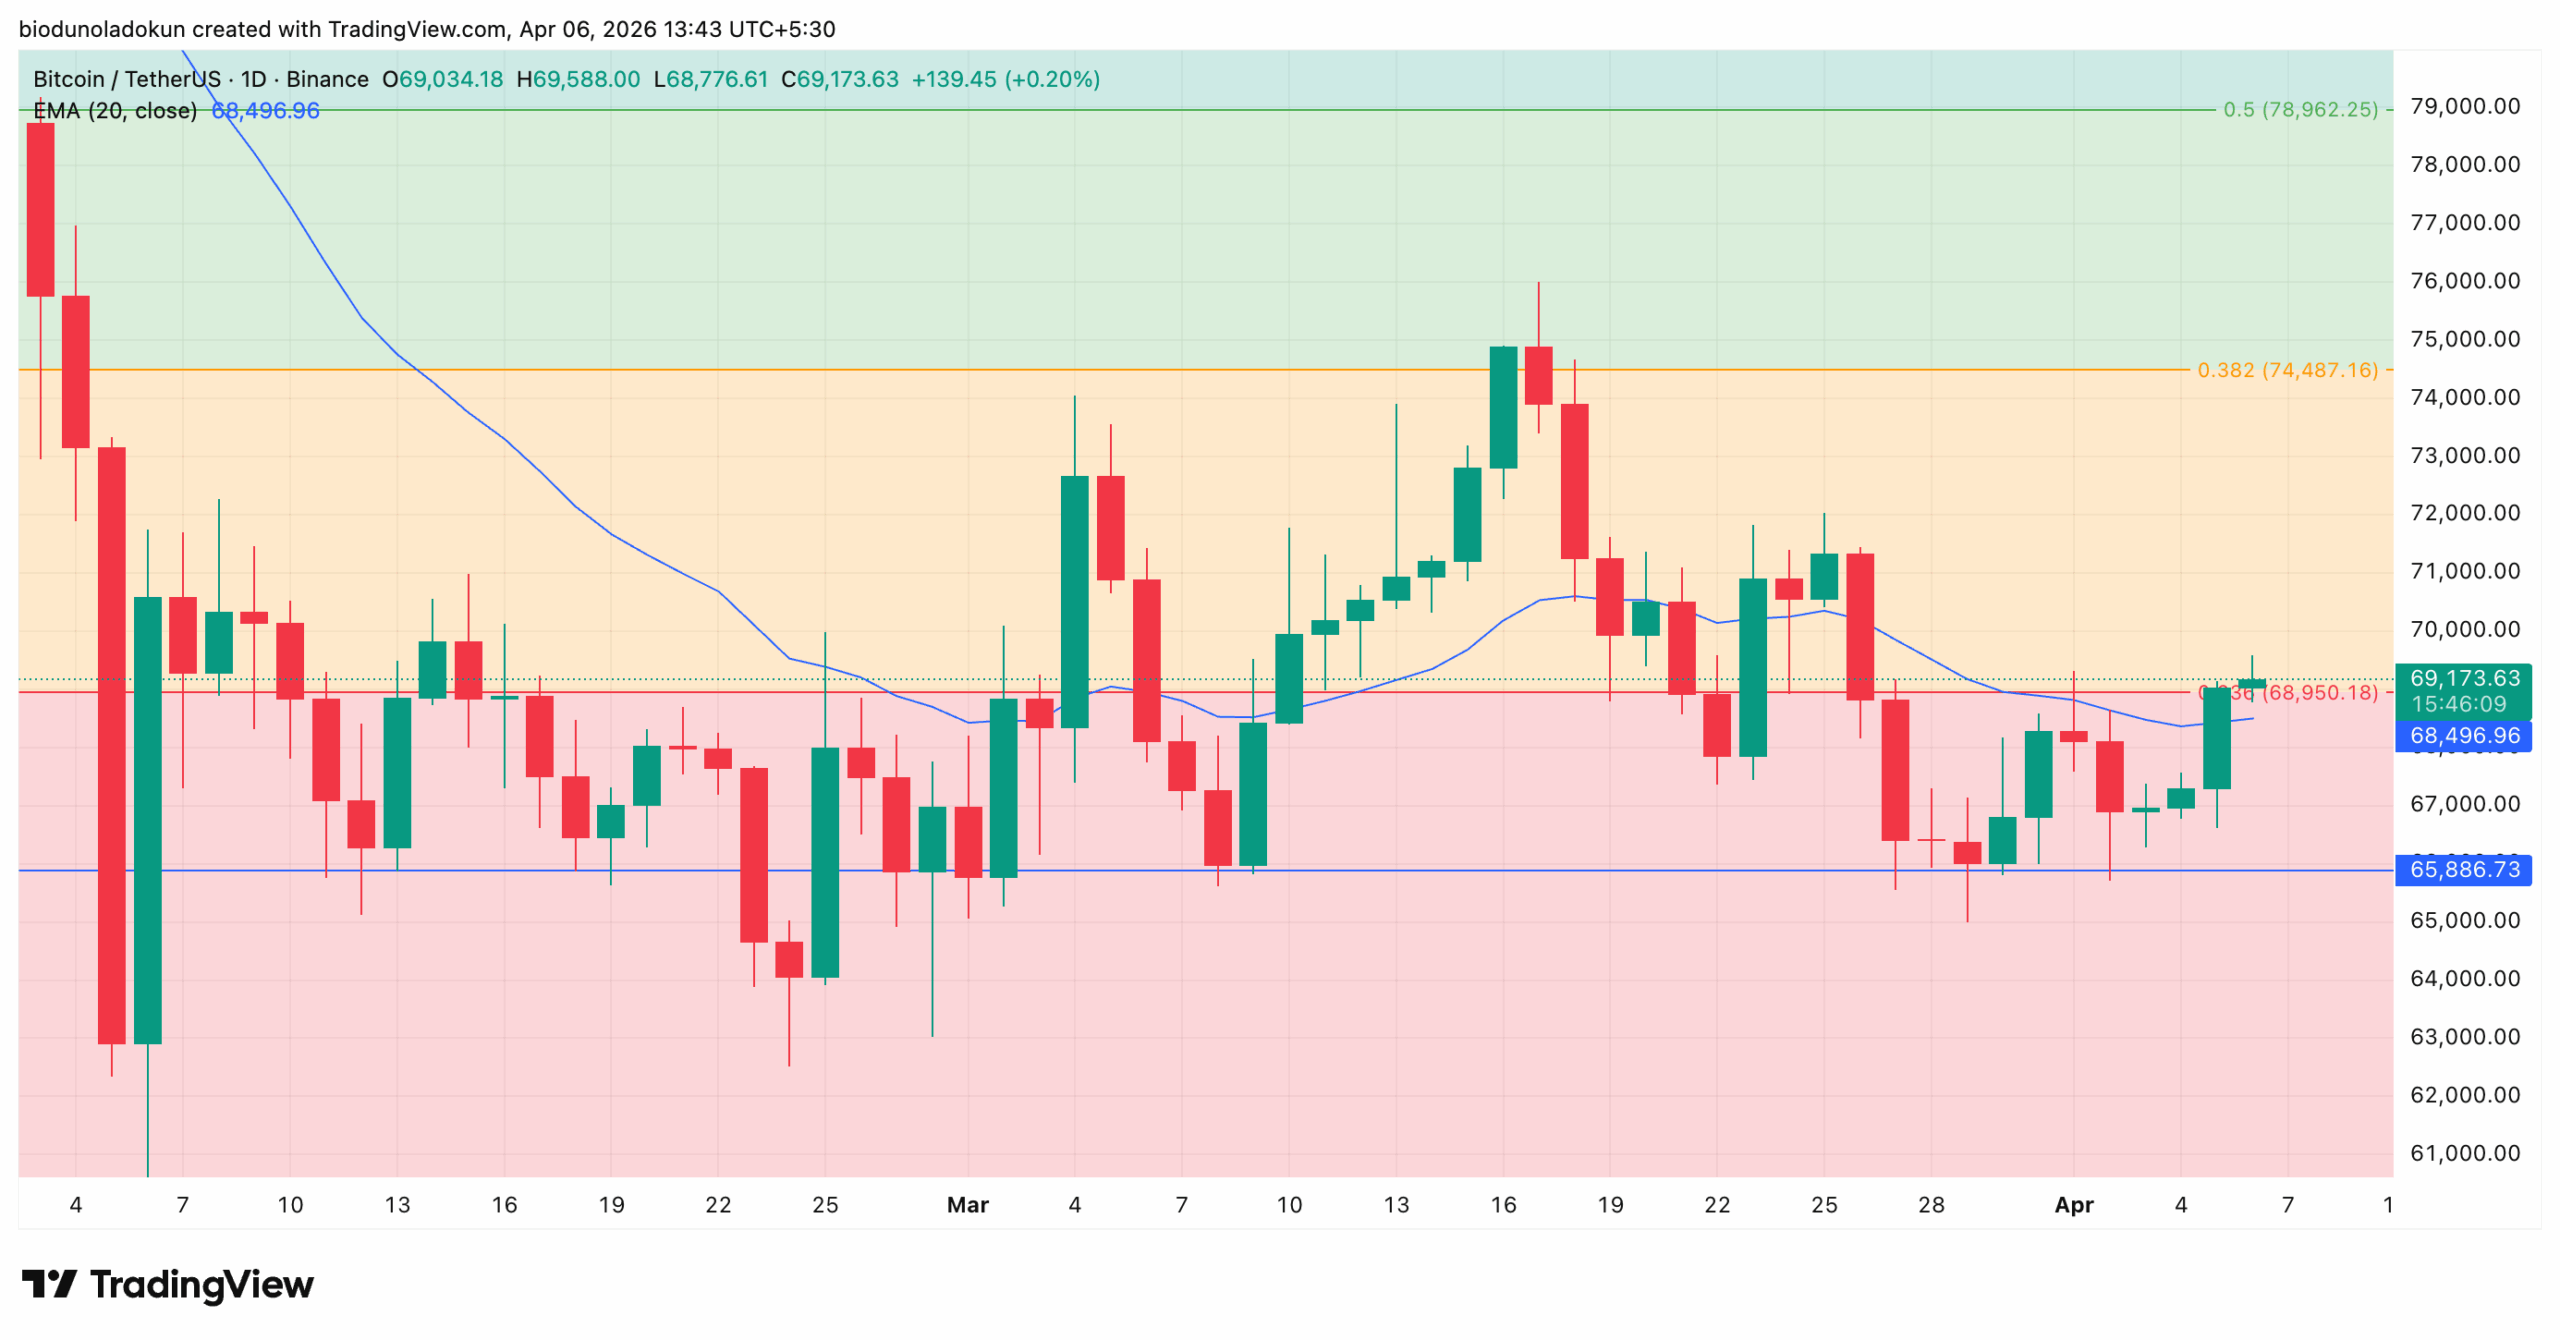
Bitcoin has reclaimed its 20-day EMA, and the RSI has crossed above 50 for the first time since March 25, with both indicators supporting a potential push toward $74,000.
In a new report, CryptoQuant analyst Amr Taha has noted a significant uptick in speculative activity among Bitcoin holders on Binance.
On-chain data signals that derivatives traders are growing increasingly willing to add fresh positions as prices push higher.
This trend, if sustained, could drive a daily close above $70,000 and open the door to a rally toward $74,000. But how soon can this happen?
BTC Traders Are Adding Fresh Exposure
In his report, Taha assessed BTC Binance’s cumulative net taker volume and found that it has recorded notable spikes in recent sessions, a clear bullish indicator.
Per Taha, it climbed above $500 million on March 24 and again on April 1, before rising further to $595 million on April 6.
BTC Binance’s Cumulative Net Taker Volume | Credit: CryptoQuant
Net taker volume measures the difference between aggressive buy orders and aggressive sell orders executed on an exchange.
When it climbs this way, it signals that market participants are opening new positions as price attempts a recovery, rather than simply holding existing exposure.
In addition, BTC’s daily open interest change on Binance has climbed sharply over the past week.
According to the analyst, this rose from $53 million on March 27 to $67 million on April 1, then nearly doubled to $136 million on April 6.
BTC Daily Open Interest Change | Credit: CryptoQuant
Open interest measures the total value of outstanding derivative contracts — futures and options — that have not yet been settled. When it climbs like this, it means new money is actively entering the derivatives market rather than existing positions simply rotating.
Interestingly, BTC’s spot price rose by 2% between April 1 and April 6. The fact that open interest nearly doubled over the same window, while price moved only modestly, signals that traders are building leveraged exposure in anticipation of further upside.
On what these mean, Taha wrote:
“The combination matters because it shows that Bitcoin’s move is being supported not only by price strength, but also by renewed speculative participation in derivatives. In simple terms, traders are becoming more willing to add fresh exposure as BTC pushes higher. If this trend continues, it could reinforce short-term momentum.”
Daily Chart Supports the Case for a Move Toward $74,000
Readings from some key indicators on the BTC daily chart support Taha’s bullish read.
The coin’s price has pushed it above its 20-day exponential moving average (EMA) after spending the better part of a week trading below it.
As of this writing, the 20-day EMA provides dynamic support below BTC at $68,479, positioned to absorb any supply-side pressure that aims to push prices lower.
The 20-day EMA tracks an asset’s average price over the past 20 trading days, giving more weight to recent prices. When the price sits above this indicator, it signals a shift towards a bullish trend.
It suggests that BTC’s short-term price momentum is turning positive, as recent prices (last two sessions) have traded above the 20-day average.
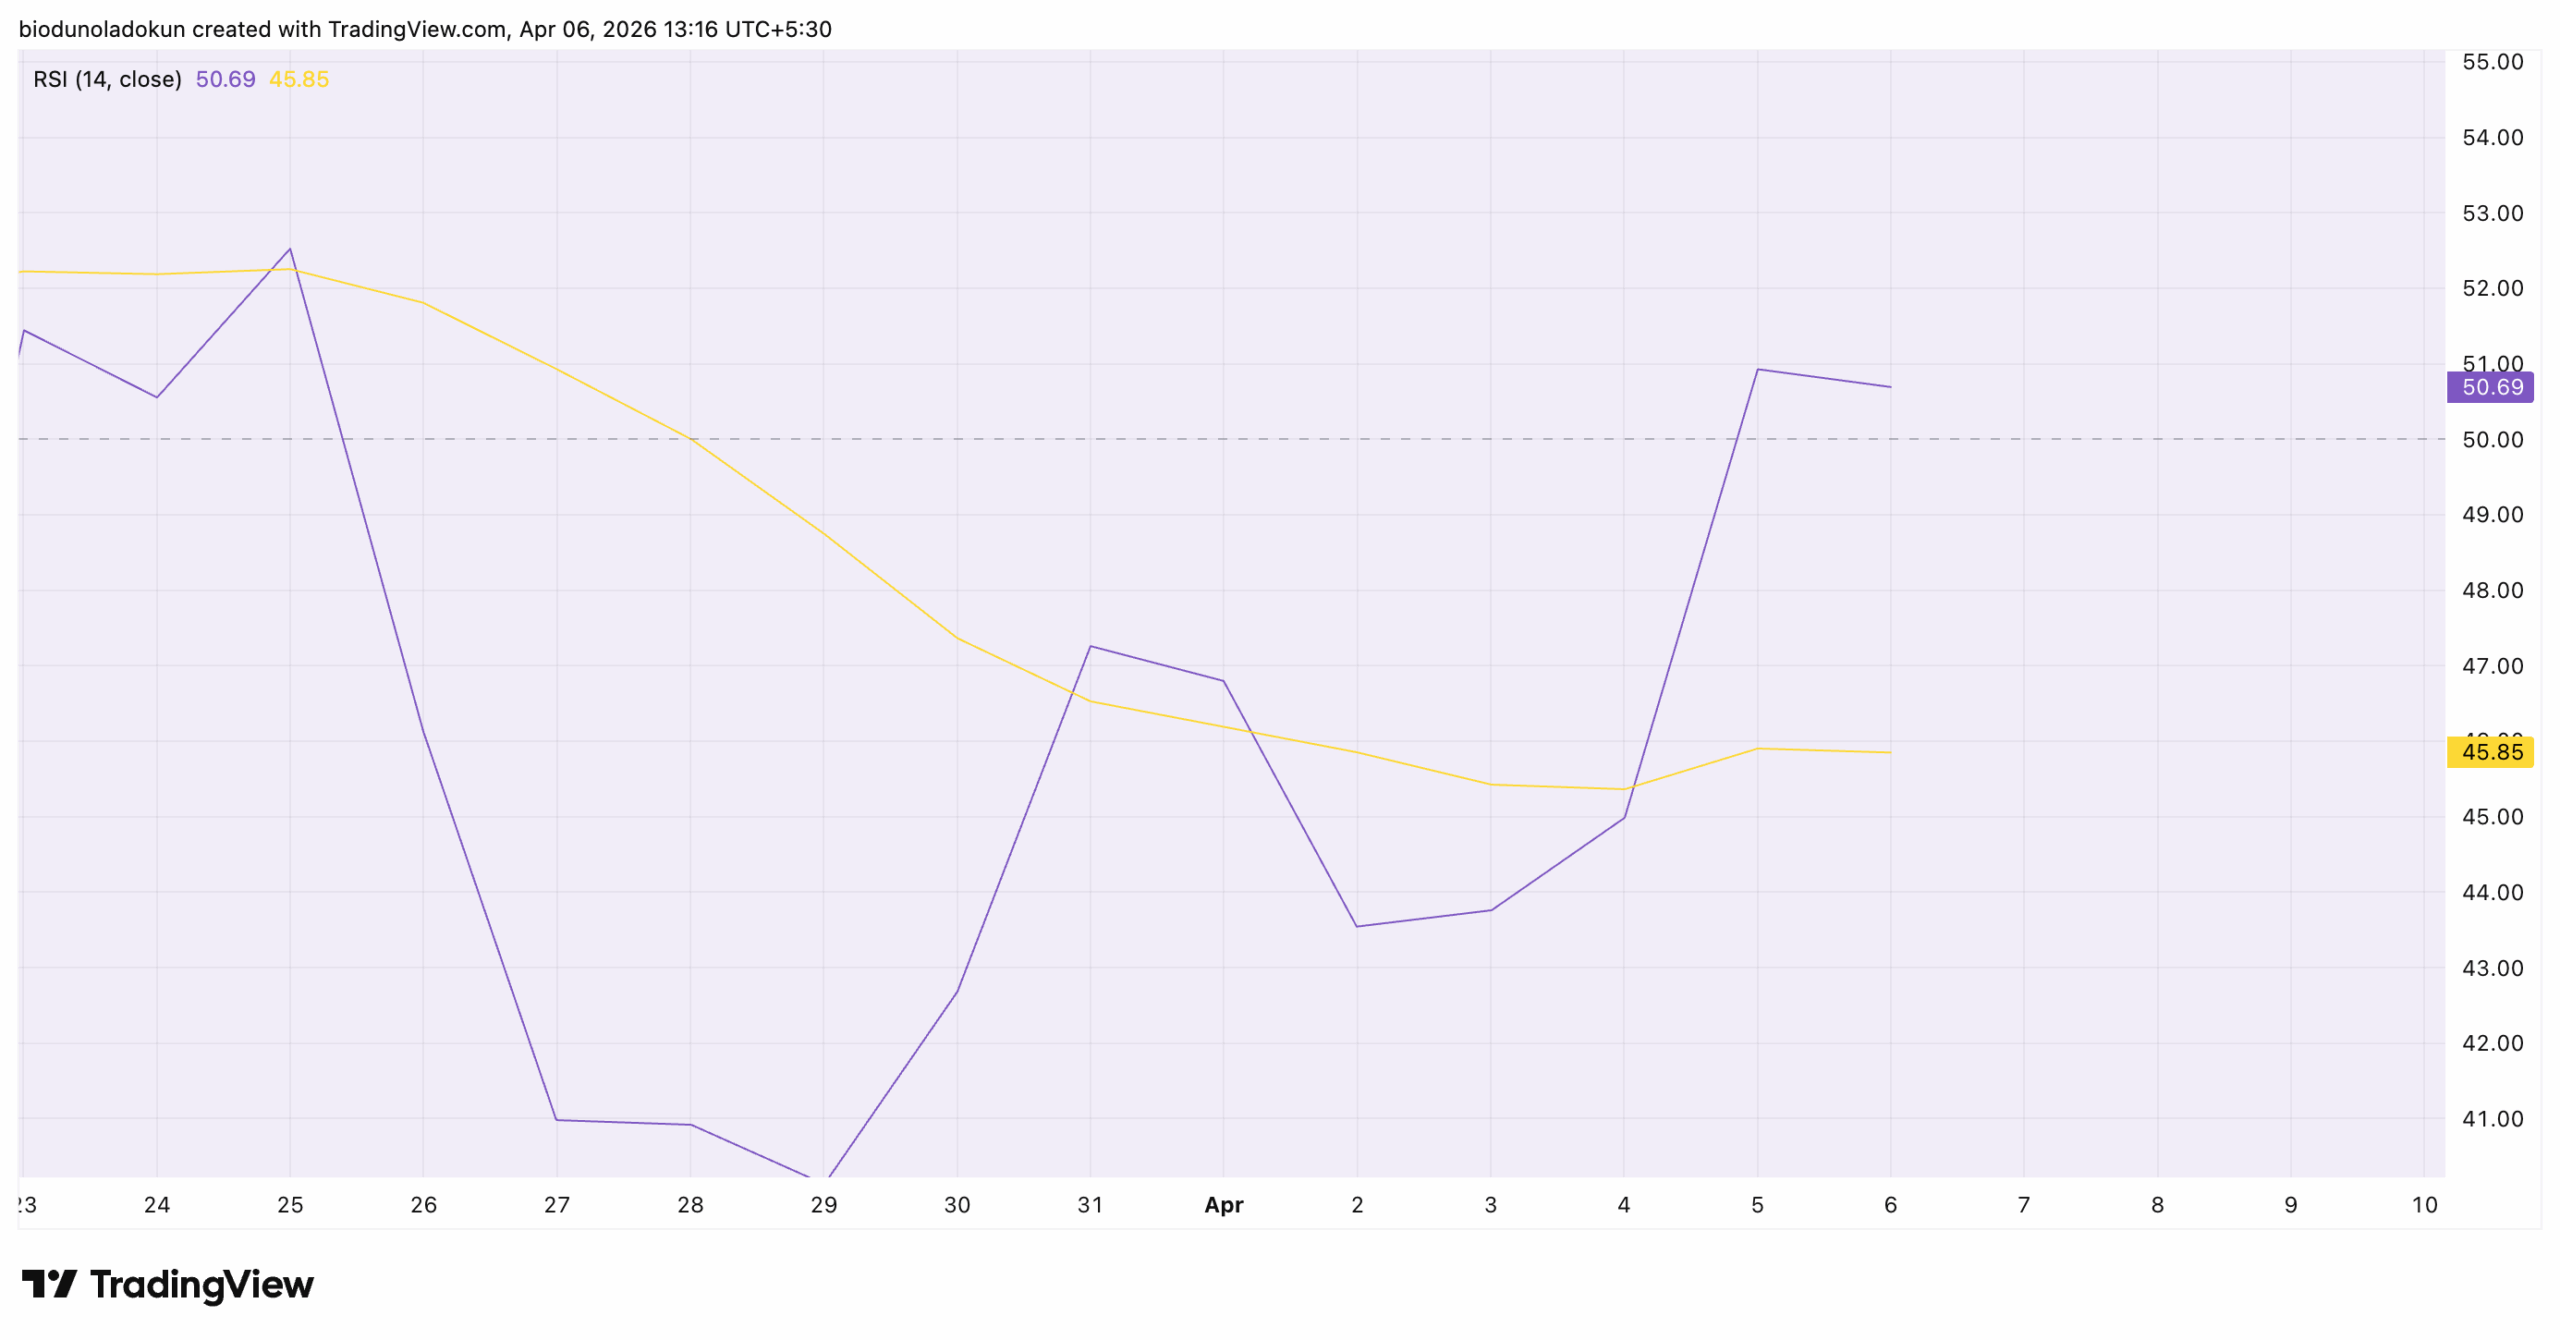
Moreover, the coin’s Relative Strength Index has crossed back above the 50 neutral line for the first time since March 25.
At press time, the momentum indicator is at 50.69, signaling growing strength among BTC buyers.
The RSI indicator measures an asset’s overbought and oversold market conditions. It ranges between 0 and 100.
Values above 70 suggest the asset is overbought and due for a price decline, while values below 30 indicate the asset is oversold and due for a rebound.
At 50.69, BTC is in the early stages of a momentum recovery.
These indicators and Taha’s observations point to one thing: sentiment is gradually shifting, and participation is growing.
If this trend is maintained, a daily close above $70,000 is on the table, and a potential rally toward $74,487 remains well within reach.
However, if profit-taking resumes and sentiment dampens again, BTC could fall under the 20-day EMA and toward $65,886.
Disclaimer:
The information provided in this article is for informational purposes only. It is not intended to be, nor should it be construed as, financial advice. We do not make any warranties regarding the completeness, reliability, or accuracy of this information. All investments involve risk, and past performance does not guarantee future results. We recommend consulting a financial advisor before making any investment decisions.
Abiodun Oladokun is a Research Analyst at CCN, where he covers cryptocurrency markets with a focus on on-chain analysis, technical assessments, and emerging trends across decentralized finance (DeFi), real-world assets (RWA), artificial intelligence (AI), decentralized physical infrastructure networks (DePIN), Layer 2s, and meme coins.
Prior to CCN, he served as a Senior On-Chain Analyst at BeInCrypto, producing market reports spanning diverse crypto sectors.
Before that, he conducted technical analysis and market assessments of various altcoins at AMBCrypto, where he also contributed long-form quarterly research papers on DeFi, NFTs, DAOs, and scaling architectures, leveraging on-chain platforms including Messari, Santiment, DefiLlama, and Dune Analytics.
He began his crypto career as a research analyst at SixthSense DAO, developing blockchain forensic tools to trace the history of stolen assets.
Abiodun is a lawyer called to the Nigerian Bar and the founder of Ilé Ijó, a Lagos-based electronic dance music collective.