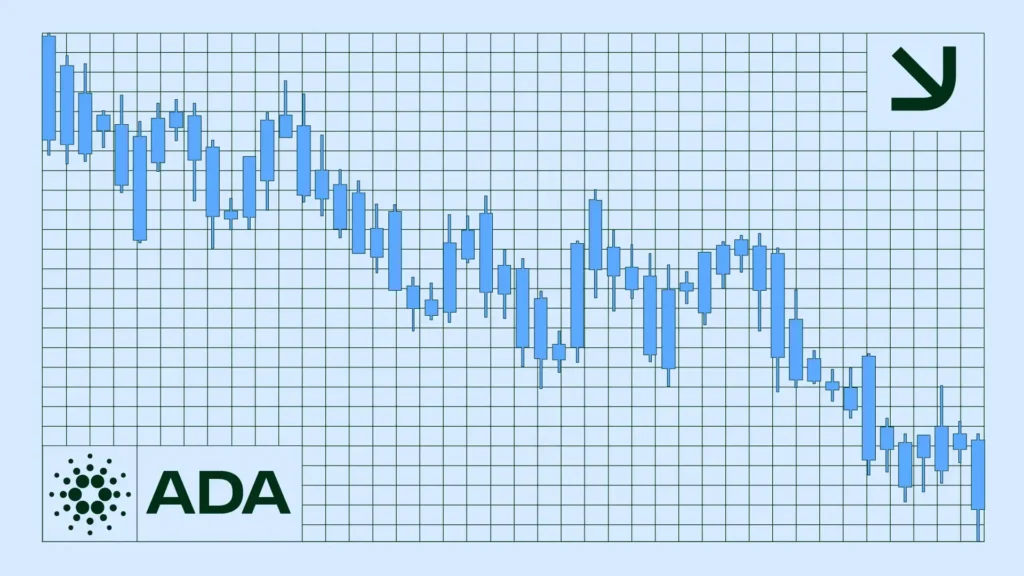
Cardano sees signs of recovery | Credit: Hameem Sarwar
Share
Key Takeaways
Cardano is showing early recovery signs as price pushes toward resistance around $0.26.
Technical indicators and Cardano on-chain data suggest accumulation may be returning.
Here is why a move above $0.27 could drive gains toward above the $0.30 resistance.
Cardano (ADA) is showing early signs of recovery after weeks of sustained downward pressure, with price action now testing key resistance levels as momentum indicators begin to turn positive.
Cardano Tests Resistance
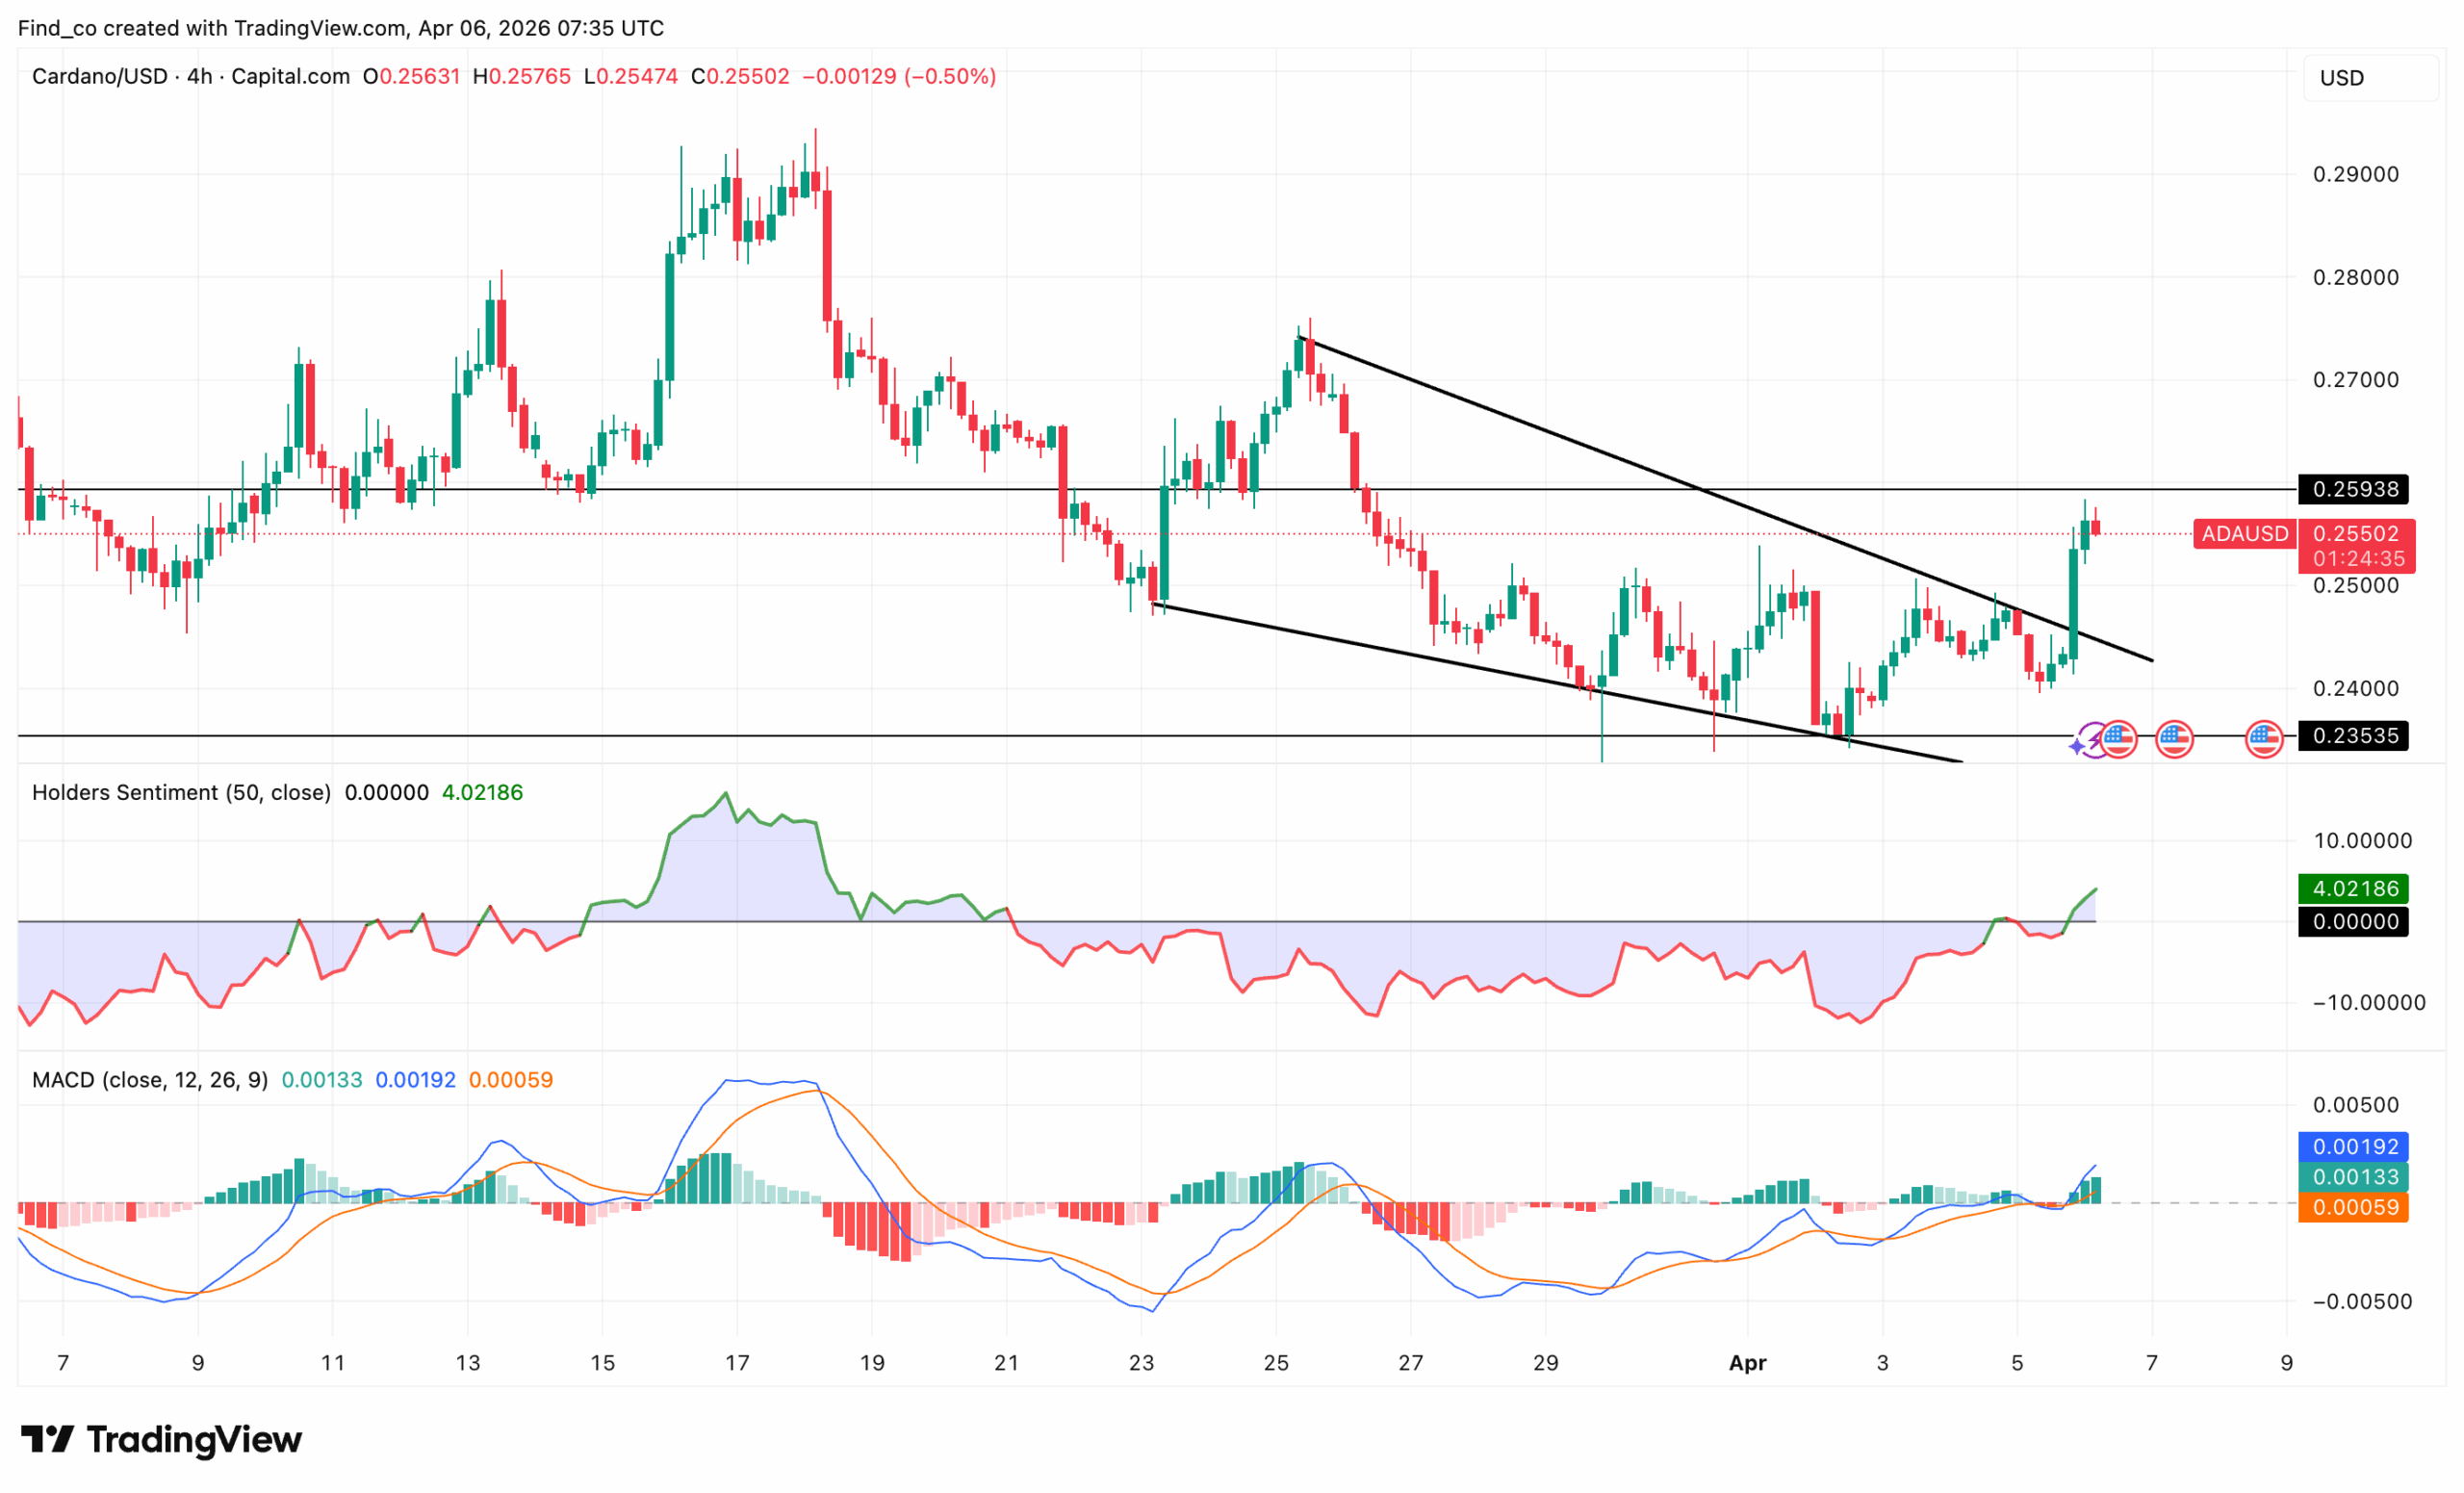
On the 4-hour chart, ADA has been trading within a clear descending channel since mid-March.
However, the latest move stands out. ADA has pushed sharply upward toward the upper boundary of this channel, currently hovering around $0.255.
This area is significant as it aligns closely with horizontal resistance near $0.26, which has previously acted as a support-turned-resistance zone.
At the same time, momentum is shifting. The Moving Average Convergence Divergence (MACD) on the 4-hour timeframe has crossed into bullish territory, with the signal line trending upward. Histogram bars are also flipping green.
This suggests that buying pressure is gradually returning.
Meanwhile, holders’ sentiment has moved into positive territory. This shift indicates that market participants are becoming more confident, often a precursor to stronger price action.
However, the structure is not yet fully bullish. The descending channel remains intact.
Until ADA breaks and closes above the upper trendline, the broader short-term trend still favors sellers. In other words, the current rally could either break out or fade into another lower high.
Accunmulation Begins
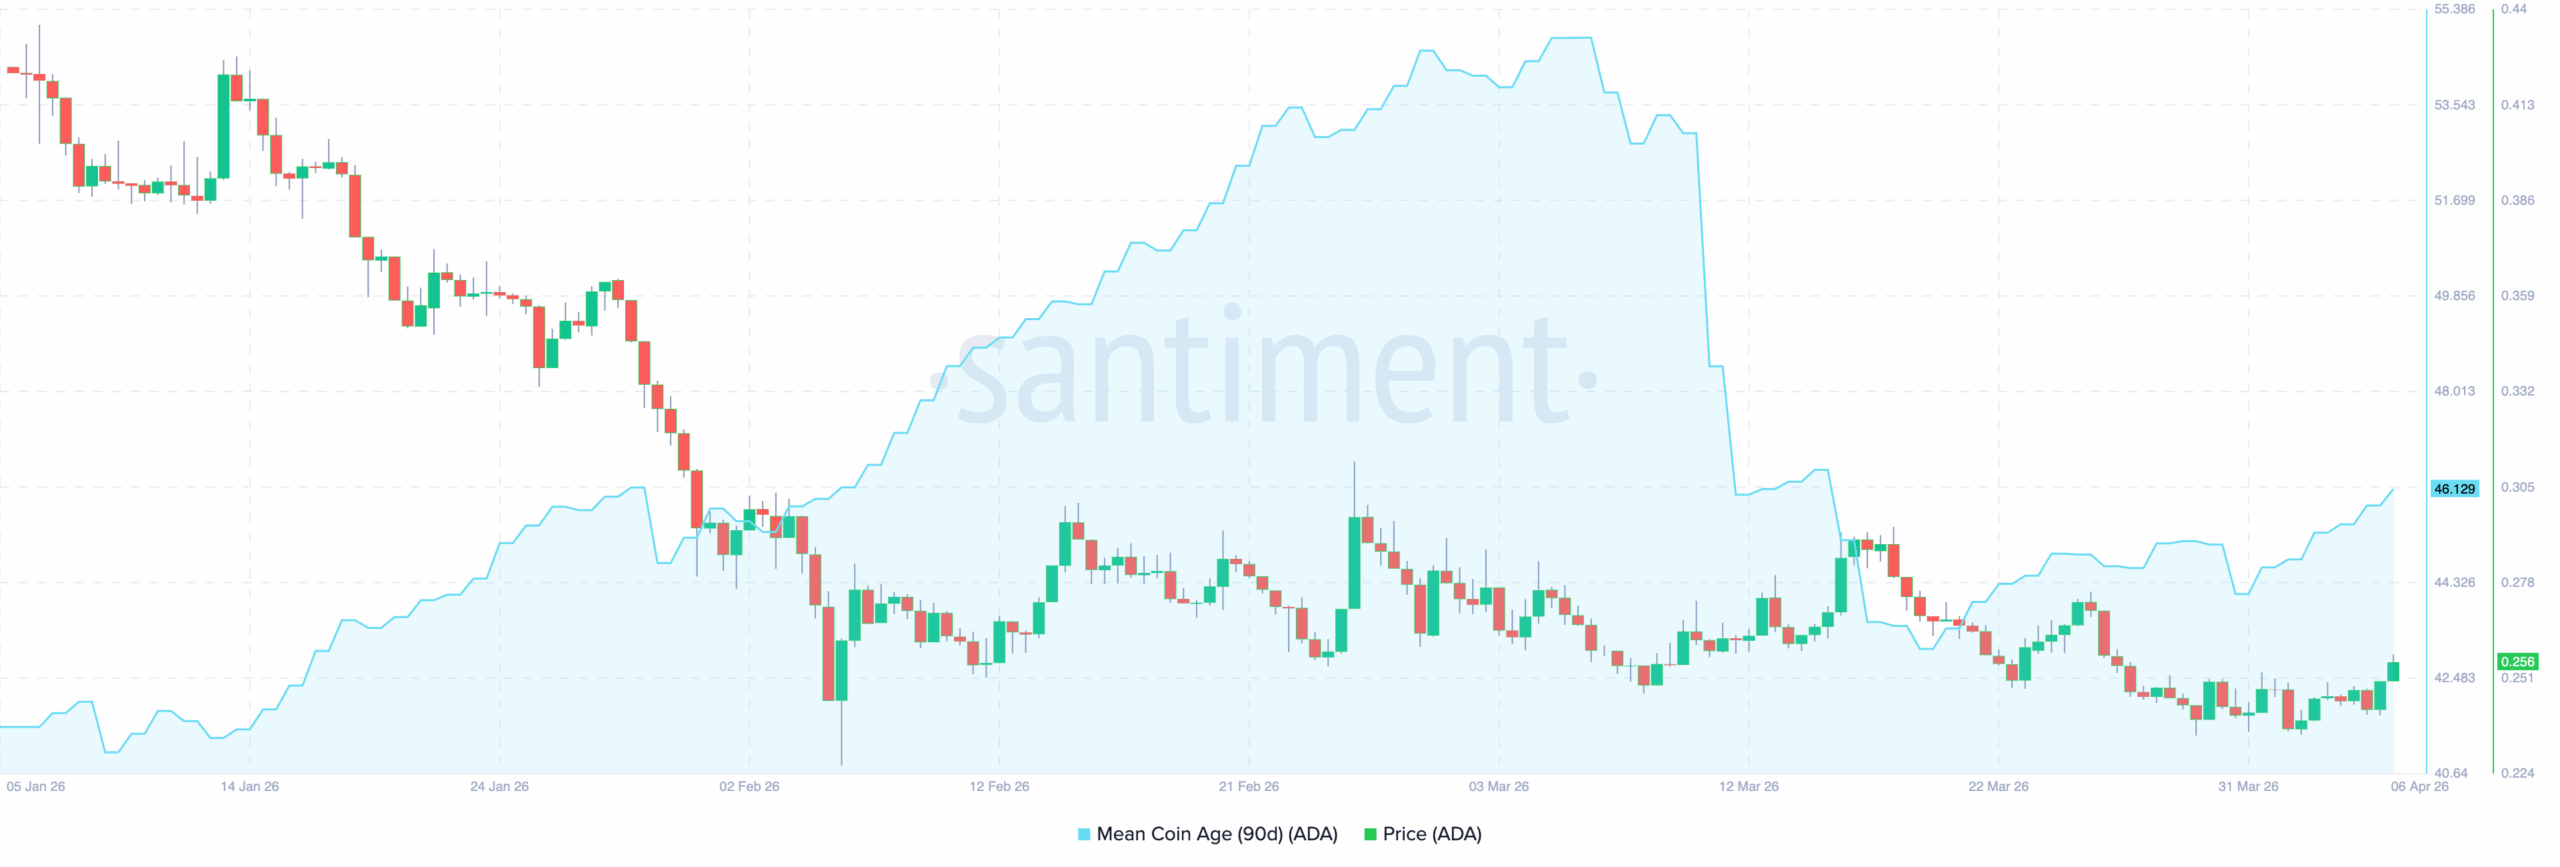
Looking at the on-chain condition adds more context. The Mean Coin Age (90-day) metric had been rising steadily through February, signaling accumulation.
Importantly, this renewed holding behavior aligns with the recent price stabilization.
ADA Price Outlook: Breakout Soon?
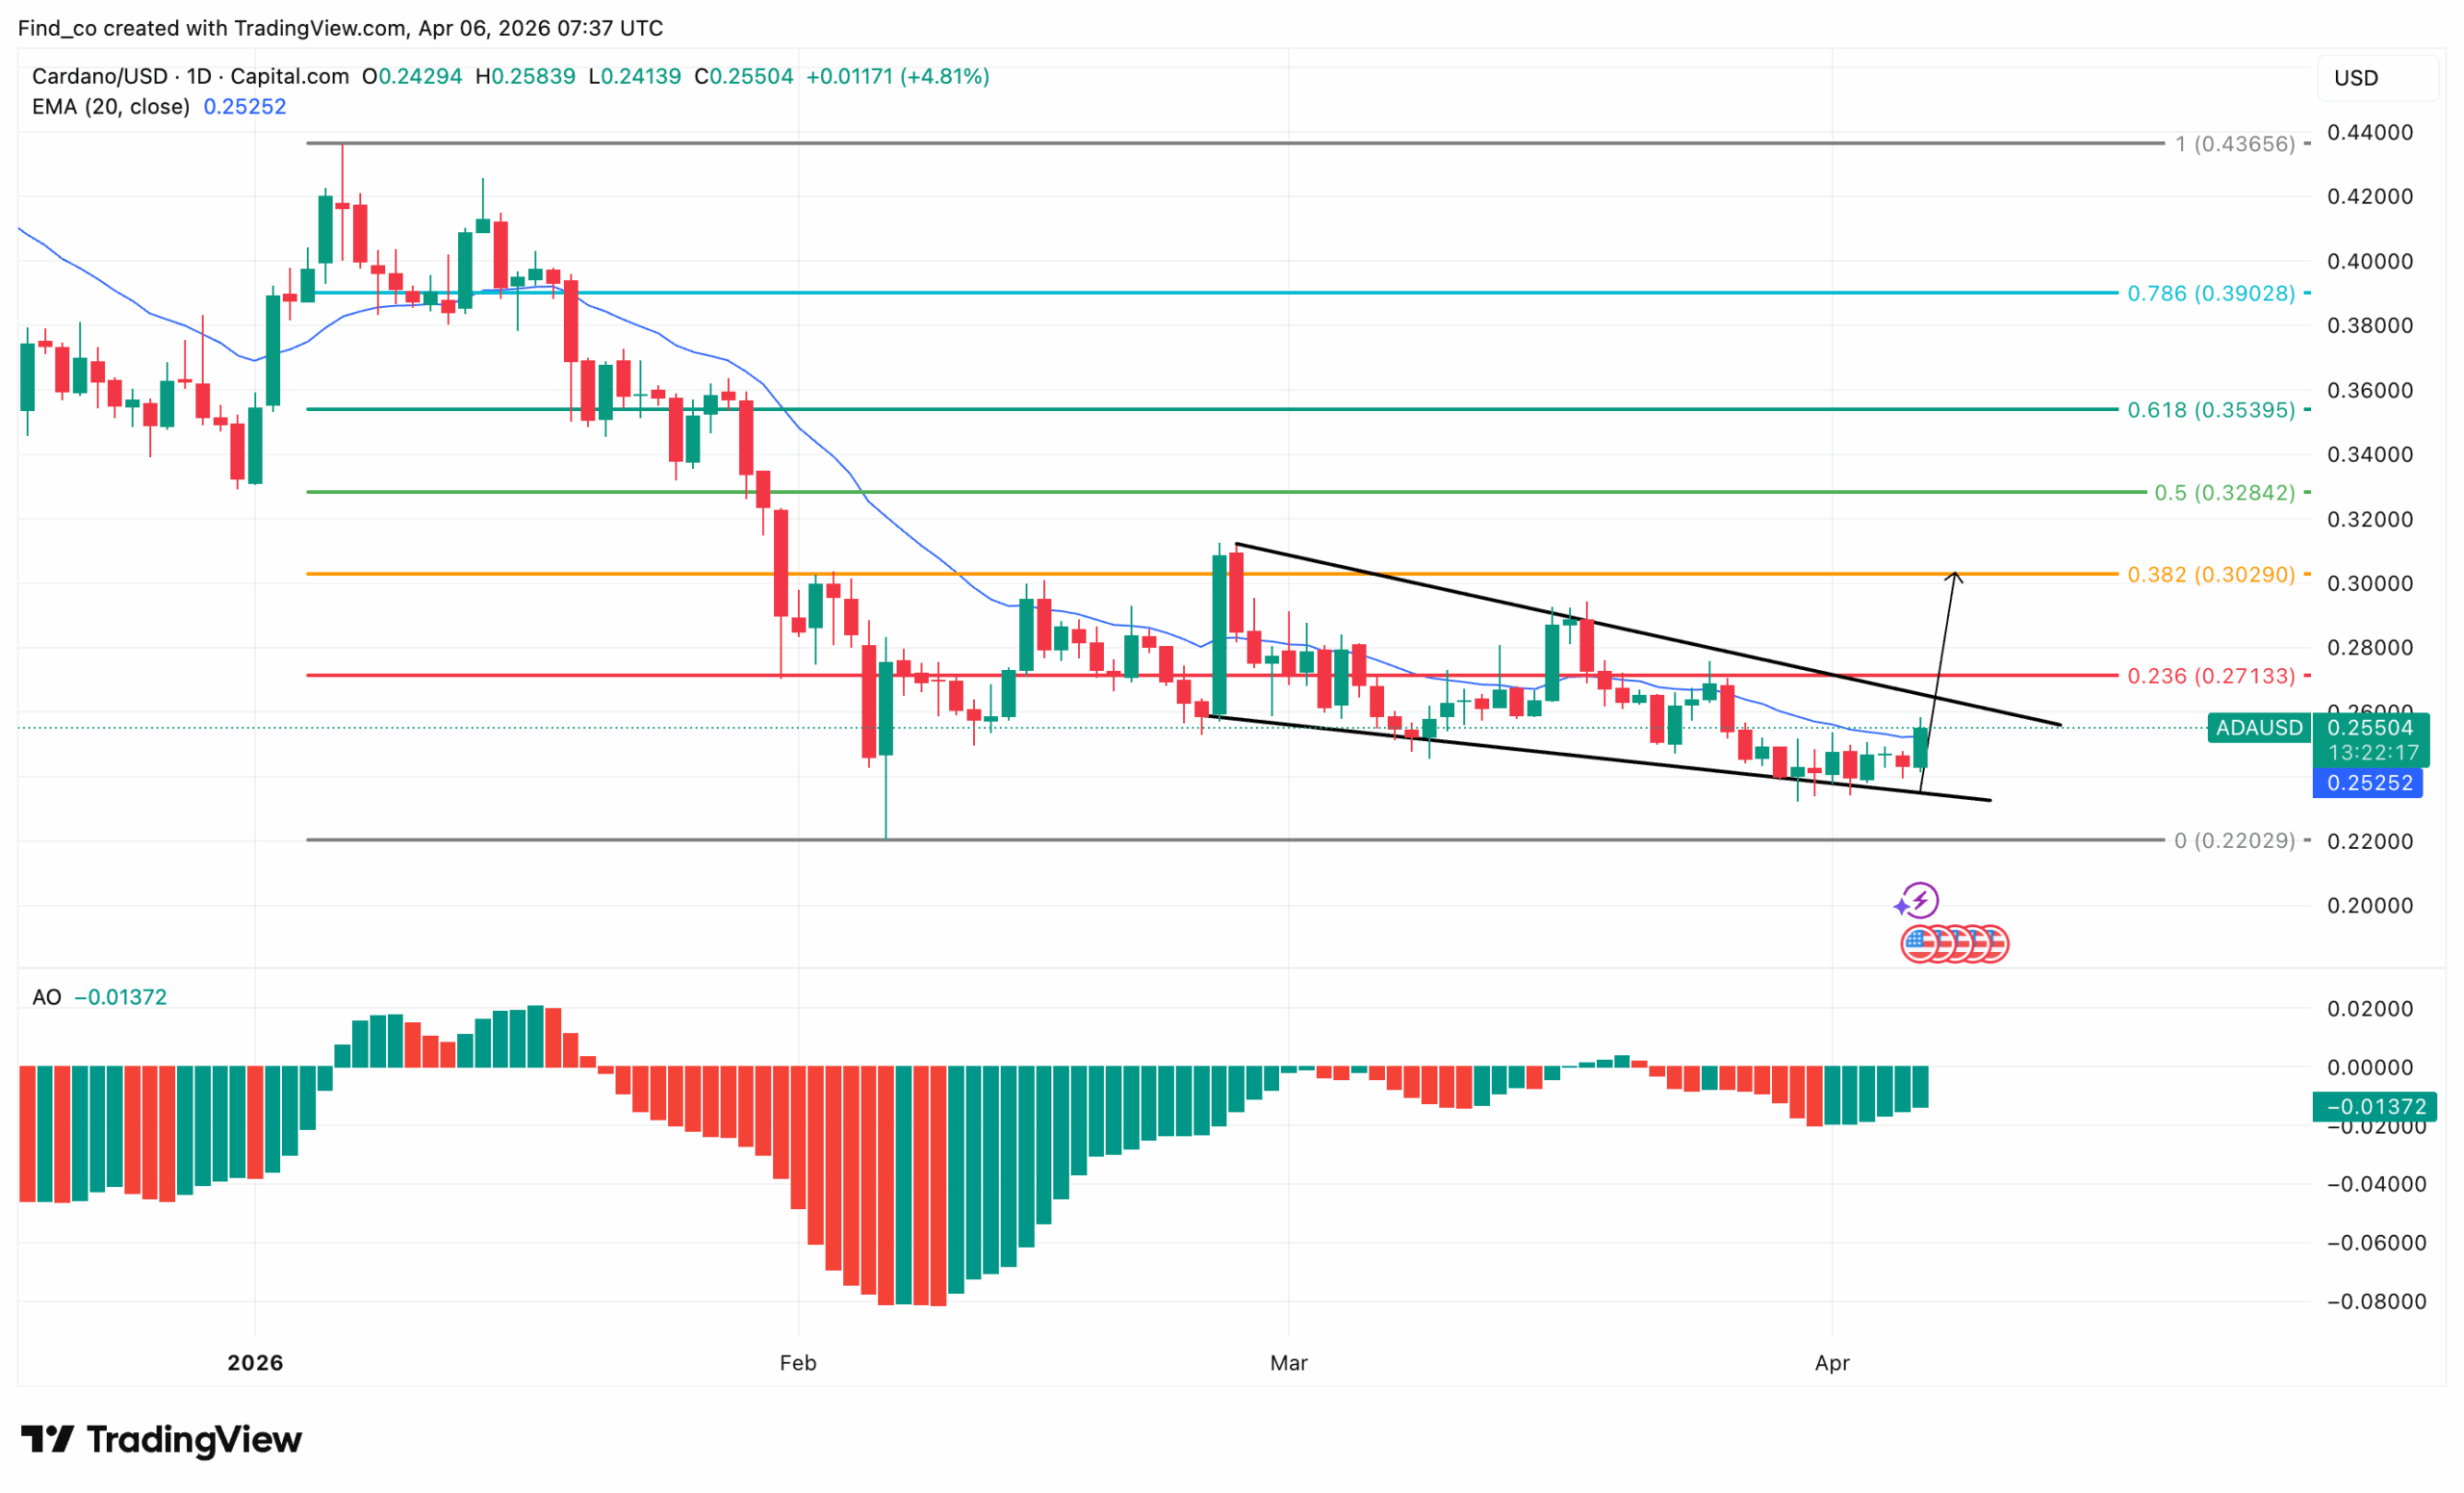
On the daily chart, the broader picture becomes clearer. Cardano’s price is still trading below its 20-day EMA, which sits around $0.26.
This level is now acting as crucial resistance.
The price has just pushed into this zone, making it a critical decision point. A break above the EMA would strengthen the bullish case.
In addition, Fibonacci retracement levels highlight key upside targets.
The 0.236 level near $0.271 remains the first major resistance. Beyond that, the 0.382 level at approximately $0.30 stands as a more significant barrier.
Notably, the descending trendline on the daily chart converges near this region, reinforcing it as a strong confluence zone.
Momentum indicators on the daily timeframe also show improvement.
The Awesome Oscillator (AO) is still negative, but the histogram is rising toward the zero line. This suggests that bearish momentum is weakening. If this trend continues, a bullish crossover could follow.
In the short term, the immediate focus is on the $0.26 resistance zone.
If bulls manage to break above the descending channel and secure a 4-hour close above this region, the next move could extend toward $0.27.
However, failure to break resistance would likely result in rejection. In that scenario, ADA could pull back toward the channel’s lower boundary near $0.24.
Disclaimer:
The information provided in this article is for informational purposes only. It is not intended to be, nor should it be construed as, financial advice. We do not make any warranties regarding the completeness, reliability, or accuracy of this information. All investments involve risk, and past performance does not guarantee future results. We recommend consulting a financial advisor before making any investment decisions.
Victor Olanrewaju is a crypto analyst and reporter at CCN with deep roots in on-chain research and technical analysis. His crypto journey began in 2017, but it was the 2020 Uniswap airdrop that sparked a full-time pivot into the space.
With a foundation in copywriting, Victor honed his craft creating high-converting content for leading crypto brokers — most notably an XRP price prediction that ranked #1 on Google during the 2021 bull run.
He later joined AMBCrypto in 2022, where he combined storytelling with technical and on-chain analysis to cover key market narratives.
In 2024, he expanded his expertise at BeInCrypto, collaborating with analysts and using tools like Glassnode, Santiment, and IntoTheBlock to break down Bitcoin and altcoin trends.
At CCN, Victor covers the top cryptocurrencies, memecoins, macro shifts, blending real-time insights with deep-dive metrics.
He holds a Bachelor’s degree in Physics from the University of Ibadan, equipping him to simplify complex data for a wide audience. Follow his work or connect on LinkedIn or X.